Advertisement
Advertisement

Natural Gas and Oil Forecast: US Output Surge Pressures Prices; Sell Now?

By:
Arslan Ali
Updated: May 1, 2024, 10:52 GMT+00:00

Key Points:

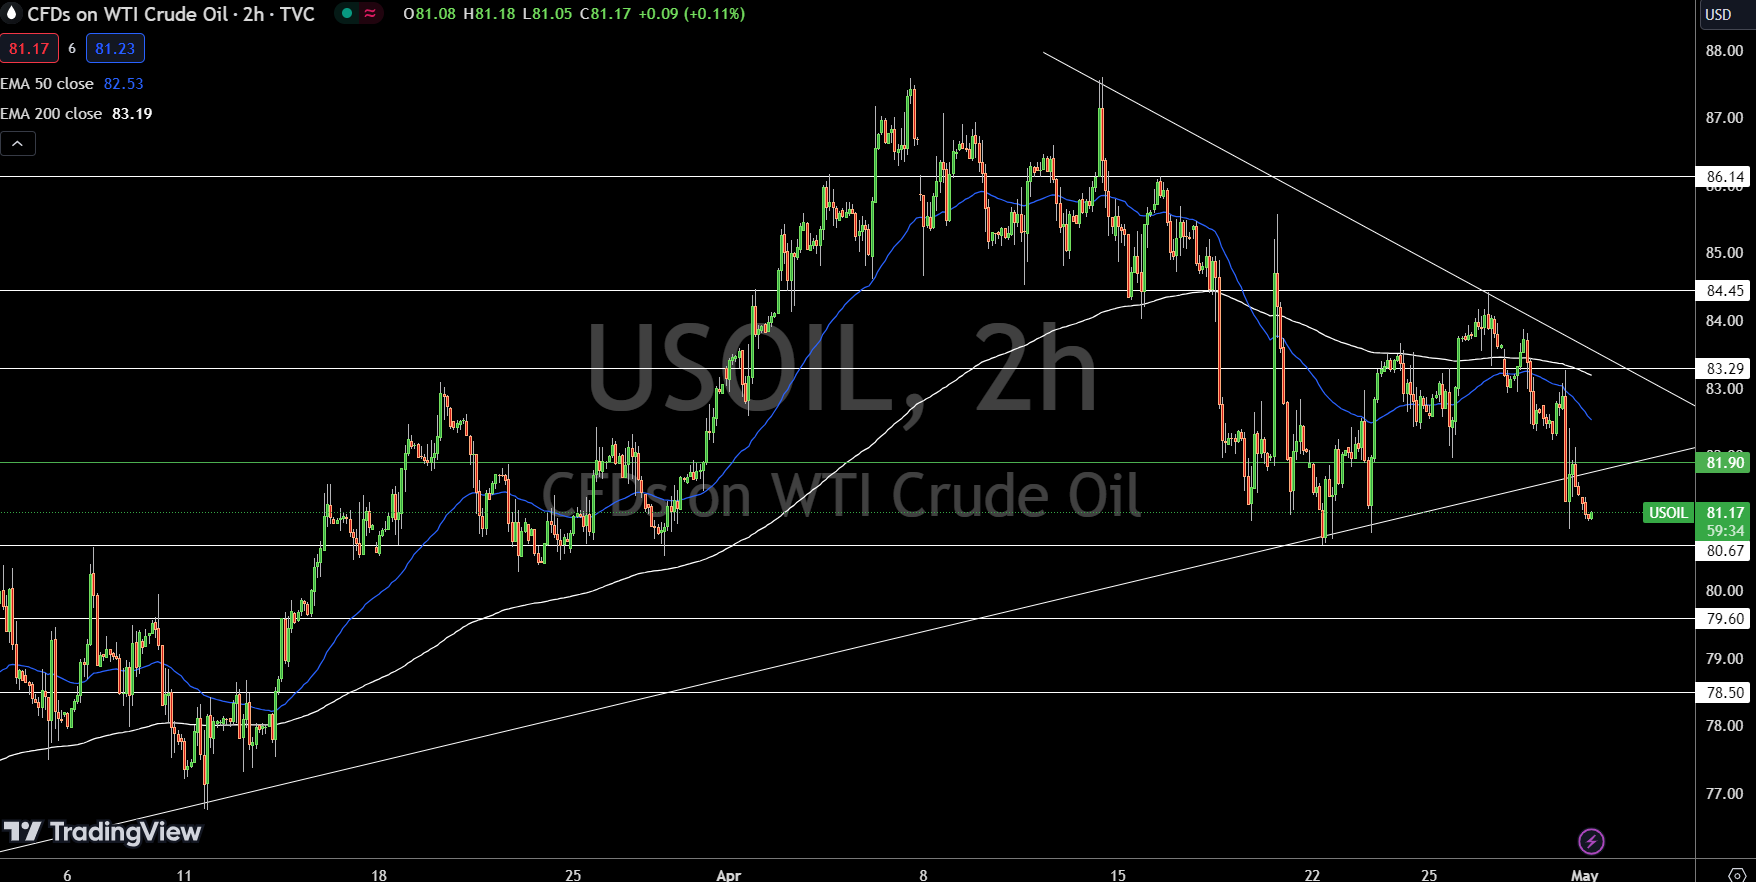
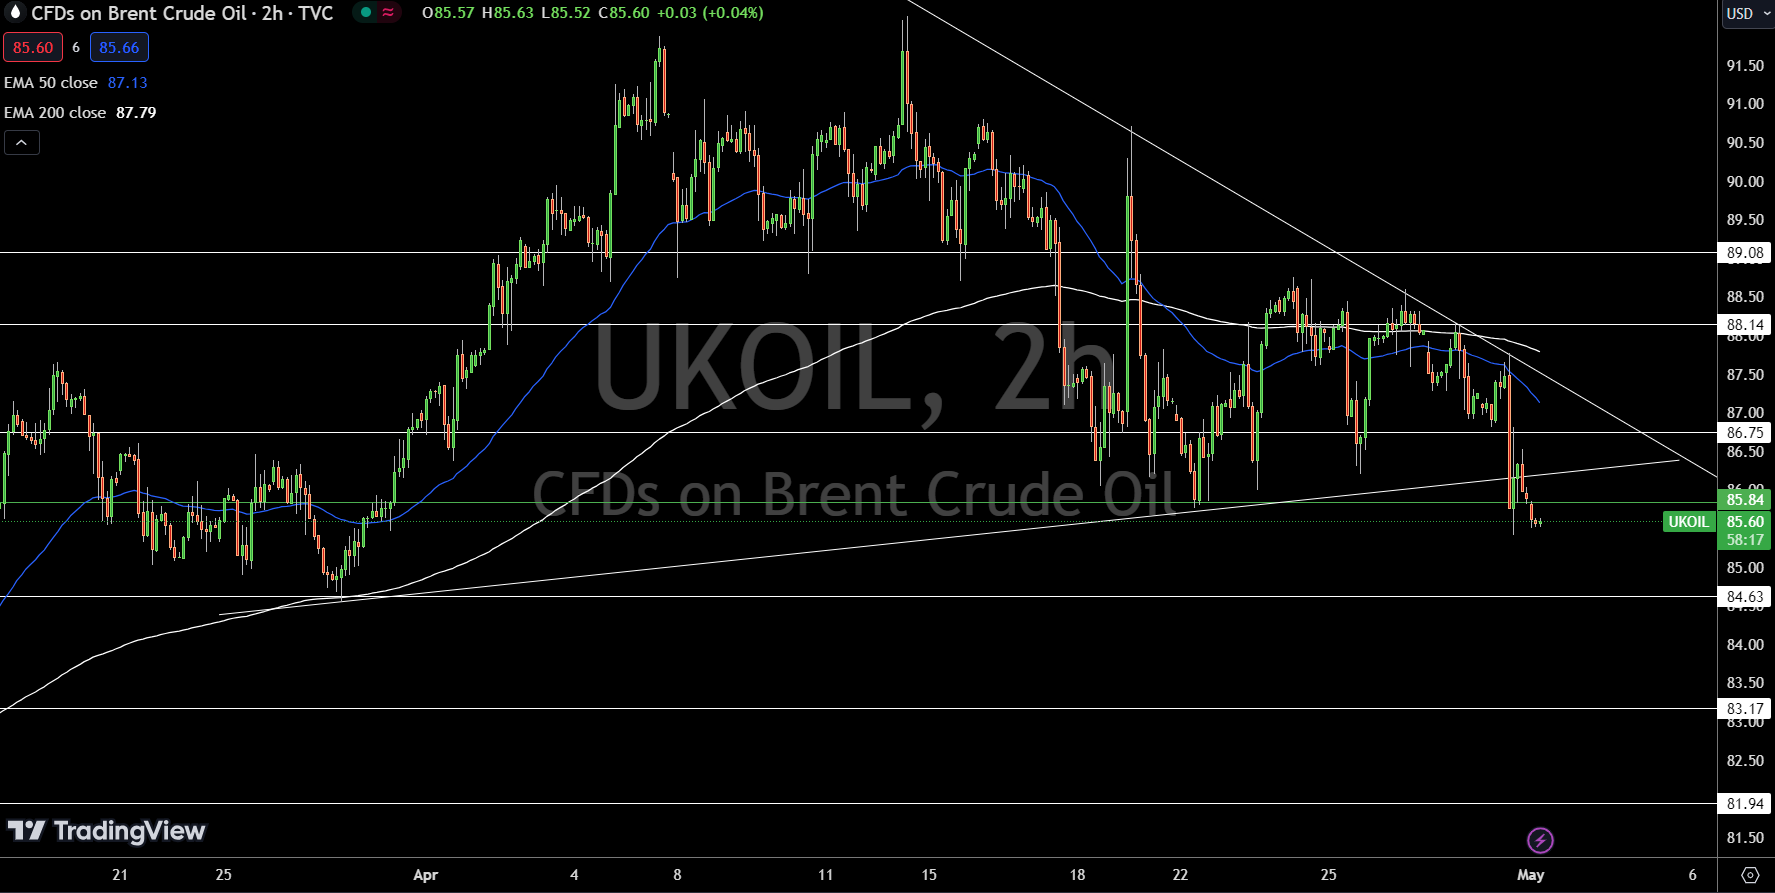
  • Rising U.S. oil production and ceasefire hopes press oil prices lower.
  • OPEC's output cut by 100,000 barrels offers minimal support against declines.
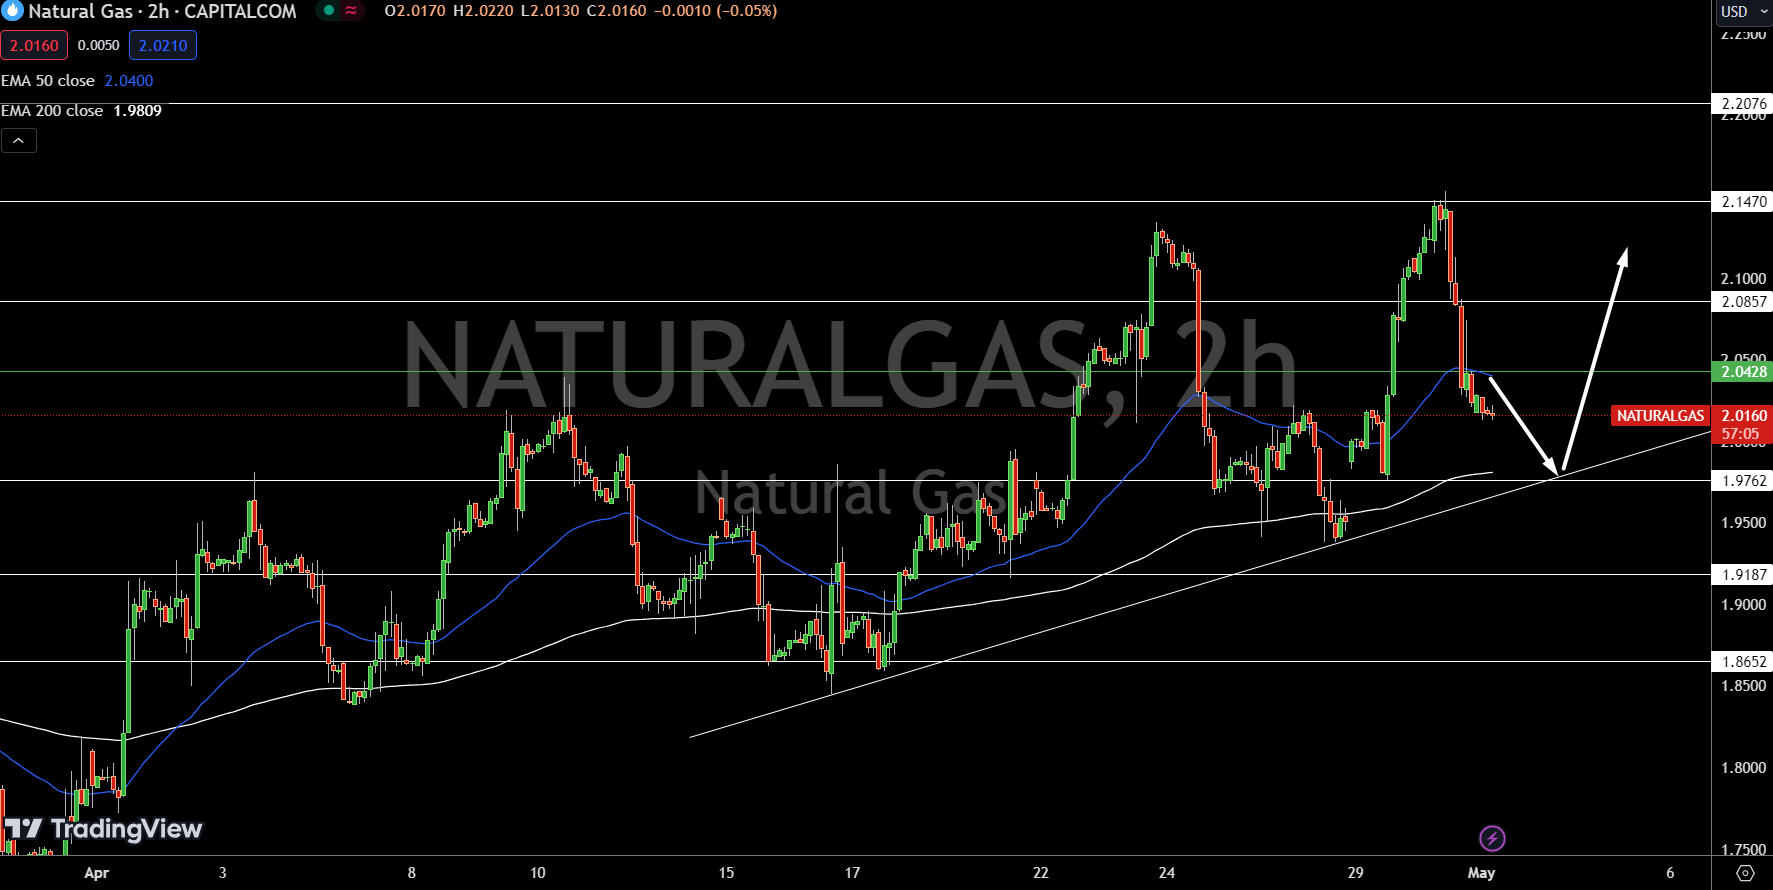
  • Natural Gas shows a bearish trend, needs to break above $2.04 for reversal.
Energy Recap

In this article:

Market Overview

Natural Gas Price Forecast

Natural Gas (NG) Price Chart

Natural Gas (NG) is currently priced at $2.01, marking a decrease of 0.40% from the previous session. The commodity is trading below its pivot point at $2.04, indicating a bearish trend in the short term. Resistance levels are identified at $2.09, $2.15, and $2.21, which Natural Gas would need to overcome to shift to a bullish trajectory.

Support levels are situated at $1.98, $1.92, and $1.87, providing potential areas where declines might stabilize. The 50-Day and 200-Day Exponential Moving Averages, positioned at $2.04 and $1.98 respectively, suggest a narrow range of trading that underscores the current market volatility. The bearish outlook for Natural Gas persists below $2.04, with potential for a bullish reversal if it breaks above this key threshold.

WTI Oil Price Forecast

WTI Price Chart
WTI Price Chart

USOIL is currently priced at $81.17, reflecting a modest decline of 0.41%. Positioned just below the pivotal level of $81.90, the commodity faces immediate resistance at $83.29, with further barriers at $84.45 and $86.14, suggesting potential points for upward price movements. Conversely, US Oil finds immediate support at $80.67, with additional safety nets at $79.60 and $78.50, which could stave off further declines.

Technical indicators such as the Relative Strength Index (RSI) and moving averages provide additional insights. The 50-Day Exponential Moving Average (EMA) stands at $82.53, while the 200-Day EMA is at $83.19, both indicating that US Oil is currently trading in a potentially bearish zone below these levels. USOil exhibits a bearish trend below $81.90.

Brent Oil Price Forecast

Brent Price Chart
Brent Price Chart

About the Author

Arslan, a webinar speaker and derivatives analyst, has an MBA in Finance and MPhil in Behavioral Finance. He guides financial analysis, trading, and cryptocurrency forecasting. Expert in trading psychology and sentiment.

Did you find this article useful?

Advertisement