
Advertisement
Advertisement
AUD to USD Forecast: RBA’s Next Move Amid US GDP Release
By:
Key Points:
- On Thursday, April 25, market risk sentiment and overnight economic indicators from the US will influence early AUD/USD trends.
- Australian private sector PMIs, Consumer price inflation figures, and upcoming producer prices could influence the RBA rate path and the AUD/USD.
- Later in the session, US GDP numbers for the first quarter will impact buyer demand for the AUD/USD.

In this article:
Aussie Economic Indicators Signal a More Hawkish RBA Rate Path
Market risk sentiment and US economic indicators from Wednesday will influence the AUD/USD pairing on Thursday, April 25.
Nevertheless, hotter-than-expected Aussie inflation numbers from Wednesday could cushion the downside. The Australian annual inflation rate eased from 4.1% to 3.6% in Q1 2024. Furthermore, consumer prices advanced by 1.0% in Q1 2024 after rising by 0.6% in Q4 2023.
Economists forecast an annual inflation rate of 3.4% and a 0.8% quarter-on-quarter rise in consumer prices.
Aussie private sector PMI numbers for April could also influence the RBA’s outlook on growth and monetary policy. Upward trends in new orders, employment, and input prices could draw the attention of RBA Board members fixated on wage growth and demand-driven inflation.
In May, the RBA might resume rate hike talks after removing the threat of further interest rate hikes in March. The RBA will deliver its next interest rate decision on May 7, with the press conference likely to draw significant interest.
There are no economic indicators from Australia for investors to consider on Thursday, April 25. The Aussie markets are closed for ANZAC Day. However, Australian producer price figures for Q1 2024 will warrant investor attention on Friday, April 26.
Producers lower prices in a lower-demand environment, reducing consumer prices. Economists forecast producer prices to increase 2.6% year-on-year in Q1 2024 after advancing by 4.1% in Q4 2023.
Hotter-than-expected numbers could greenlight RBA rate hike discussions.
US Economic Calendar: US GDP and Jobless Claims
On Thursday, April 25, US GDP numbers for Q1 2024 will garner investor interest. Economists forecast the US economy to expand by 2.5% quarter-on-quarter in the first quarter. The economy grew by 3.4% in Q4 2023. Hotter-than-expected numbers could further reduce investor expectations of a September Fed rate cut.
Despite softer-than-expected Services PMI numbers, economic indicators continue to signal a robust US economy. A higher-for-longer Fed rate path could impact private consumption and cool the US economy. Private consumption contributes over 60% to the US economy.
The CME FedWatch Tool reflected the shift in sentiment toward the Fed rate path. On Wednesday, April 24, the chances of the Fed holding interest rates steady stood at 29.6%. On March 22, 2024, the probability of the Fed standing pat in September stood at 2.6%.
Other stats include pending home sales, trade data, and weekly jobless claims. Barring a spike in US jobless claims, the numbers will likely play second fiddle to the GDP figures.
Short-Term Forecast
Near-term AUD/USD trends will hinge on the US GDP data and Personal Income and Outlays Report (Fri). Higher-than-expected US GDP numbers and sticky inflation could further impact investor bets on a September Fed rate cut. Nevertheless, producer price numbers from Australia will influence the RBA rate path and policy divergence.
AUD/USD Price Action
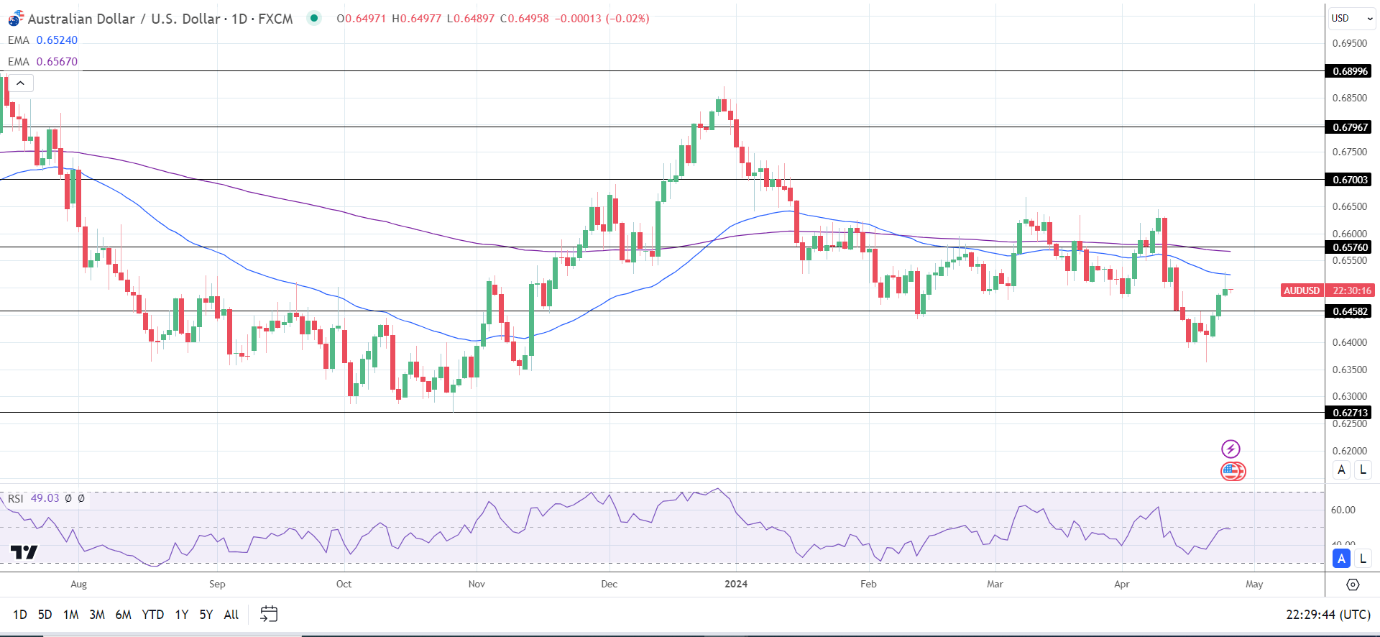
Daily Chart
The AUD/USD remained below the 50-day and 200-day EMAs, affirming the bearish price signals.
An Aussie dollar move through the 50-day EMA would give the bulls a run at the 200-day EMA and the $0.65760 resistance level. A break above the $0.65760 resistance level would bring the $0.66 handle into play.
US GDP and jobless claims figures need consideration.
Conversely, an AUD/USD drop below the $0.64500 handle would bring the $0.64582 support level into play. A fall through the $0.64582 support level could give the bears a run at the $0.62713 support level.
Given a 14-period Daily RSI reading of 49.03, the AUD/USD could drop to the $0.63500 handle before entering oversold territory.
About the Author
Bob Masonauthor
With over 20 years of experience in the finance industry, Bob has been managing regional teams across Europe and Asia and focusing on analytics across both corporate and financial institutions. Currently he is covering developments relating to the financial markets, including currencies, commodities, alternative asset classes, and global equities.
Did you find this article useful?
Latest news and analysis


Advertisement