
Advertisement
Advertisement
Natural Gas Price Forecast: Surges to New Highs, Faces Potential Resistance Zone
By:
Technical analysis highlights potential price reversal for natural gas, with resistance at 2.37 to 2.46 indicating a potential turning point.
In this article:
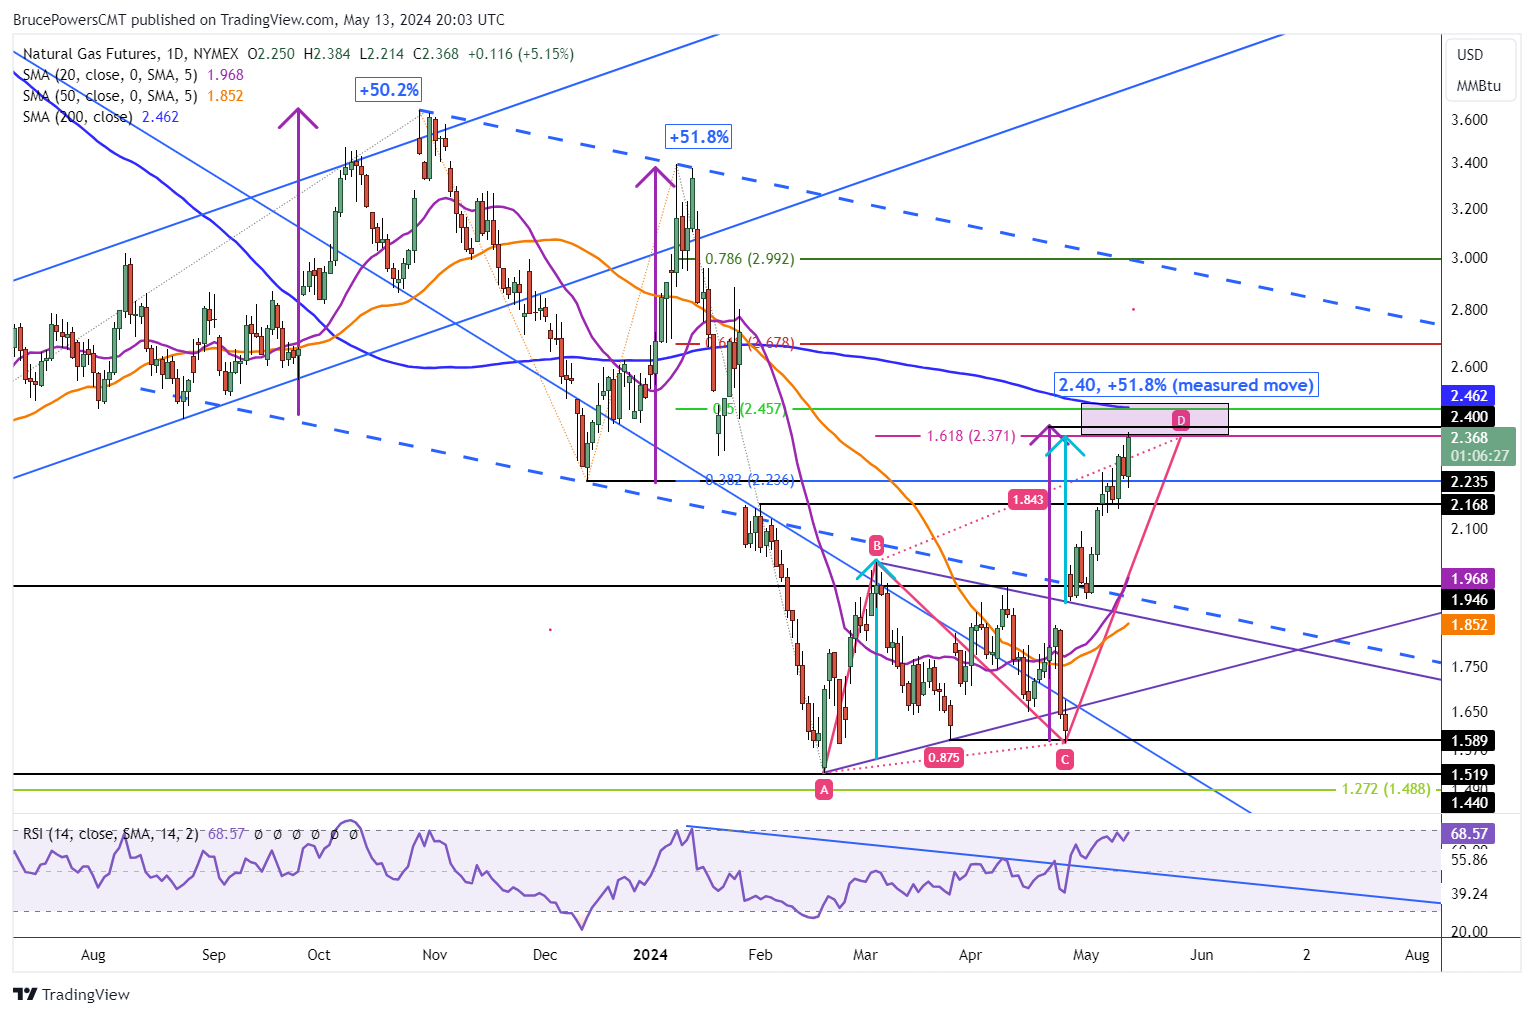
Following a drop below Friday’s low earlier in Monday’s session, natural gas rallied to a new trend high, generating a bullish outside day. In addition, last week’s high was exceeded. If today’s close is above last week’s high of 2.34, another bullish clue will be indicated.
Demand remains strong at the time of this writing as trading continues near the highs of the day, which currently is 2.38. Natural gas has entered the start of a potential resistance zone that begins at 2.37 and ends around the 200-Day MA, now at 2.46. That range is derived from several pieces of analysis.
Weight of Technical Evidence
Like criminal investigations shown on TV, technical analysis also looks at the weight of evidence to assist in identifying what the market might be telling us. Clues are provided in price behavior and price patterns. The approaching resistance zone is a good example of this as there are at least five pieces of analysis pointing to potential resistance in the range of 2.37 to 2.46.
In other words, there is a confluence of potential price targets in that range. Either could turn the market down on their own. But when combined relatively close together they provide a warning sign to pay extra attention to price action as the zone is entered. And for simplicity, not all clues are included in today’s article.
Confluence of Price Targets from 2.37 to 2.46
The specific price levels identified are 2.37, 2.40 and 2.46. Two indicators point to 2.37, the completion of a rising ABCD pattern extended by the 161.8% Fibonacci ratio, sometimes referred to as the golden ratio, and a target from the bottom symmetrical triangle consolidation pattern (light blue arrows).
Next is the 2.40 price target. It is derived from the completion of a measured move that matches the percentage rise in the price of natural gas from the December 13 swing low. The December 13 rally ended with a 51.8% advance in the price of natural gas. Similarly, the current rally from the April 25 swing low, will be up by 51.8% at a price of 2.40.
For a look at all of today’s economic events, check out our economic calendar.
About the Author
Bruce Powersauthor
Bruce boasts over 20 years in financial markets, holding senior roles such as Head of Trading Strategy at Relentless 13 Capital and Corporate Advisor at Chronos Futures. A CMT® charter holder and MBA in Finance, he's a renowned analyst and media figure, appearing on 150+ TV business shows.
Did you find this article useful?
Latest news and analysis


Advertisement