
Advertisement
Advertisement
Gold Price Forecast: Technical Signals Point to Potential Downside
By:
Despite holding support around the 50% retracement level, gold faces more technical bearish signs, with a bear flag pattern indicating potential for lower levels ahead.
In this article:
Although gold reached a new retracement low of 2,277, it continues to find support around the 50% retracement level. It is set to end Friday above the 50% retracement for the third day in a row, which is at 2,289. However, there remains more technical bearish signs than bullish indications currently, as it is in the process of retracing prior gains.
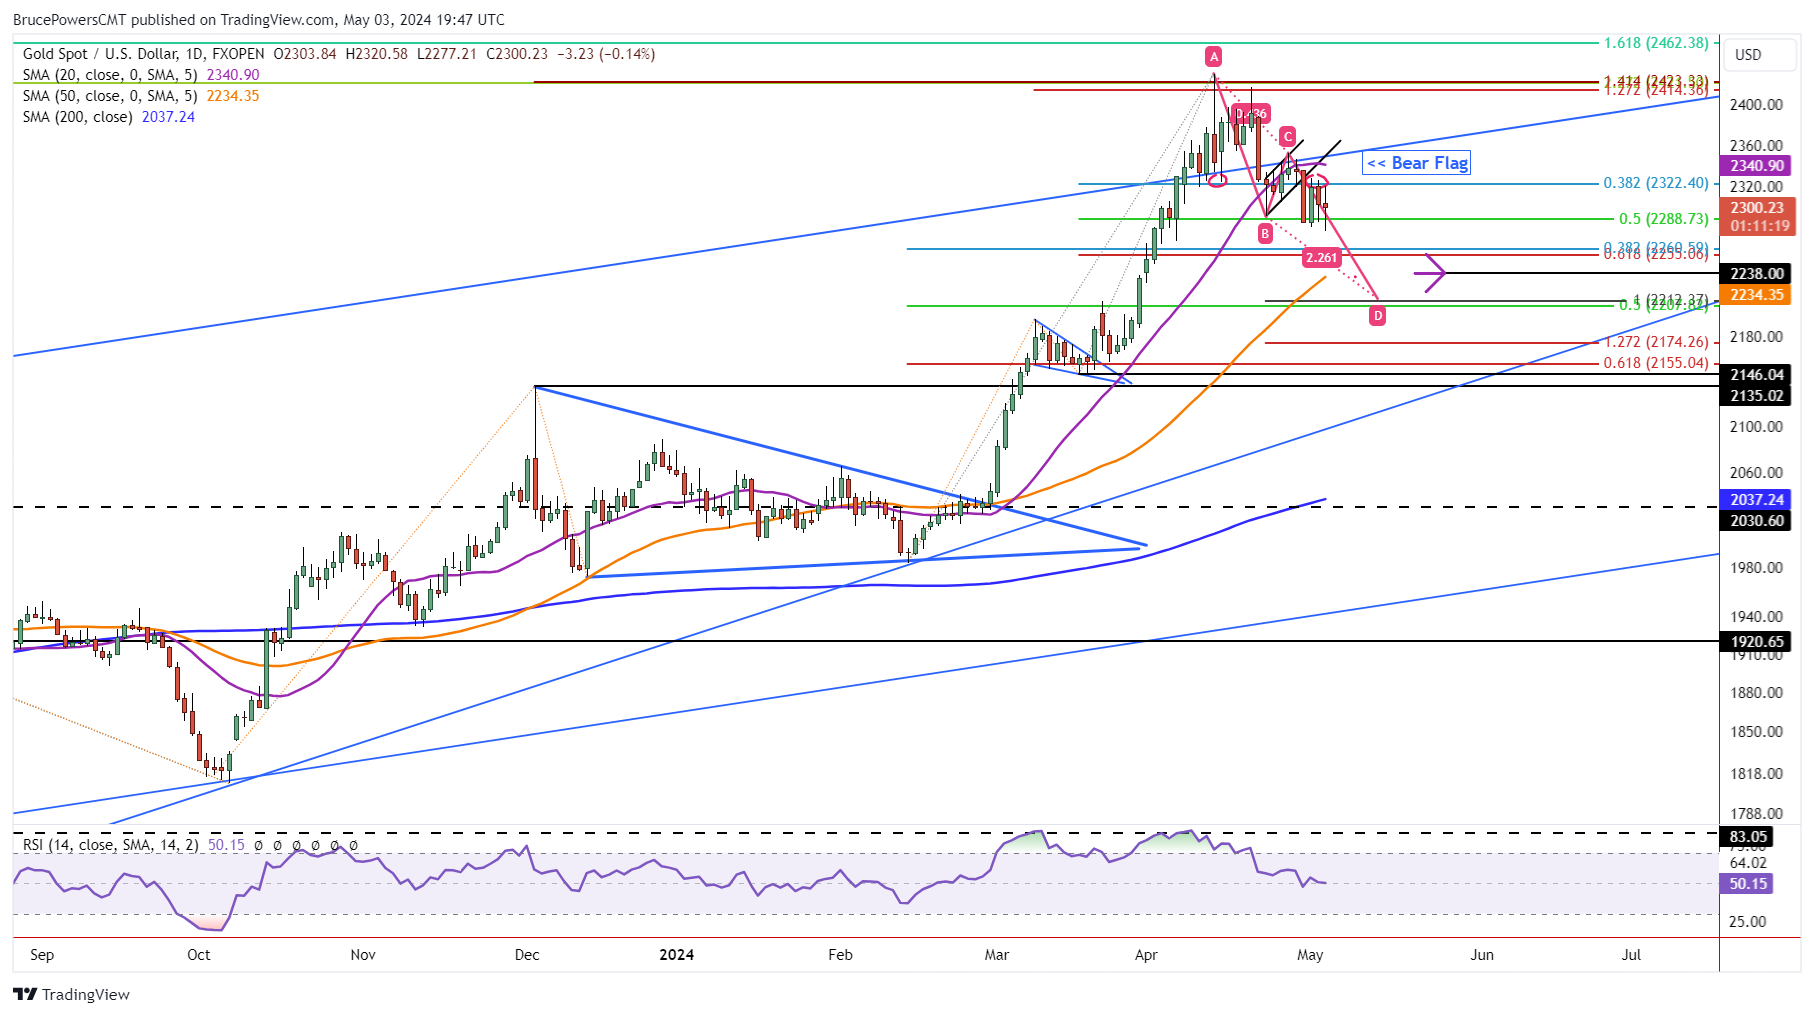
Bear Flag Continuation Potential Remains
A bear flag trend continuation pattern triggered on Tuesday and gold closed weak, near the low of the day and below the prior April 23 (B) swing low. That is a bearish sign indicating that it wants to go lower. However, rather than continue lower following the bearish signal, for the past three days gold has been consolidating around Tuesday’s price range instead. Nonetheless, price patterns are indicating lower support levels will likely be tested before the larger bull trend is ready to resume. An advance above last week’s high of 2,352 (C) would be needed to change that outlook.
Several Lower Targets
The next potential support area below this week’s low is a range of Fibonacci levels from 2,261 to 2,255. But that may be an interim level as the 50-Day MA has not been tested as support since the February 29 symmetrical triangle breakout. Since the 20-Day MA has failed to hold as support, the 50-Day line becomes a target. It is currently at 2,234, and very close to an initial target derived from the bear flag measurements. That pattern indicates a potential target of 2,238. Be aware that April saw support at a low of 2,228.
Support From April at 2,228
If the next lower price zone is to be reached this month, a bearish month signal will have triggered. If that happens, sellers could get more aggressive and drive prices lower. Below the 50-Day line there is the completion of a falling ABCD pattern at 2,212 and a 50% retracement level at 2,208. That would be the price area to watch for support if the 50-Day line is broken followed by April’s low.
For a look at all of today’s economic events, check out our economic calendar.
About the Author
Bruce Powersauthor
Bruce boasts over 20 years in financial markets, holding senior roles such as Head of Trading Strategy at Relentless 13 Capital and Corporate Advisor at Chronos Futures. A CMT® charter holder and MBA in Finance, he's a renowned analyst and media figure, appearing on 150+ TV business shows.
Did you find this article useful?
Latest news and analysis


Advertisement