Advertisement
Advertisement
Trading Patterns
Updated: Mar 5, 2019, 14:40 GMT+00:00
Intro
Support and resistance levels along with trend lines form the basis of trading patterns which have been used throughout history to predict future market
Support and resistance levels along with trend lines form the basis of trading patterns which have been used throughout history to predict future market movements in forex trading. The concept is based on the theory that history, along with human psychology, repeats itself, and that a specific grouping of market movements will foreshadow a market direction.
Patterns are generally categorized into continuation patterns and reversal patterns. Continuation patterns express a pause within market sentiment which eventually refreshes. A reversal patterns reflects market consolidation prior to a reversal of sentiment and market price action. There are a number of interesting reversal and continuation patterns. Two of the most popularly used are the head and shoulder pattern, and the flag pattern.
Head and Shoulder
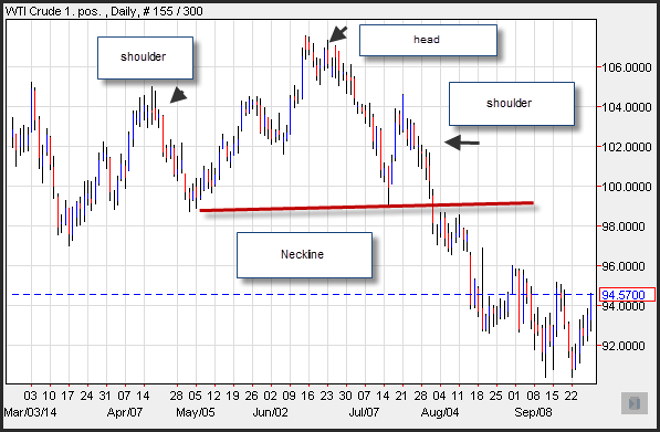
The head and shoulders pattern as mentioned early is a reversal pattern and it is most often seen at the end of an uptrend. The reverse head and shoulder pattern usually signifies the end of a downturn. The beginning of the reversal of an uptrend will likely coincide with market consolidation.
The left shoulder of the pattern coincides with the largest market volume seen within the pattern. Forces of supply in the form of selling generate resistance creating an intermediate top. The intermediate top is met with market enthusiasm, which pushes prices to a new high, which is again met will selling. The first intermediate high is considered the left shoulder, while the new high is looked at as the head of the pattern.
Volume that coincides with the head is generally less than volume experienced during the left shoulder. After moving lower and hitting support, which forms the neckline, buyers return and ultimately push through to a new intermediate higher which fails to break resistance created by the head. The right shoulder, generally experiences the least market volume associated with the head and shoulder pattern. The failure to breach the upside creates downward pressure testing the neckline. Support of the market is a trend line that creates the neck line. The head and shoulder pattern is complete when the market breaks the neckline. Volume generally increases dramatically when the neckline is broken.
In addition to the head and shoulder pattern, another reversal pattern that is similar is the reverse head and shoulder pattern. This pattern usually occurs as the end of a market selloff and is a catalyst that generates an upward reversal.
Flags
Flags are continuation patterns that signal a consolidation prior to a resumption of the current trend. Flags are generally observed after large market advances, and the pole of the flag is generally a break out. The market then usually takes off again in the same direction as the prior large move. Bullish flags are characterized by lower tops and lower bottoms, with the pattern slanting against the trend. A bear flag is also a continuation pattern in which the market consolidates after a quick downdraft. The market consolidates in the opposite direction of the downward move, creating a flag pattern.
This article was written by easy forex. For more articles please visit their website.
About the Author
Advertisement
