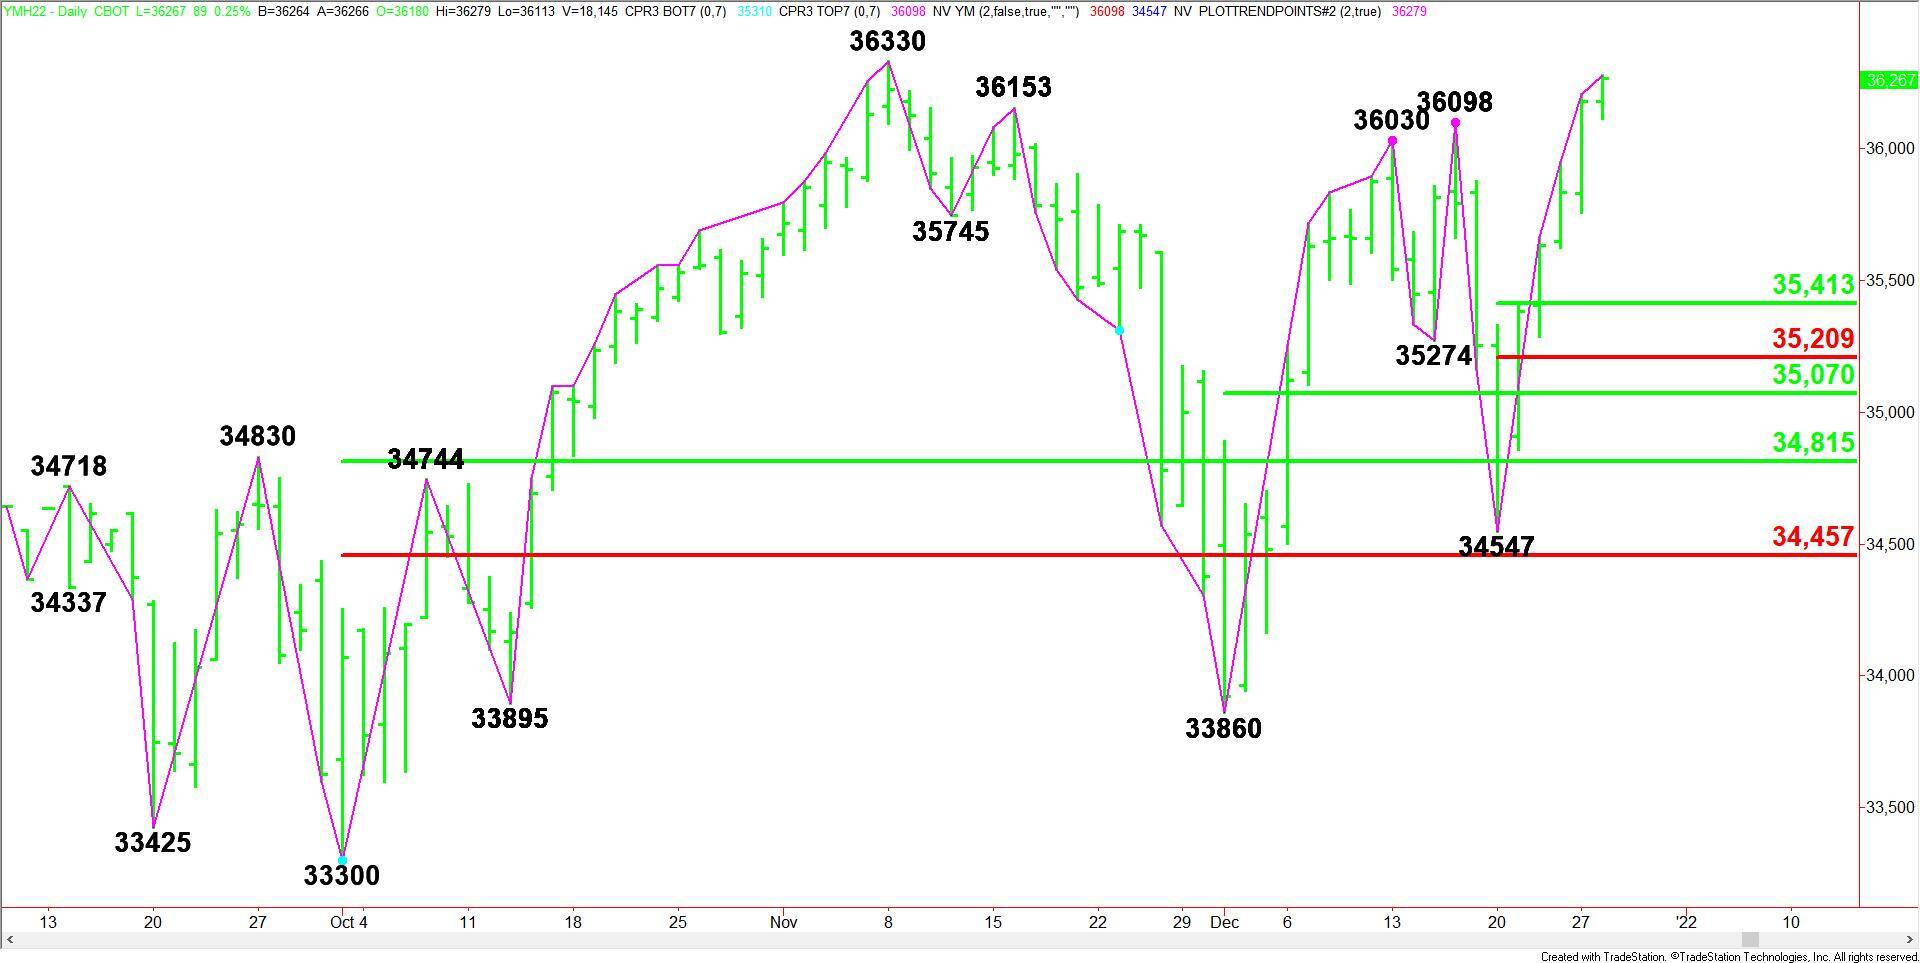
E-mini Dow Jones Industrial Average (YM) Futures Technical Analysis – Driving Toward Record High at 36330
The direction of the March E-mini Dow Jones Industrial Average on Tuesday is likely to be determined by trader reaction to 36178.March E-mini Dow Jones Industrial Average futures are inching higher early Tuesday as investors continue to assess the spread of the Omicron COVID-19 variant. On Monday, buyers drove the blue chip average to within striking distance of its record high as markets reopened after the Christmas holiday.
At 10:02 GMT, March E-mini Dow Jones Industrial Average futures are trading 36273, up 95 or +0.26%.
Some said Monday’s strength was fueled by strong holiday retail sales. According to Mastercard data, holiday sales rose 8.5% in 2021 from last year, the fastest pace in 17 years. The price action also suggested investors shrugged off worries over air travel after a holiday weekend that saw thousands of flights canceled due to COVID-related issues.
The Dow was led higher by shares of Microsoft Corp, Apple Inc and Salesforce.Com, which gained 2.32%, 2.30% and 2.04%, respectively.

Daily Swing Chart Technical Analysis
The main trend is up according to the daily swing chart. The trend turned up on Monday when buyers took out the last main top at 36098. A trade through 34547 will change the main trend to down.
The new short-term range is 34547 to 36279. Its retracement zone at 35413 to 35209 is the nearest support area.
Daily Swing Chart Technical Forecast
The direction of the March E-mini Dow Jones Industrial Average on Tuesday is likely to be determined by trader reaction to 36178.
Bullish Scenario
A sustained move over 36178 will indicate the presence of buyers. A trade through the intraday high at 36279 will indicate the buying is getting stronger. If this move creates enough upside momentum then look for a possible surge into the all-time high at 36330.
Bearish Scenario
A sustained move under 36178 will signal the presence of sellers. Crossing to the weak side of the former main tops at 36153 and 36098 will indicate the selling pressure is getting stronger. If this move creates enough downside momentum then look for the selling to possibly extend into the short-term retracement zone at 35413 – 35209.
A close below 36178 will form a potentially bearish closing price reversal top. If confirmed, this could trigger the start of a 2 to 3 day correction. But the uptrend is likely to remain intact.
