Gold, Silver, and US Dollar Technical Analysis: Gold Gains as Trade War Pressures US Dollar
Gold and silver present a bullish price structure, while the US Dollar Index breaks below 107.")
Gold (XAU) prices remain strong despite some profit-taking at record highs. A weaker US Dollar, declining Treasury yields, and trade war concerns continue to support gold’s bullish momentum. Safe-haven demand remains high as investors seek protection against uncertainty. The World Gold Council’s report on increased central bank gold purchases further reinforces the metal’s upward trend. With Trump’s new tariff threats, gold may see further inflows as markets brace for potential economic disruptions.
The US Dollar Index struggles as traders react to the Federal Reserve’s cautious stance. Fed officials hint at rate cuts, signaling a shift in monetary policy that weakens the US dollar. Softer US job data and falling real yields add to bearish sentiment. Meanwhile, rising inflation risks and geopolitical concerns keep the Fed on edge. The market expects the Fed to ease rates by 41.5 basis points in 2025, adding further downward pressure on the US dollar.
The negative bias in the US Dollar further supports the bullish momentum in gold and silver (XAG). The market awaits US economic data releases, including Flash Manufacturing and Services PMIs. Any signs of economic slowdown or rising inflation could accelerate gold’s gains while deepening the dollar’s losses. If uncertainty persists, gold will likely remain a preferred safe-haven asset.
Gold (XAU) Technical Analysis
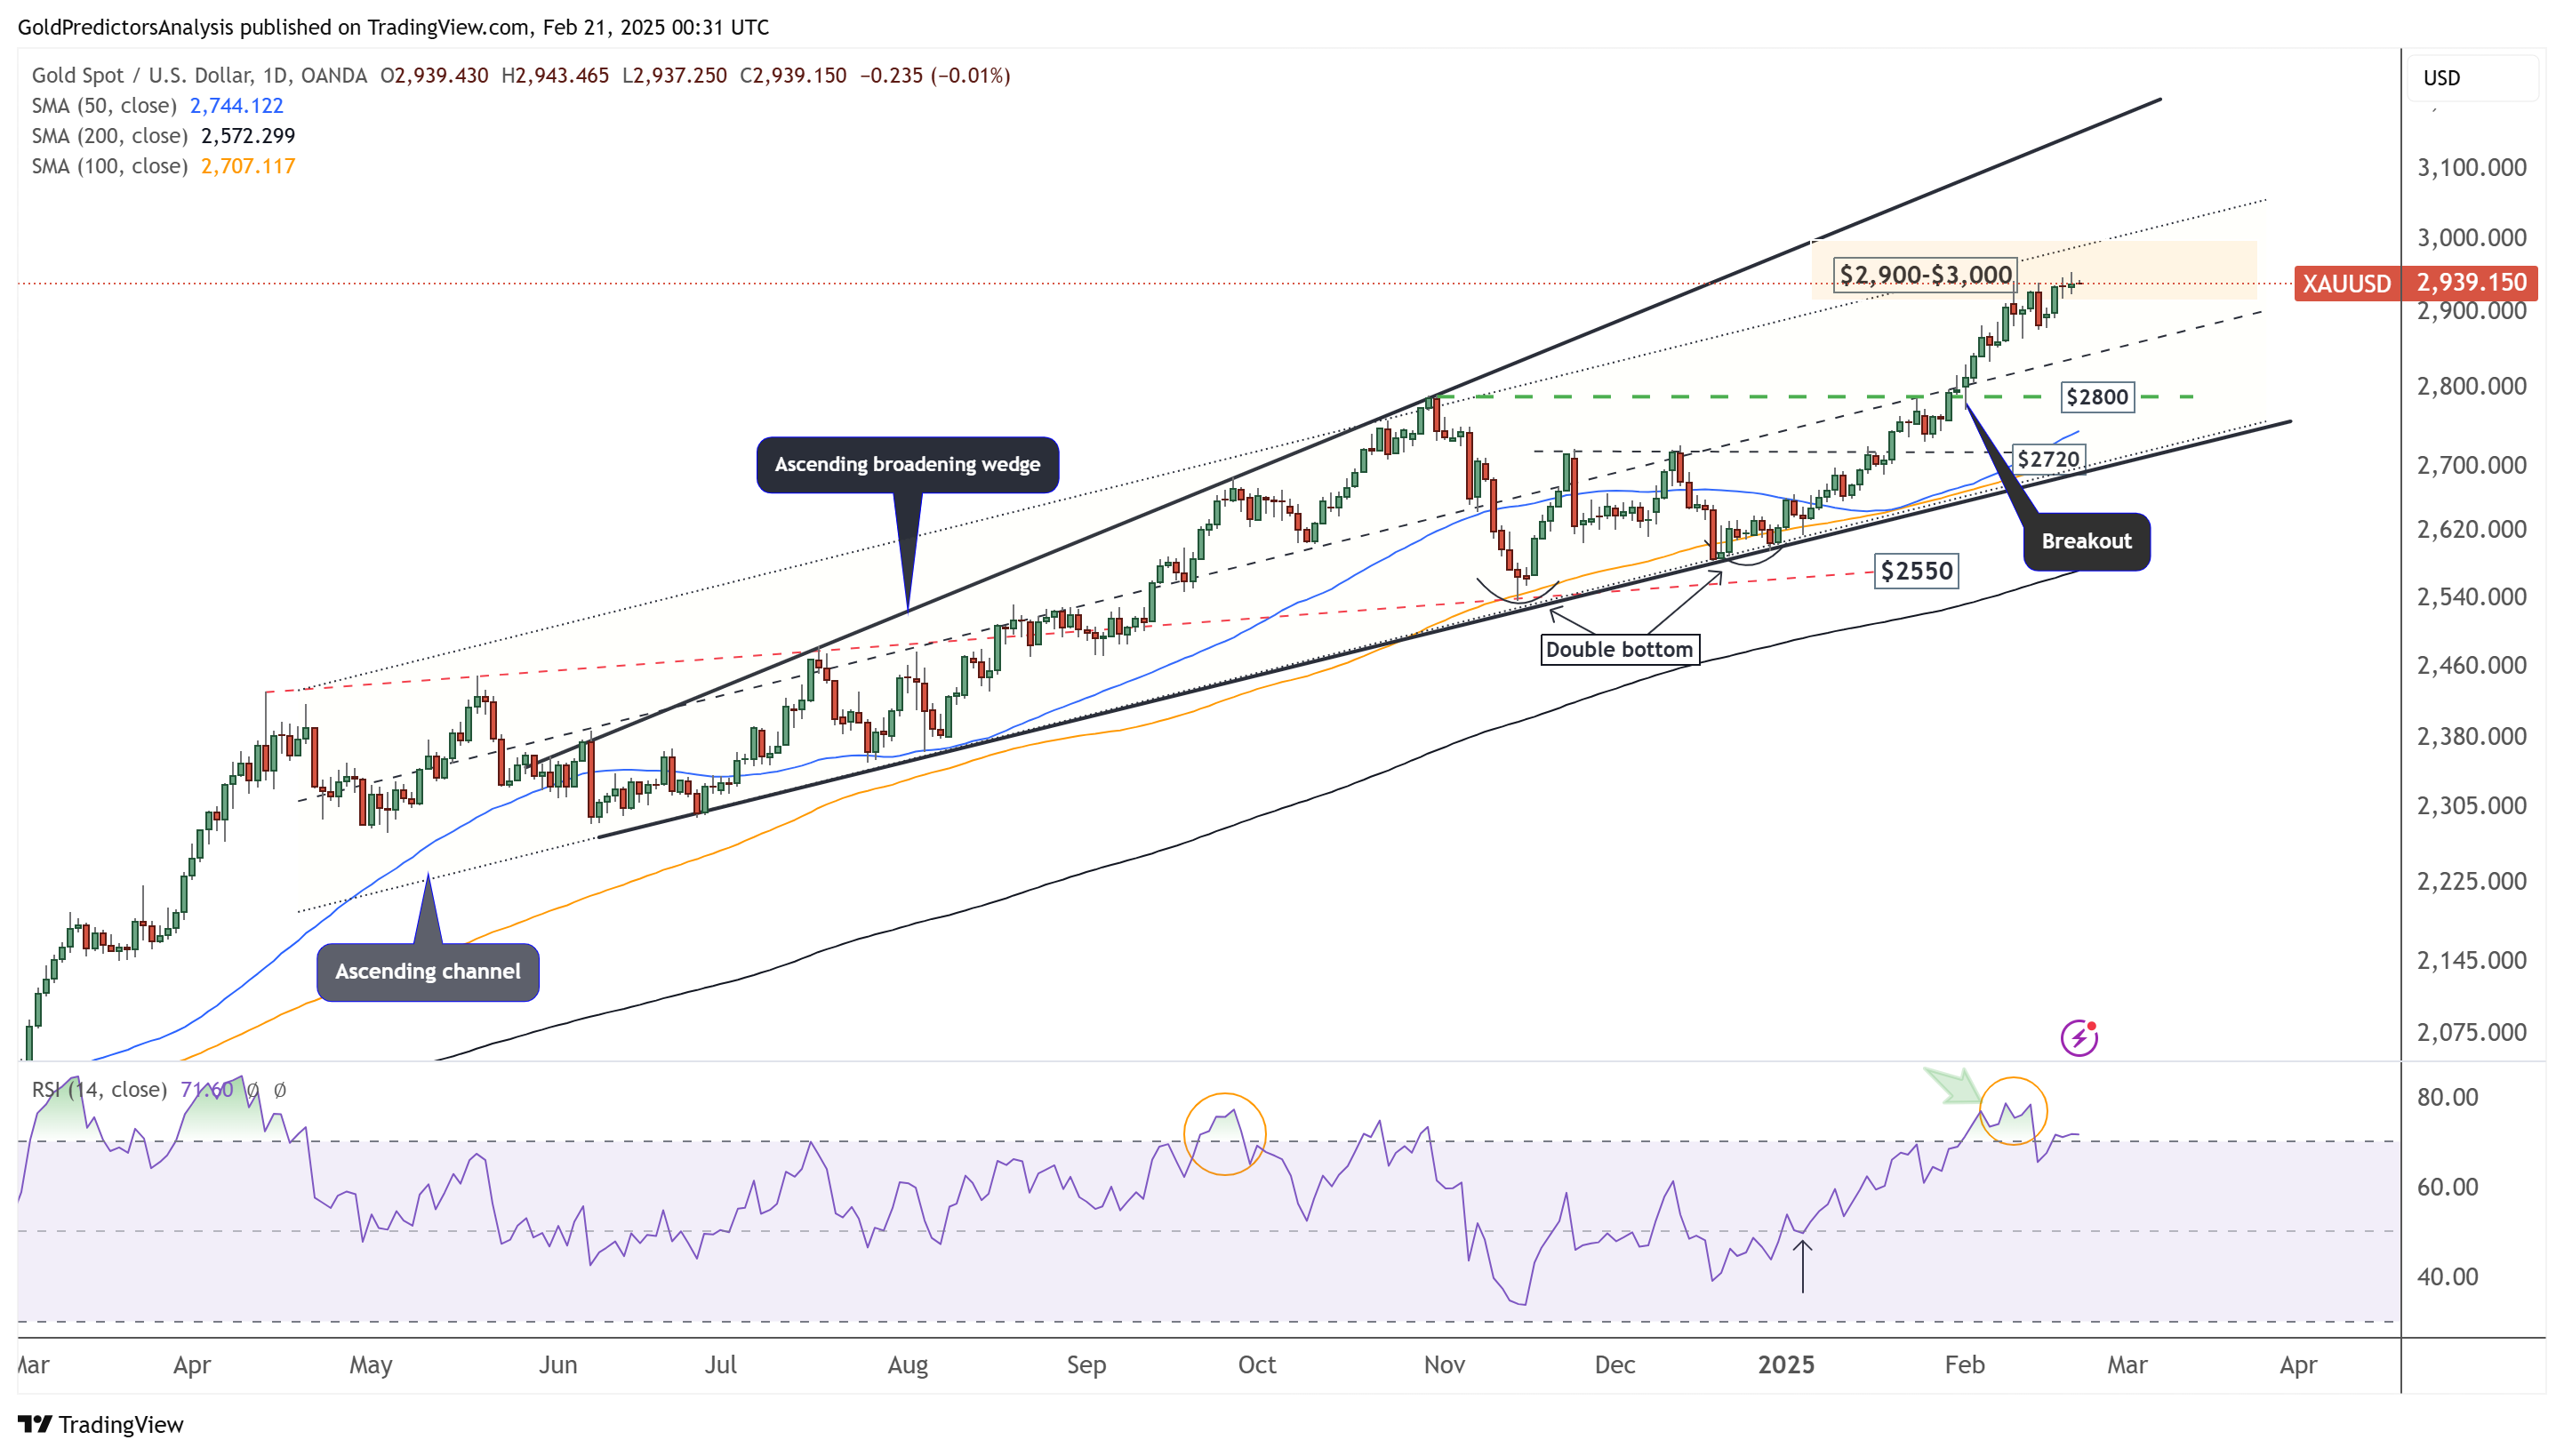
Gold Daily Chart – Strong Momentum
The daily chart for gold shows that the price has reached the target zone of $2,900 to $3,000, but it does not show any signs of correction. The short-term price action still indicates that the price may continue higher. However, the RSI is extremely overbought, and any pullback from this level may lead to a significant price correction. This resistance is measured from the resistance line of the ascending channel, where a break above $3,000 could lead to another advance toward the black trendline.
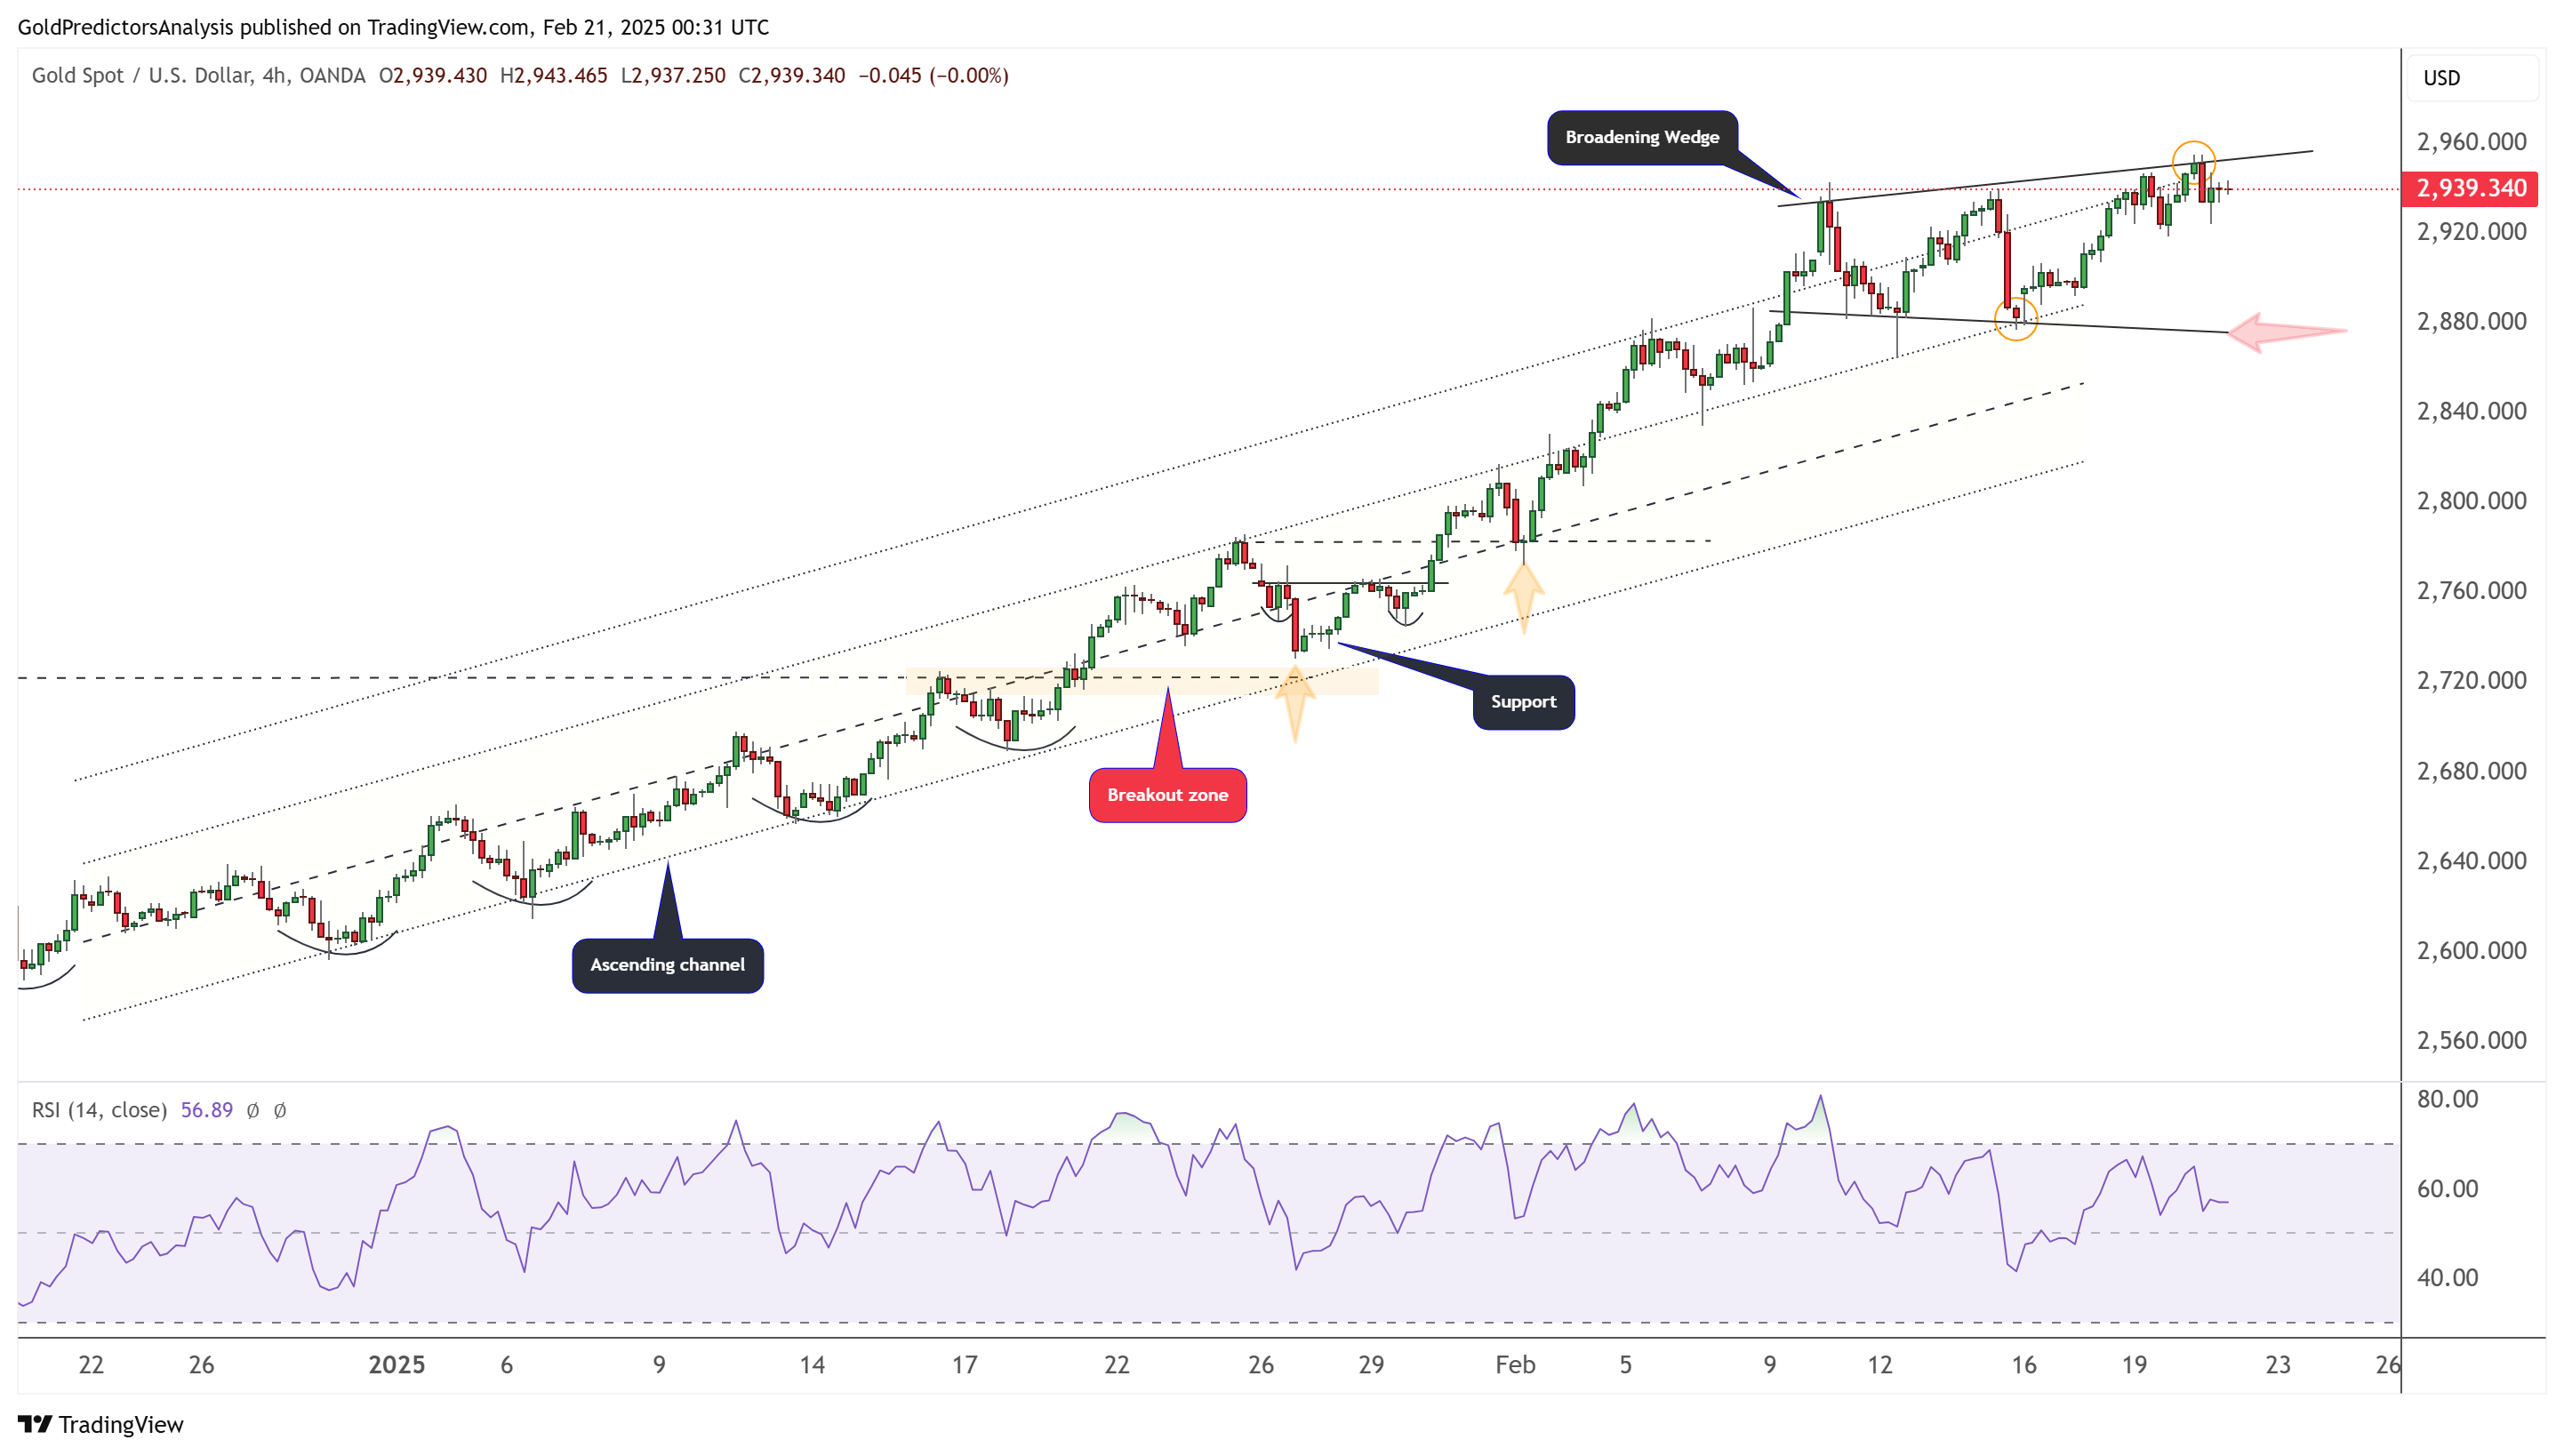
Gold 4-Hour Chart – Broadening Wedge
The 4-hour chart for gold shows that the price has hit the resistance of a broadening wedge pattern, where a break above $2,960 could push gold to higher levels. The emergence of a broadening wedge at a record level indicates strong volatility. This volatility may lead to significant moves in either direction.
Silver (XAG) Technical Analysis
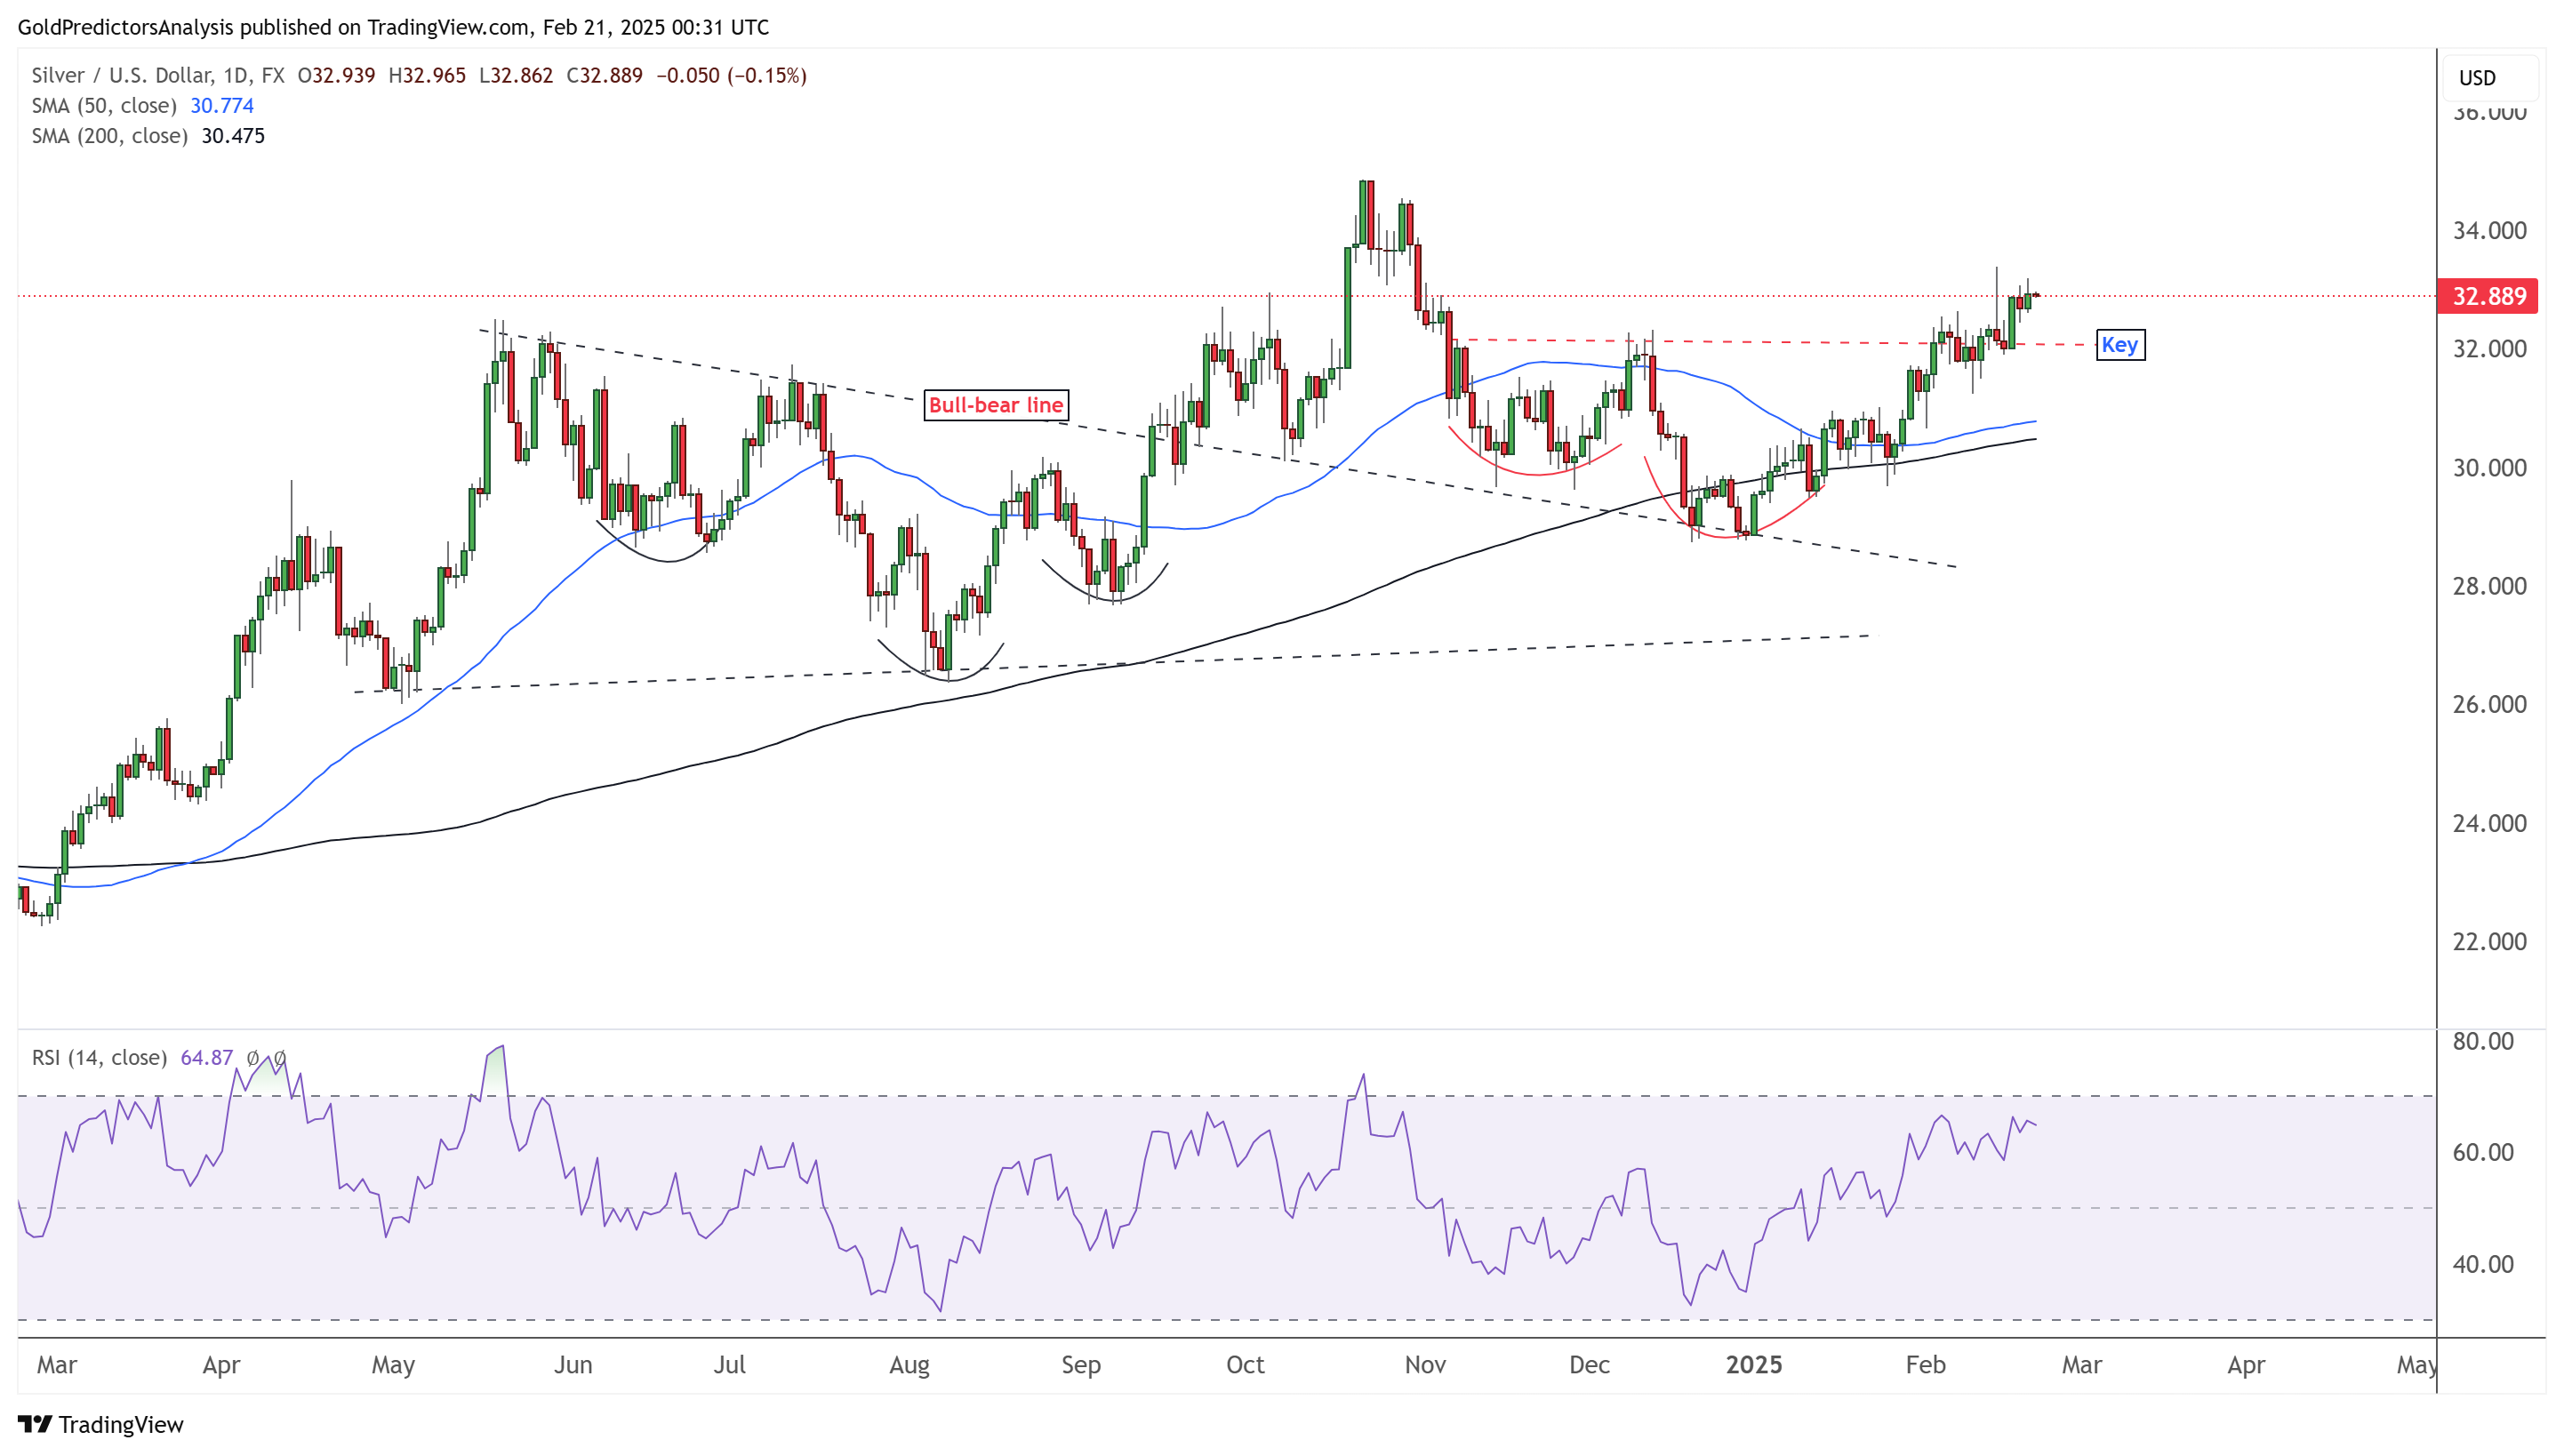
Silver Daily Chart – Bullish Market Development
The daily chart for silver shows that the price remains strongly bullish and has formed a bullish pattern, such as an inverted head and shoulders above the bull-bear line. A break above $32.50 has opened the door for higher levels, with the immediate target at $35.
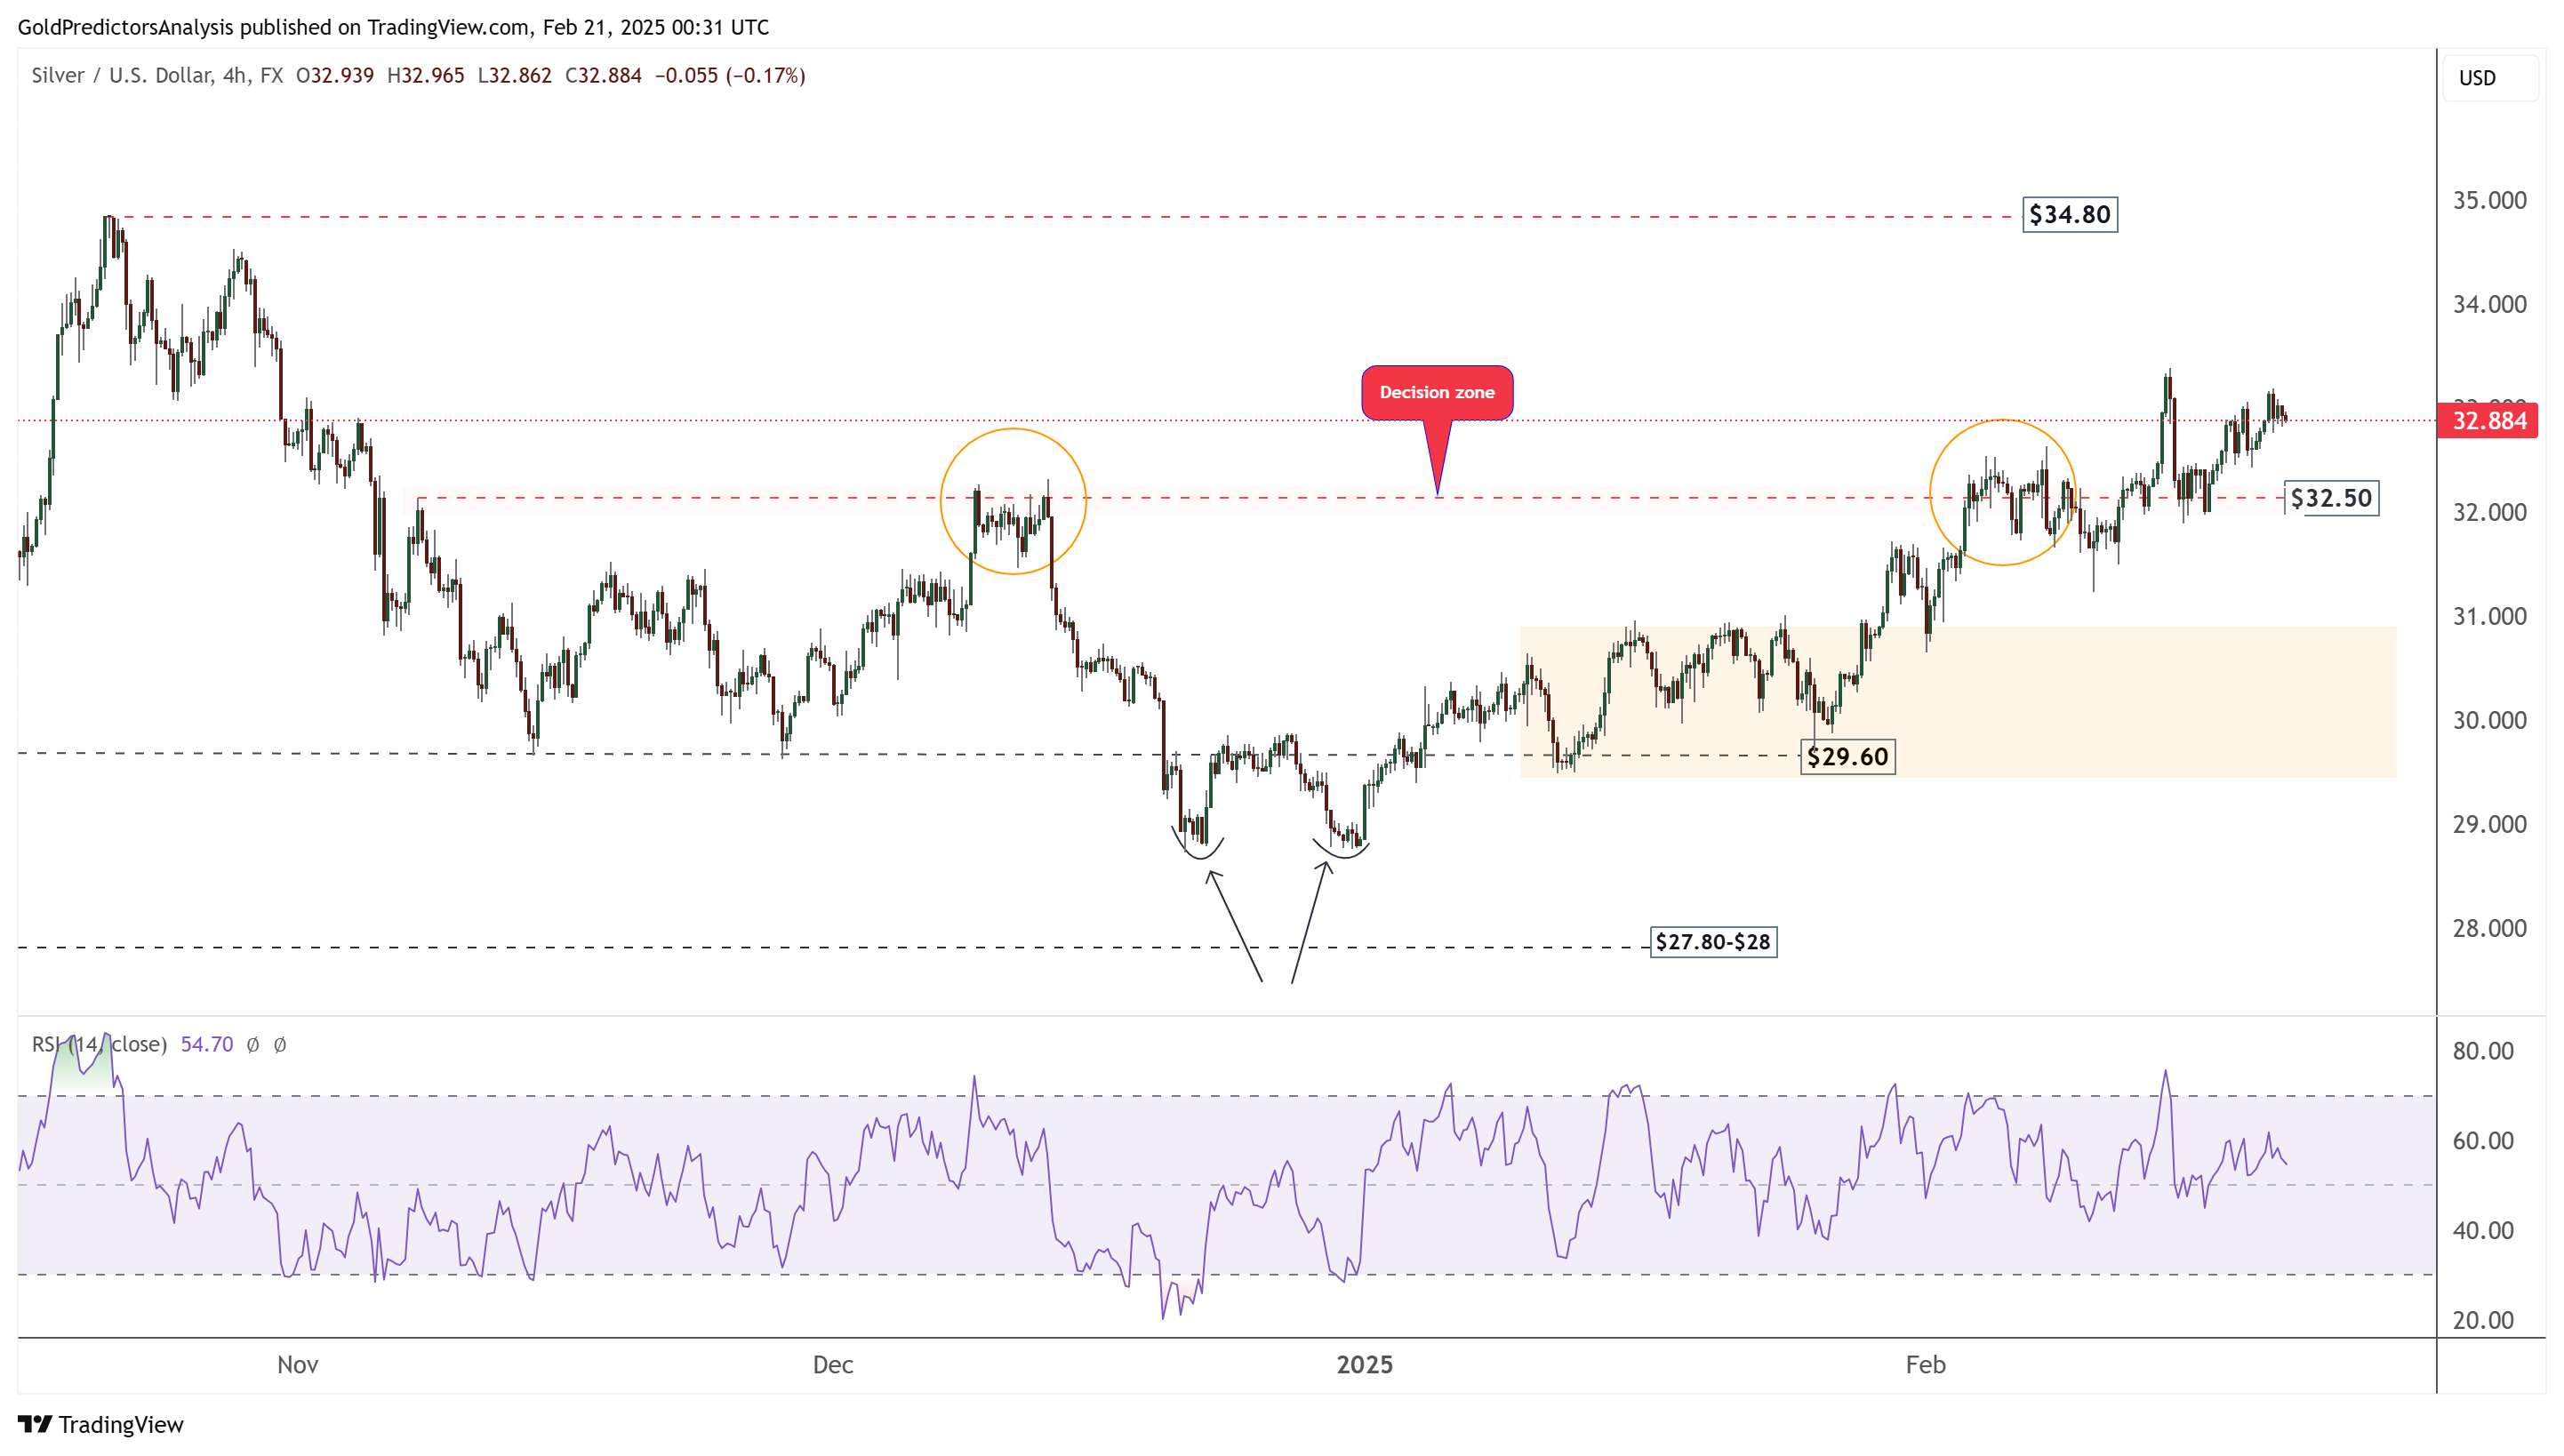
Silver 4-hour Chart – Bullish Price Action
The 4-hour chart also shows a strong bullish trend, with the price breaking above the $32.50 level. This breakout suggests a move toward the $34.80 to $35 region. The short-term price action remains strongly bullish.
US Dollar Index (DXY) Technical Analysis
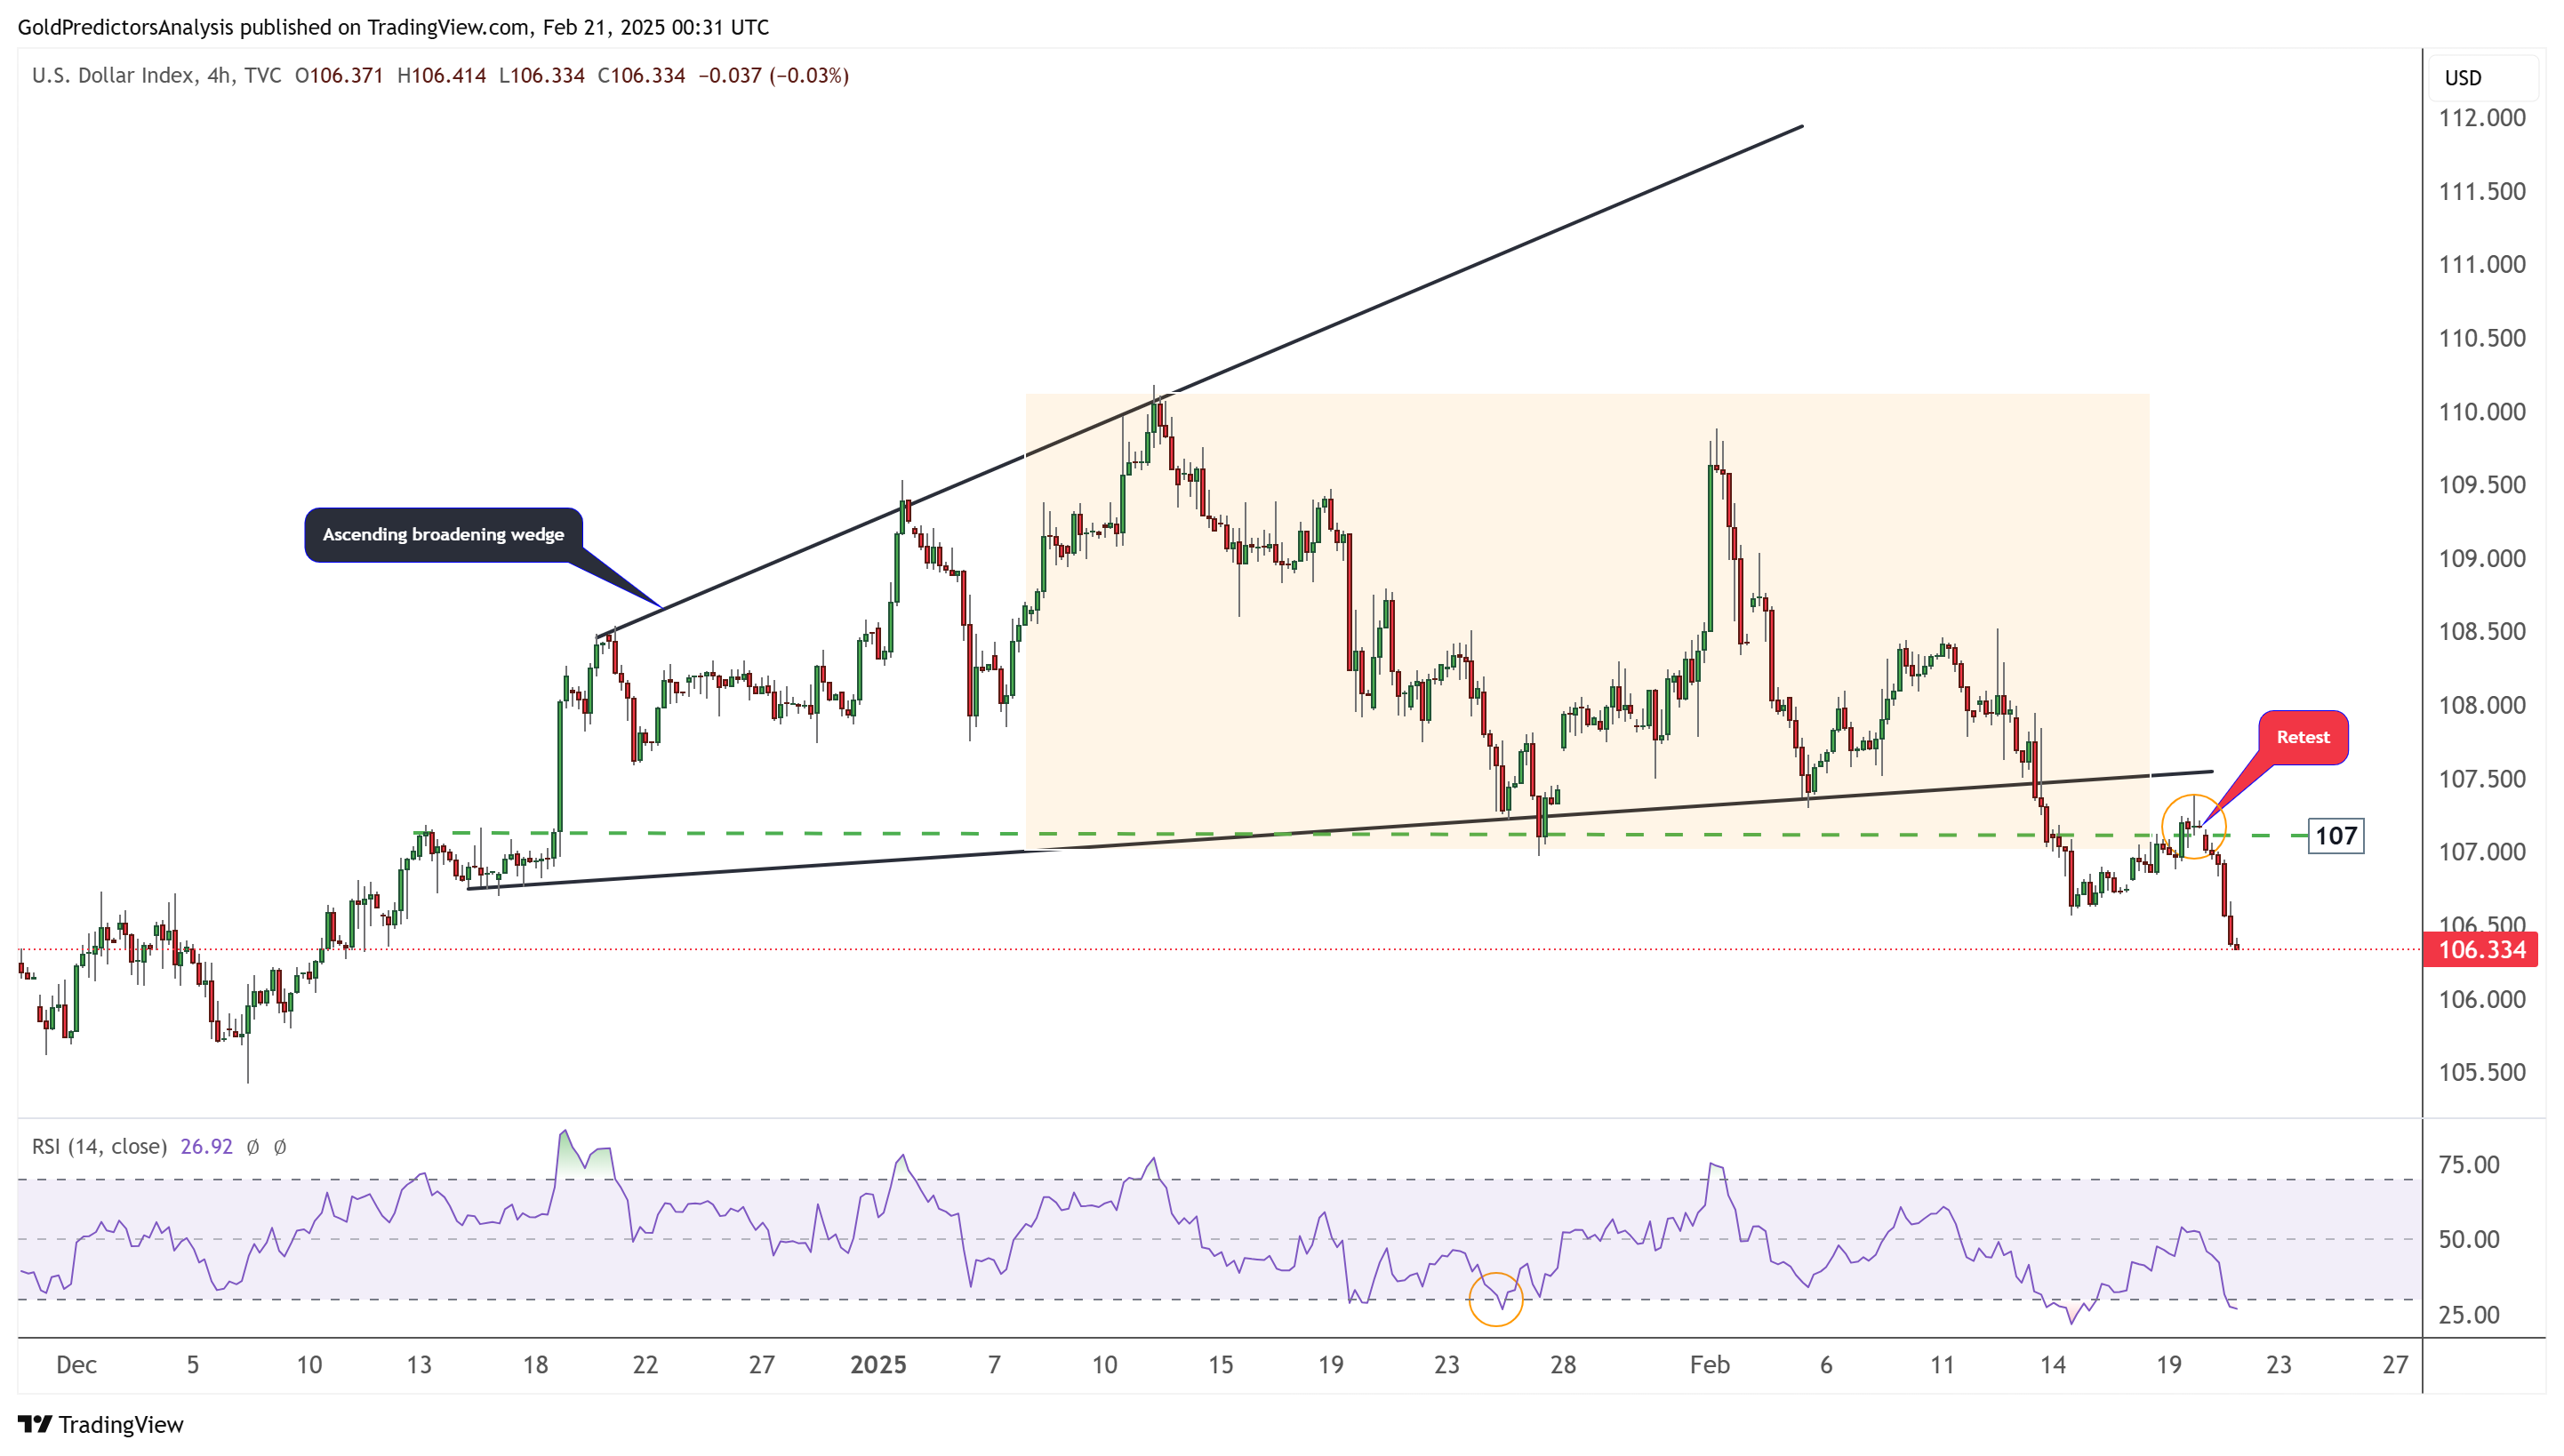
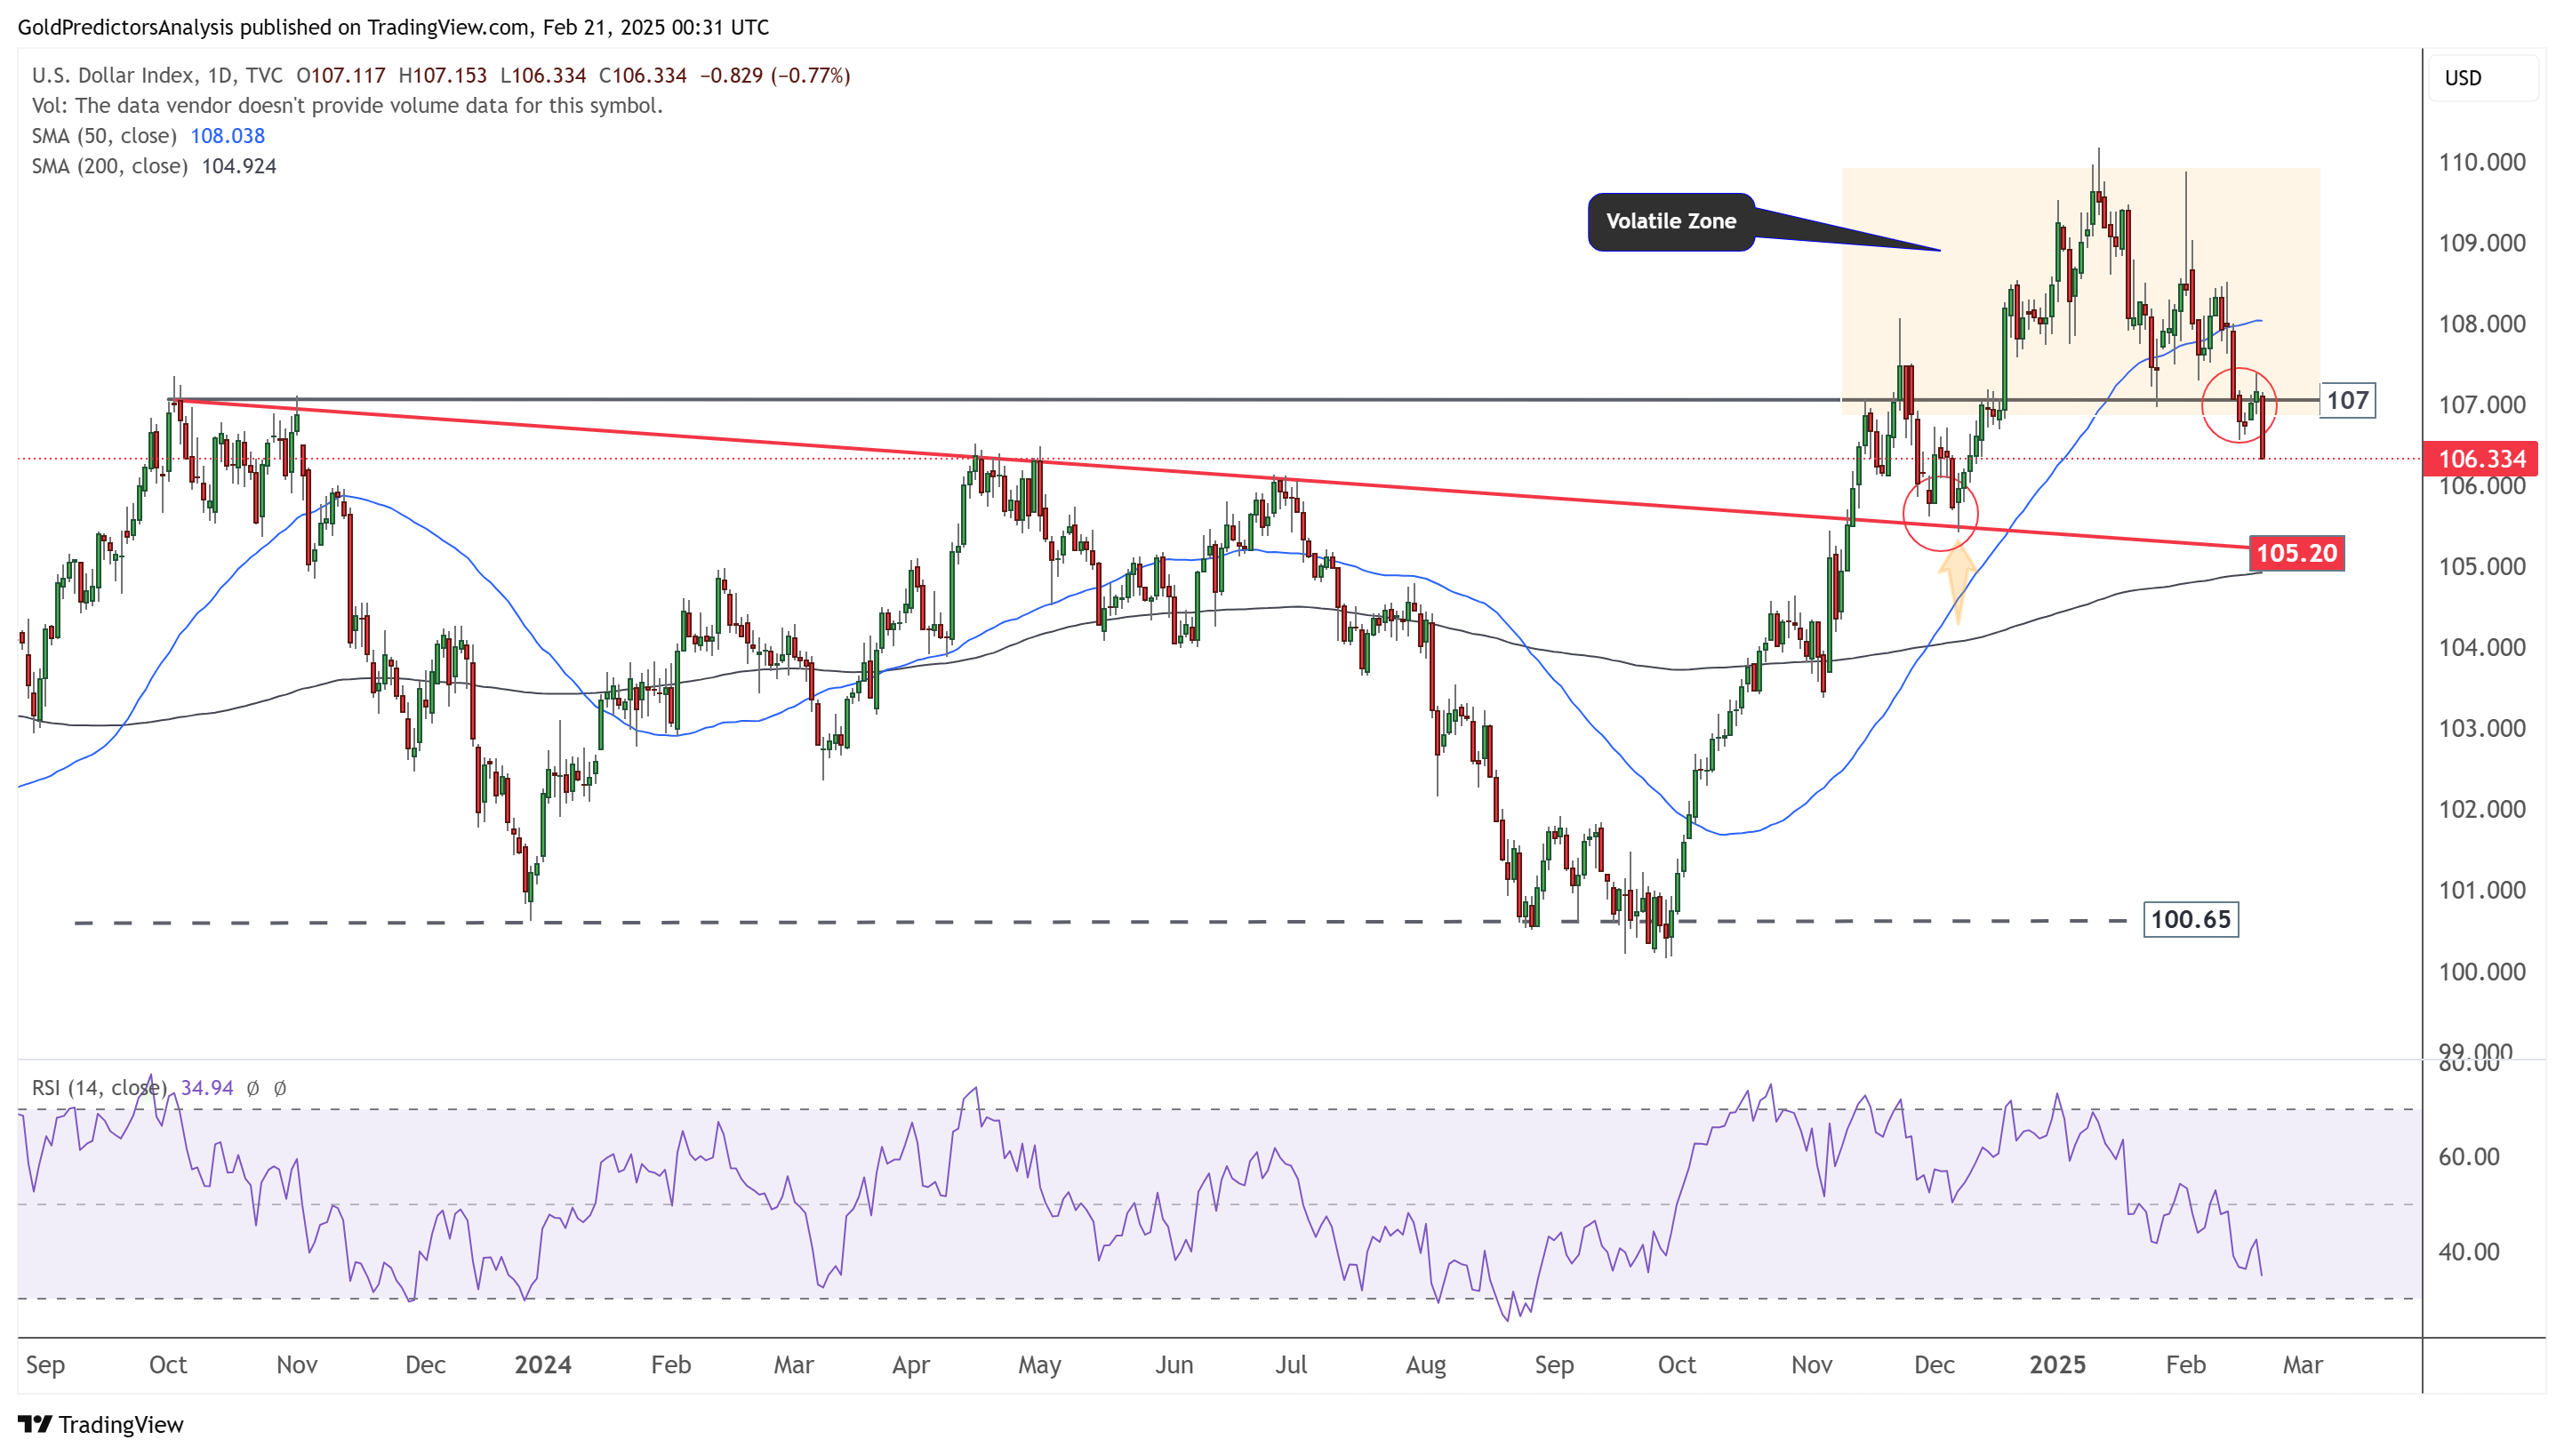
US Dollar Daily Chart – Break Below 107
The daily chart for the US Dollar Index shows strong bearish pressure. The rebound to the 107 level has continued the bearish trend. The index is moving toward the 105.20 level, which aligns with the 200-day SMA. A break below this level will negate the bullish outlook.
US Dollar 4-Hour Chart – Bearish Pressure
The 4-hour chart for the US Dollar Index shows that the rebound has found resistance at the breakout region 107. After hitting this resistance, the index has continued its downtrend. The break below 107, followed by a retest and subsequent drop, suggests that the US Dollar Index will likely continue to lower.