
S&P 500 (SPX), Dow Jones (DJI), Nasdaq Composite (IXIC) Daily Technical Outlook: US 30 Faces Slides – Bond Yields, Earnings to Blame?
Earnings season looms, casting shadows on the Dow Jones Industrial Average amidst surging bond yields and tech anticipation.
Key Insights
- U.S. stock futures face turbulence due to soaring bond yields, tech earnings anticipation.
- Cadence Design projects a $1 billion revenue with an EPS of 1.2.
- S&P 500: Trading at 4224.15, down 1.26% within 24 hours; pivotal level at $4276.
- NASDAQ’s current status: down 0.74% at 12983.81; bearish under the $13426 threshold.
- Dow Jones: a sobering 0.53% drop to 32906.25; bearish short-term view below $33238.
Quick Fundamental Outlook
The U.S. stock futures faced headwinds on Monday, pressured by surging bond yields and anticipation surrounding upcoming tech earnings. On Monday, October 23, 2023, several companies are poised to announce their earnings.
Cadence Design (CDNS) is forecasted to post an EPS of 1.2, with expected revenue touching the $1 billion mark and a market capitalization of $64.86 billion. Meanwhile, Brown & Brown (BRO) has a forecasted EPS of 0.6187 and is anticipated to report revenue of $1.03 billion, boasting a market cap of $19.05 billion.
NVR (NVR) is eyed for an impressive EPS of 115.61, with revenue predictions at $2.59 billion and a market cap of $17.91 billion. Alexandria RE (ARE) is projected to have an EPS of 1.14, with revenue approximating $720.81 million and a market valuation of $16.45 billion.
WR Berkley (WRB) is expected to announce an EPS of 1.19, with its revenue nearing $2.66 billion and a market cap of $16.3 billion. Lastly, Packaging America (PKG) has its EPS forecast set at 1.92, with projected revenue of $1.99 billion and a market cap of $12.89 billion.
S&P 500
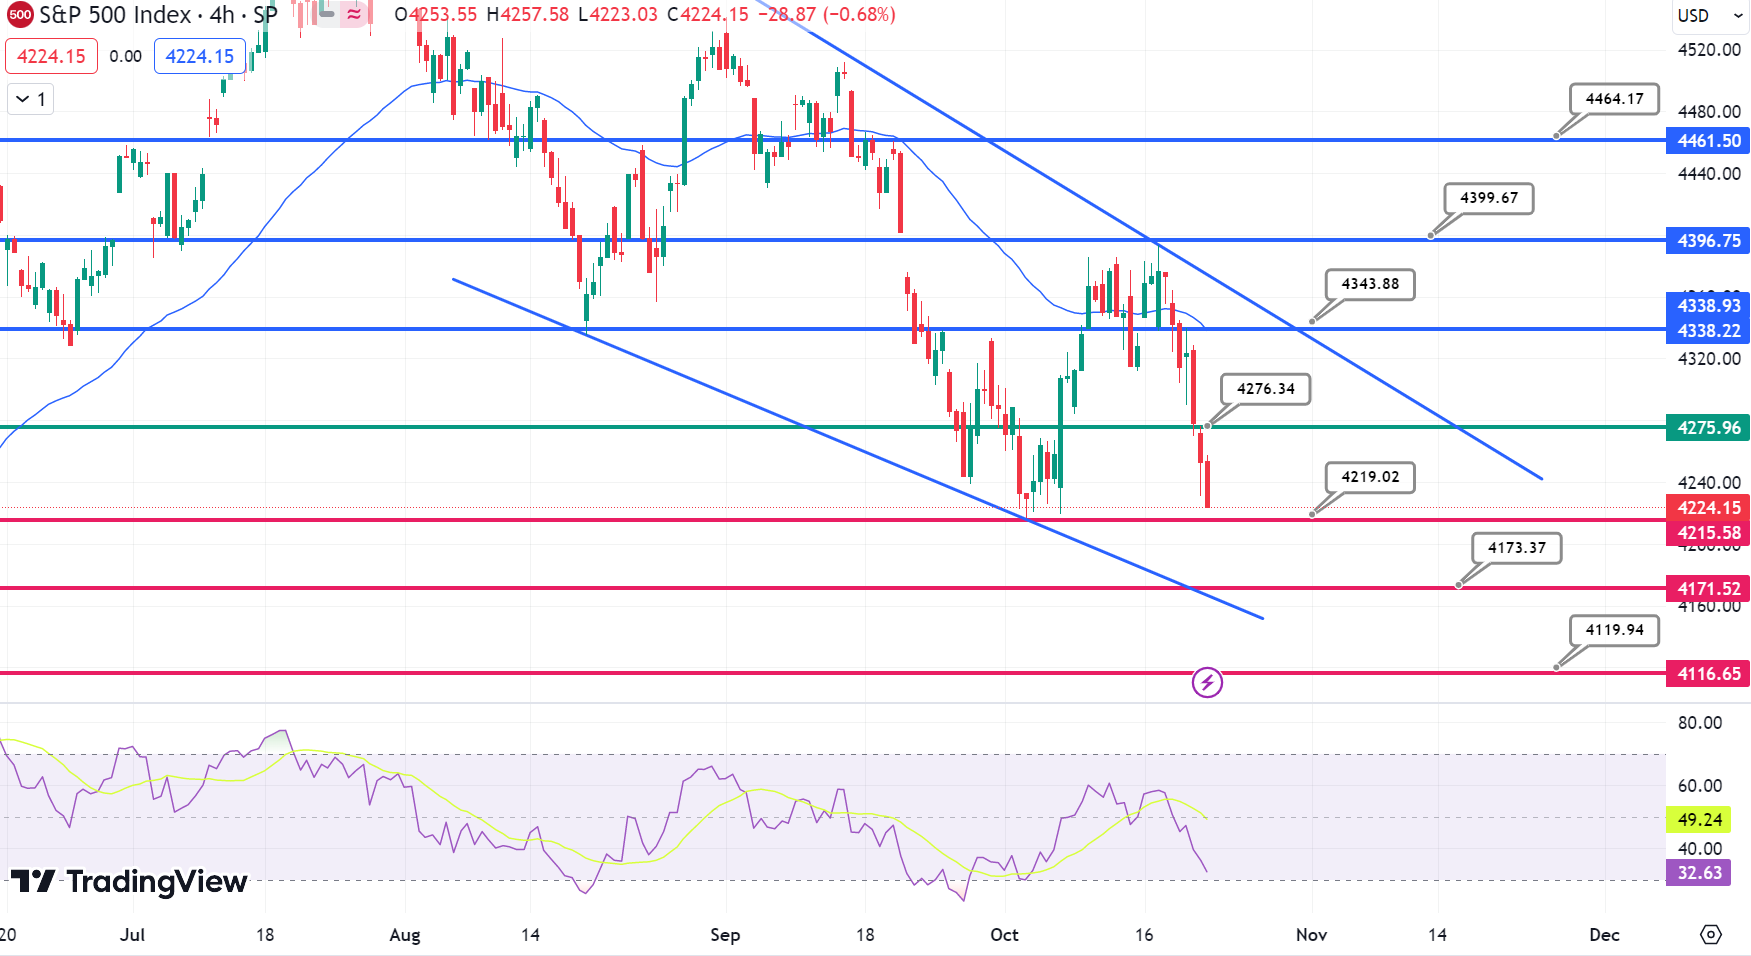
The S&P 500 (SPX) paints a somewhat grim picture this week. Trading at 4224.15, the index has slid down 1.26% within the past 24 hours. Based on a 4-hour (4H) timeframe, analysis shows the pivot point at $4276, with resistances at $4344, $4400, and $4464.
Meanwhile, the SPX sees immediate support at $4219, followed closely by $4173 and $4120. A look at the technical indicators further elucidates the bearish sentiments. The Relative Strength Index (RSI) is recorded at 32, hinting that we’re approaching oversold conditions. The Moving Average Convergence Divergence (MACD) line, at -12.87, is slightly above its signal counterpart, which stands at -13.89.
Price action remains below the 50-day Exponential Moving Average (EMA), currently at 4338, signalling a short-term bearish trend. Additionally, the downward trendline alongside the 50 EMA suggests a prevailing selling trend. Bearish momentum seems evident, with the triple bottom support hovering near $4220 and the appearance of three black crows on the 4-hour chart.
While the short-term outlook appears bearish below $4276, a pivot above this level might offer some respite to the bulls. As the week unfolds, market watchers could expect the S&P 500 to challenge the immediate resistance levels, contingent upon broader market sentiments.
NASDAQ
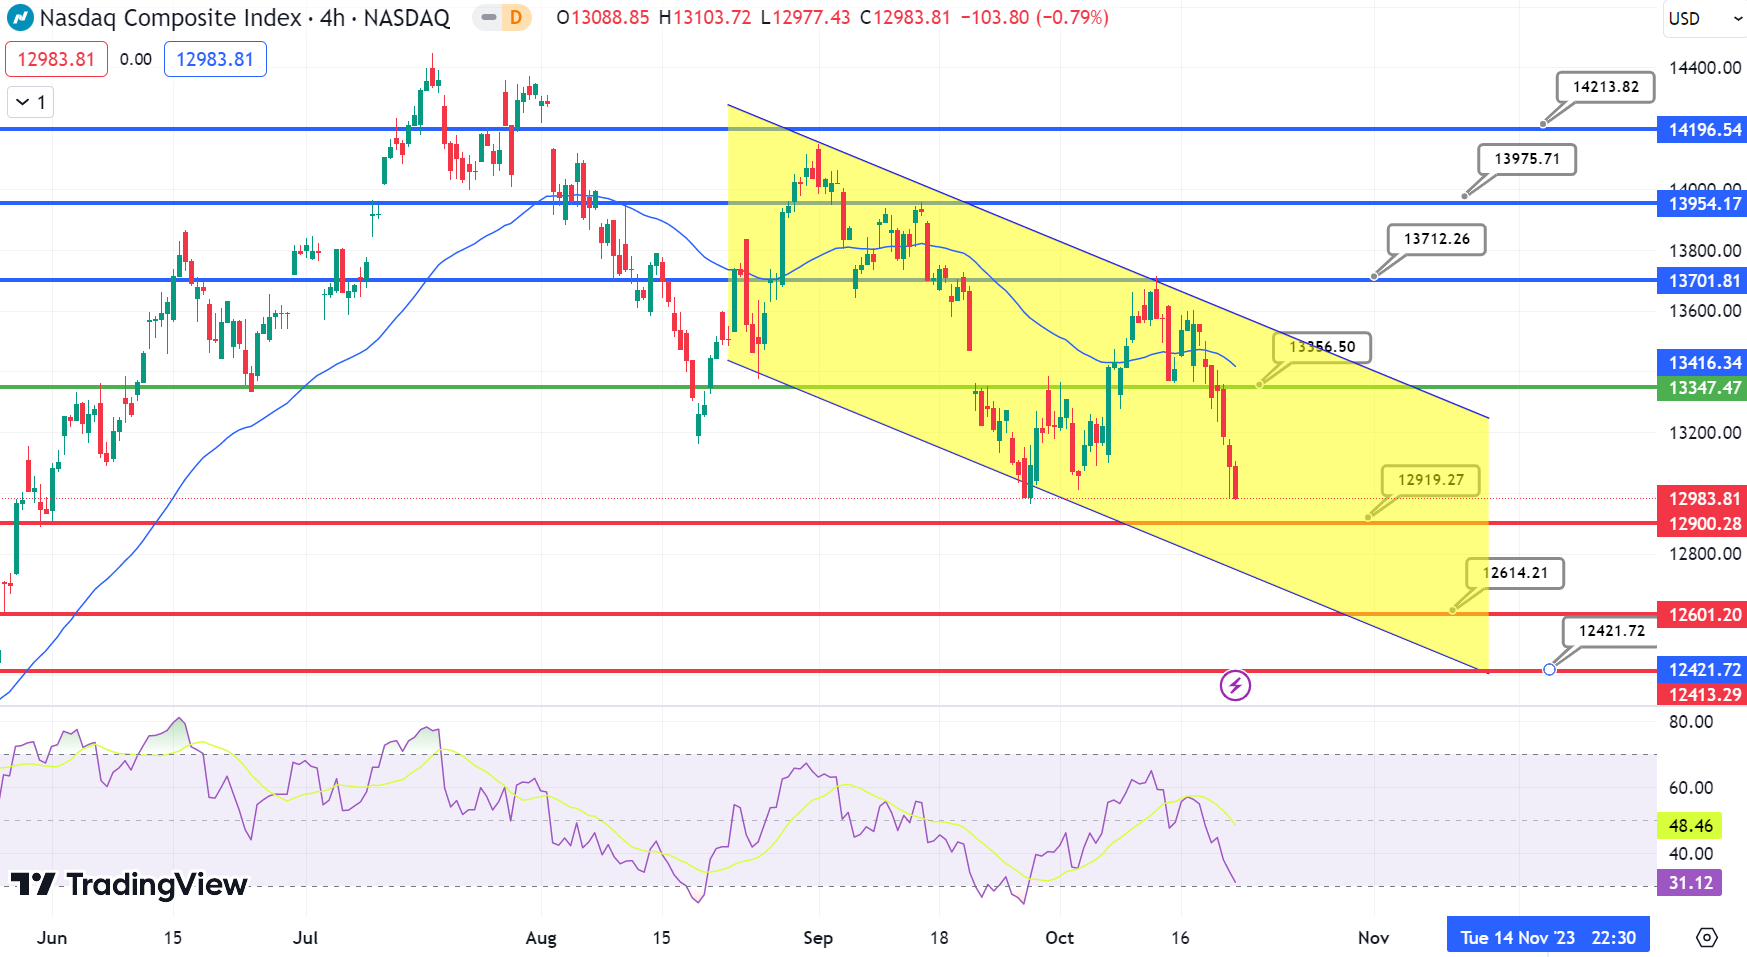
On this October 23rd analysis of the NASDAQ, the market appears less than optimistic. Currently at 12983.81, the index has seen a 0.74% decline over the past 24 hours.
Our 4-hour chart reveals a pivot point resting at 13357. Resistances loom at 13712, 13976, and 14214, while the market seems to have immediate support at 12919, trailed by 12614 and 12422.
Delving into the technical indicators, the Relative Strength Index (RSI) stands at 31, bordering the oversold territory, amplifying the bearish sentiment. Furthermore, with the NASDAQ currently below its 50-day Exponential Moving Average (EMA) of 13426, the selling trend is evident. The chart displays a distinct downward trendline, and alongside the 50 EMA, it further solidifies the bearish momentum.
This sentiment is accentuated by the presence of the triple bottom support around $12900 and the three black crows on the 4-hour chart. In conclusion, the short-term prognosis for NASDAQ remains bearish below $13426. A rebound above this point could, however, introduce a bullish tone.
Dow Jones
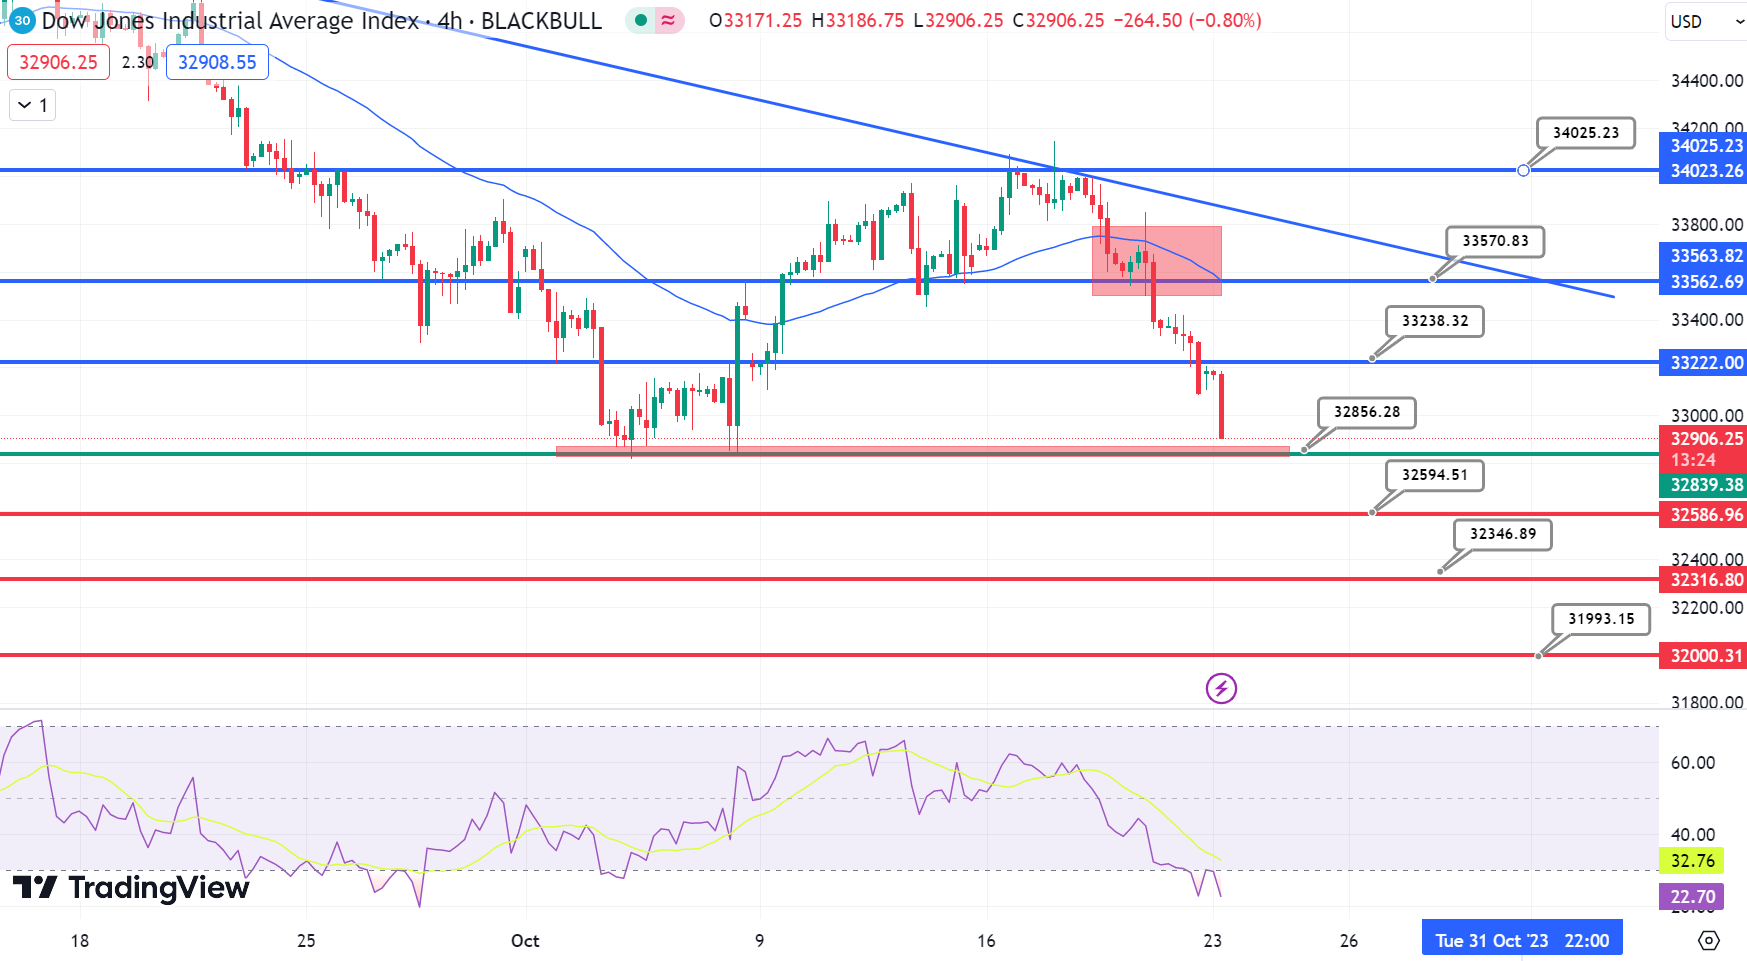
The Dow Jones Industrial Average (DJIA)‘s technical landscape presents a rather sobering picture this October 23rd. At 32906.25, it’s taken a slide of 0.53% within a day. The 4-hour chart pinpoints a pivot at 32856. Resistances are marked at 33238, 33571, and 34025.
On the flip side, support can be found at 32595, followed by 32347 and 31993. Delving into technical nuances, the RSI sits at a low of 22, indicating the oversold condition. Price movement rests uncomfortably below the 50-day EMA of 33565, further highlighting the current bearish inclination.
As for chart patterns, no distinct formation has been observed as of yet. In summation, the short-term perspective for Dow remains bearish under the $33238 threshold.
Should market dynamics shift, the index could challenge the immediate resistance zones, but caution remains the watchword for investors.
For a look at all of today’s economic events, check out our economic calendar.