Toncoin Signals That Preceded 350% Rally in Q1 2024 Are Flashing Once Again
Toncoin jumps 40% in November as DEX activity spikes and a falling wedge breakout signals a potential rally to $8.75, with $14 in sight.Toncoin (TON) has rebounded by over 40% so far in November, recovering almost all the losses it incurred following Telegram Founder Pavel Durov’s arrest in August.
Donald Trump’s reelection as president of the United States has boosted upside sentiment in the entire crypto market, bringing the top coin, Bitcoin (BTC), to its new all-time high of $99,800. As a result, altcoins like Toncoin, which typically tails the broader crypto market’s trend, have fared well.
Nonetheless, the Toncoin rally accompanies additional bullish signals, akin to factors that preceded its 350% price boom in the first quarter of 2024. That raises TON’s prospects of continuing its bull run in December 2024 and during the first quarter of 2025.
TON’s DEX Swap Activity, Golden Cross Hints At 200% Rally
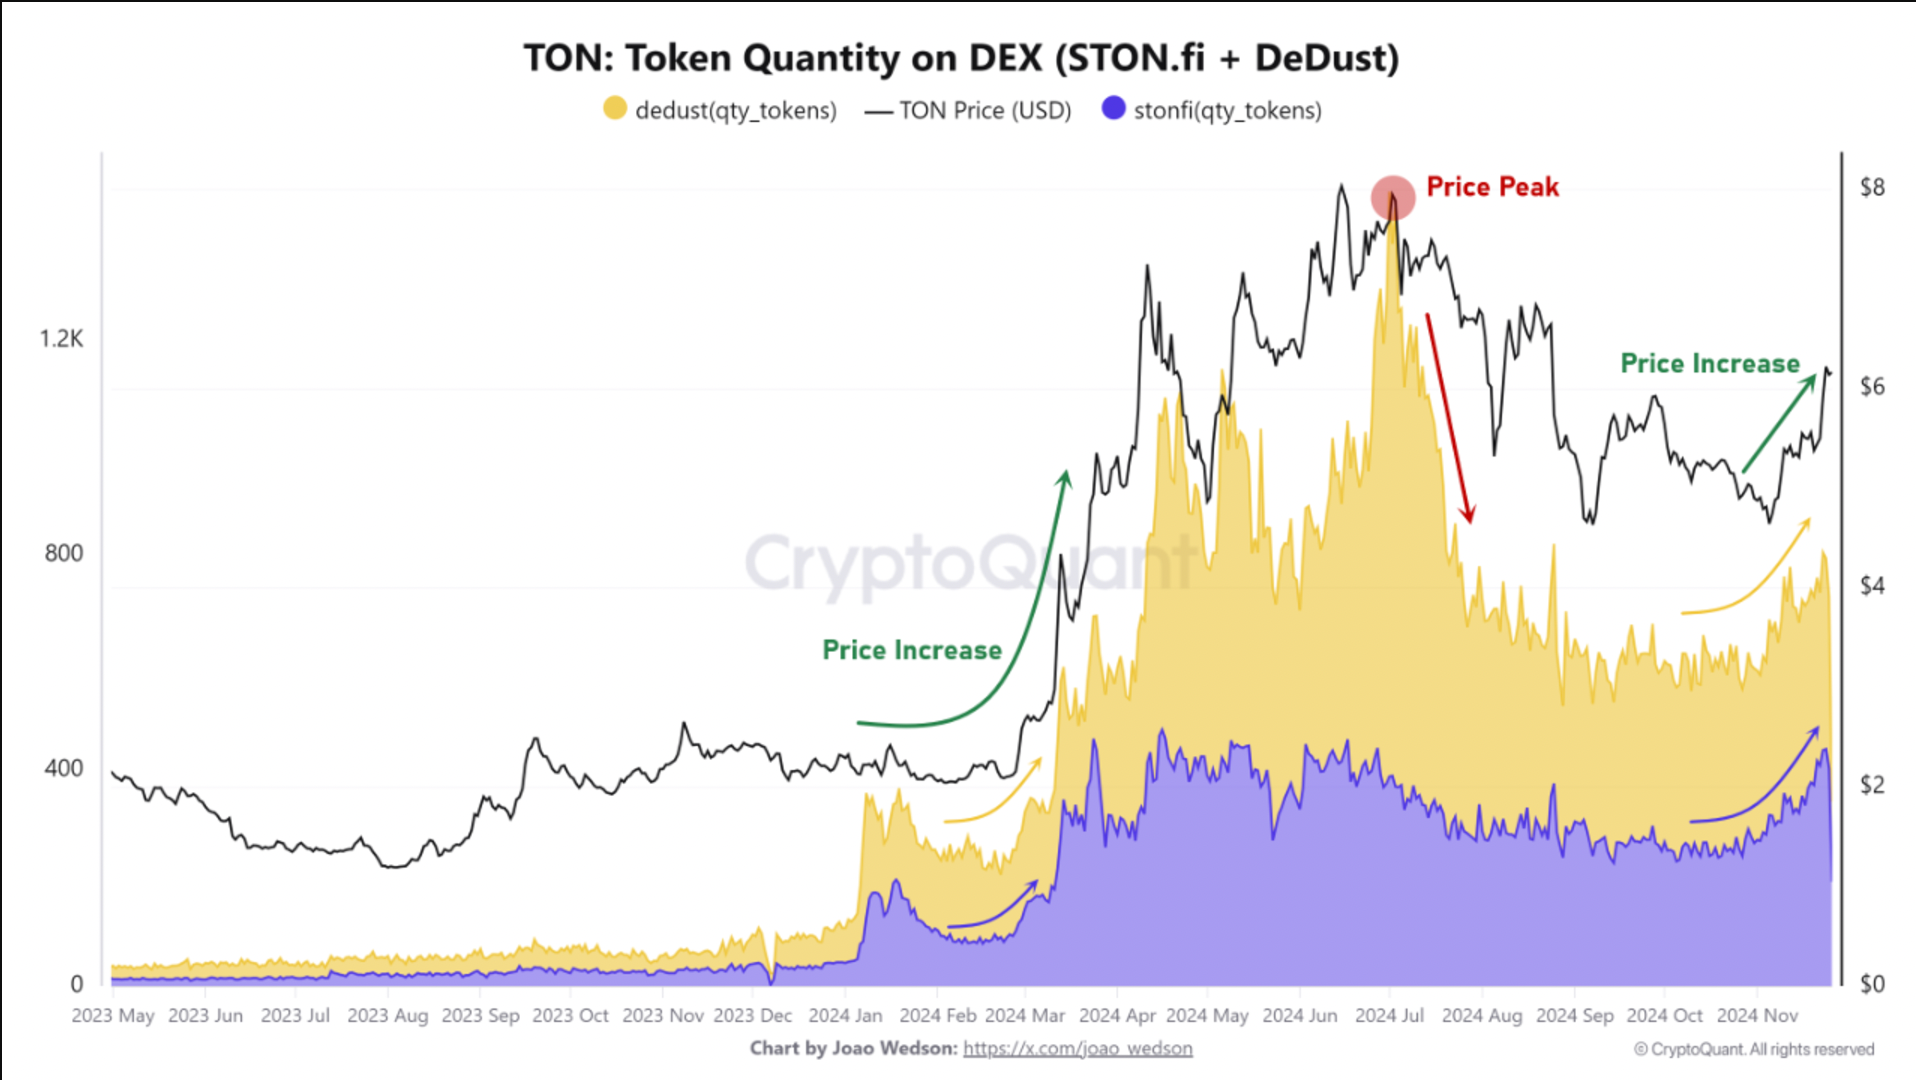
Recent on-chain data shows a notable increase in trading activity on Toncoin’s leading DEX platforms: STON.fi and DeDust. They have witnessed a sharp uptick in swap transactions, with DeDust seeing an average of 4 swaps per user and STON.fi averaging 2.76 swaps per user during TON’s price recovery.
STON.fi leads in trading volume, capturing around 75% of all platform transactions. Its increased activity suggests a positive feedback loop: as more users swap and trade TON, liquidity deepens, incentivizing further participation and potentially driving up prices.

The current market dynamics resemble the factors that preceded TON’s 350% rally in Q1 2024. During that period, a surge in DEX trading activity and broader market strength fueled a parabolic rise in Toncoin’s price.
If history repeats, Toncoin could be poised for another bullish cycle. Higher swap volumes on STON.fi and DeDust and renewed interest in decentralized finance (DeFi) on TON may act as catalysts for the next leg of its price rally.
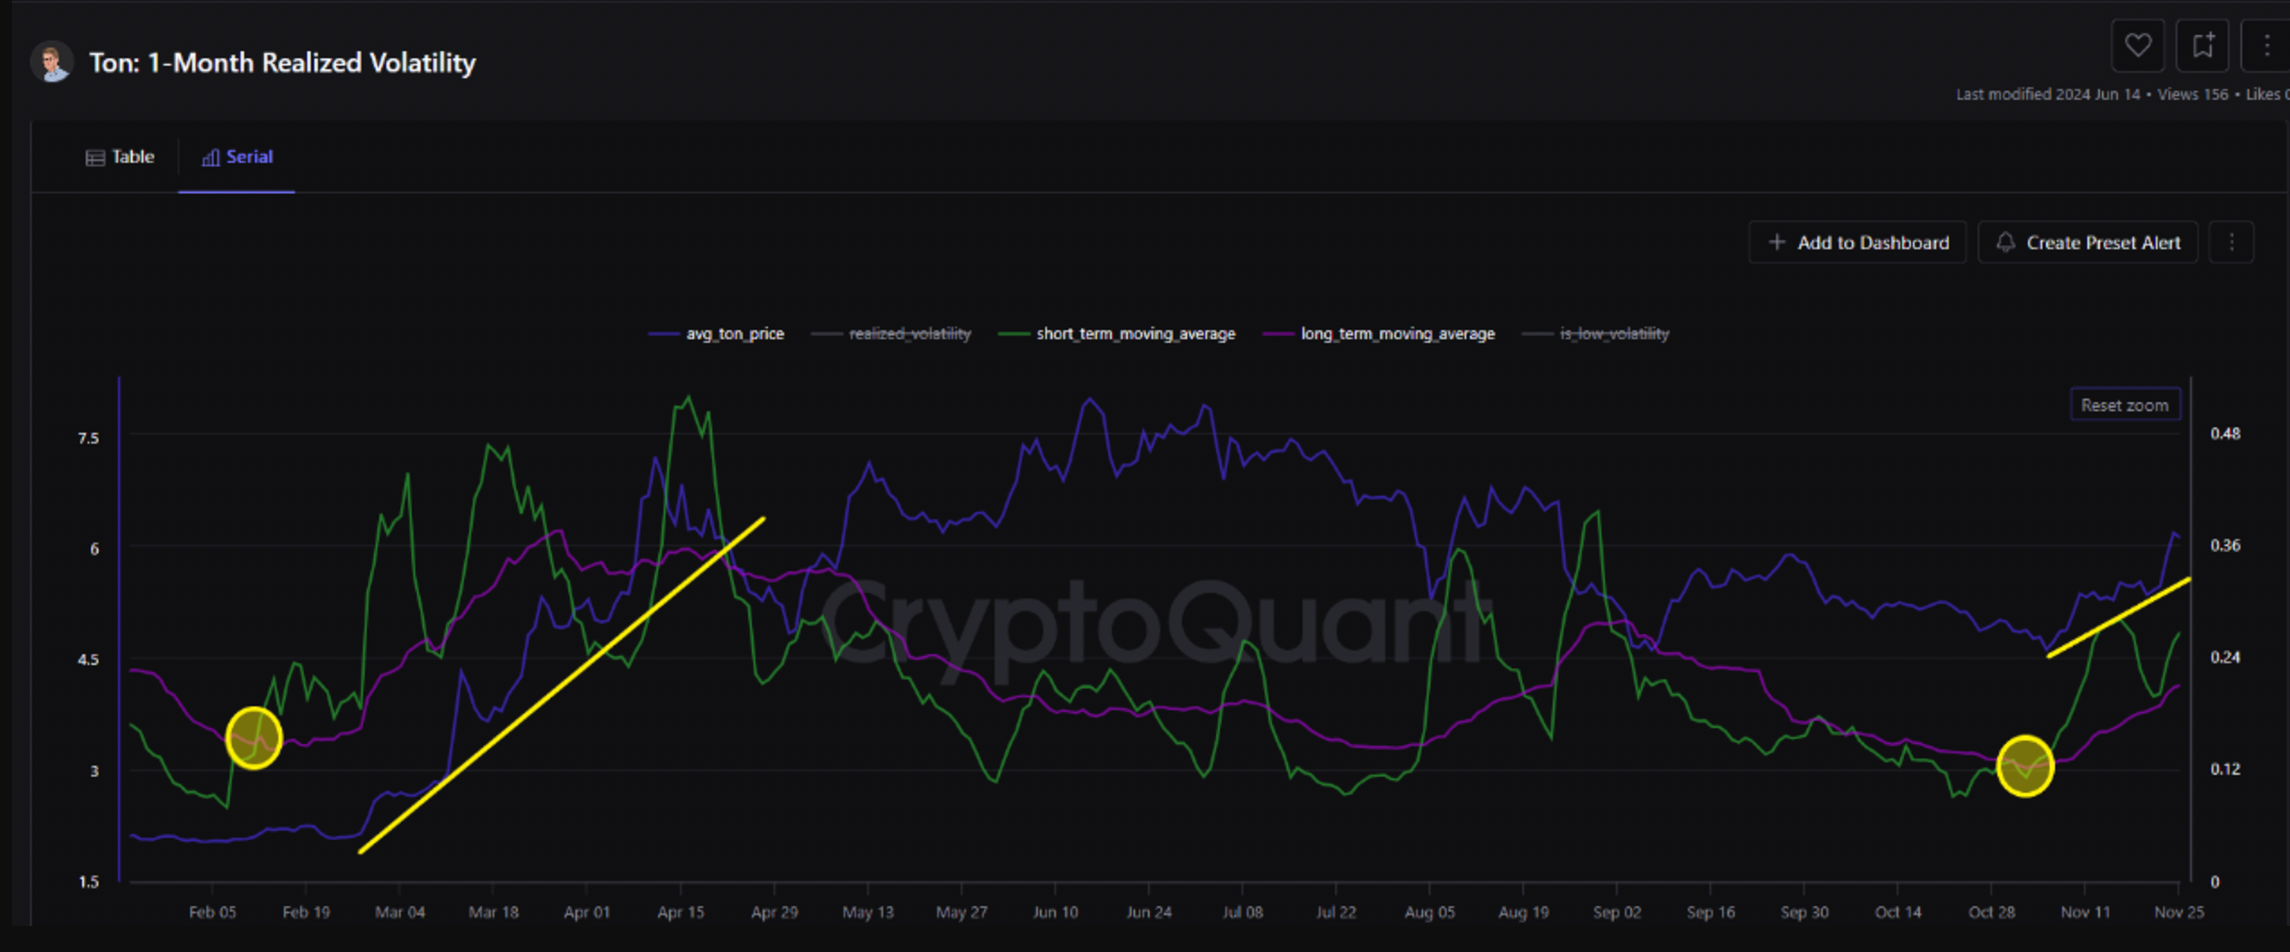
Furthermore, Toncoin’s 1-month volatility chart has triggered a “golden cross,” where the short-term moving average (STH MA) crosses above the long-term moving average (LTF MA), often signaling major price moves.

A similar signal on February 12, 2024, preceded a 243% rally in 54 days. The latest cross, on Nov. 6, 2024, has already fueled a 35%-plus jump, taking TON from $4.60 to over $6.50.
“Based on Fibonacci retracement levels and past performance, TON could potentially see a 200% increase, reaching a price range between $12 and $14,” noted Burak Kesmeci, analyst at CryptoQuant.
Toncoin Technical Analysis: TON/USD Enters Falling Wedge Breakout Stage
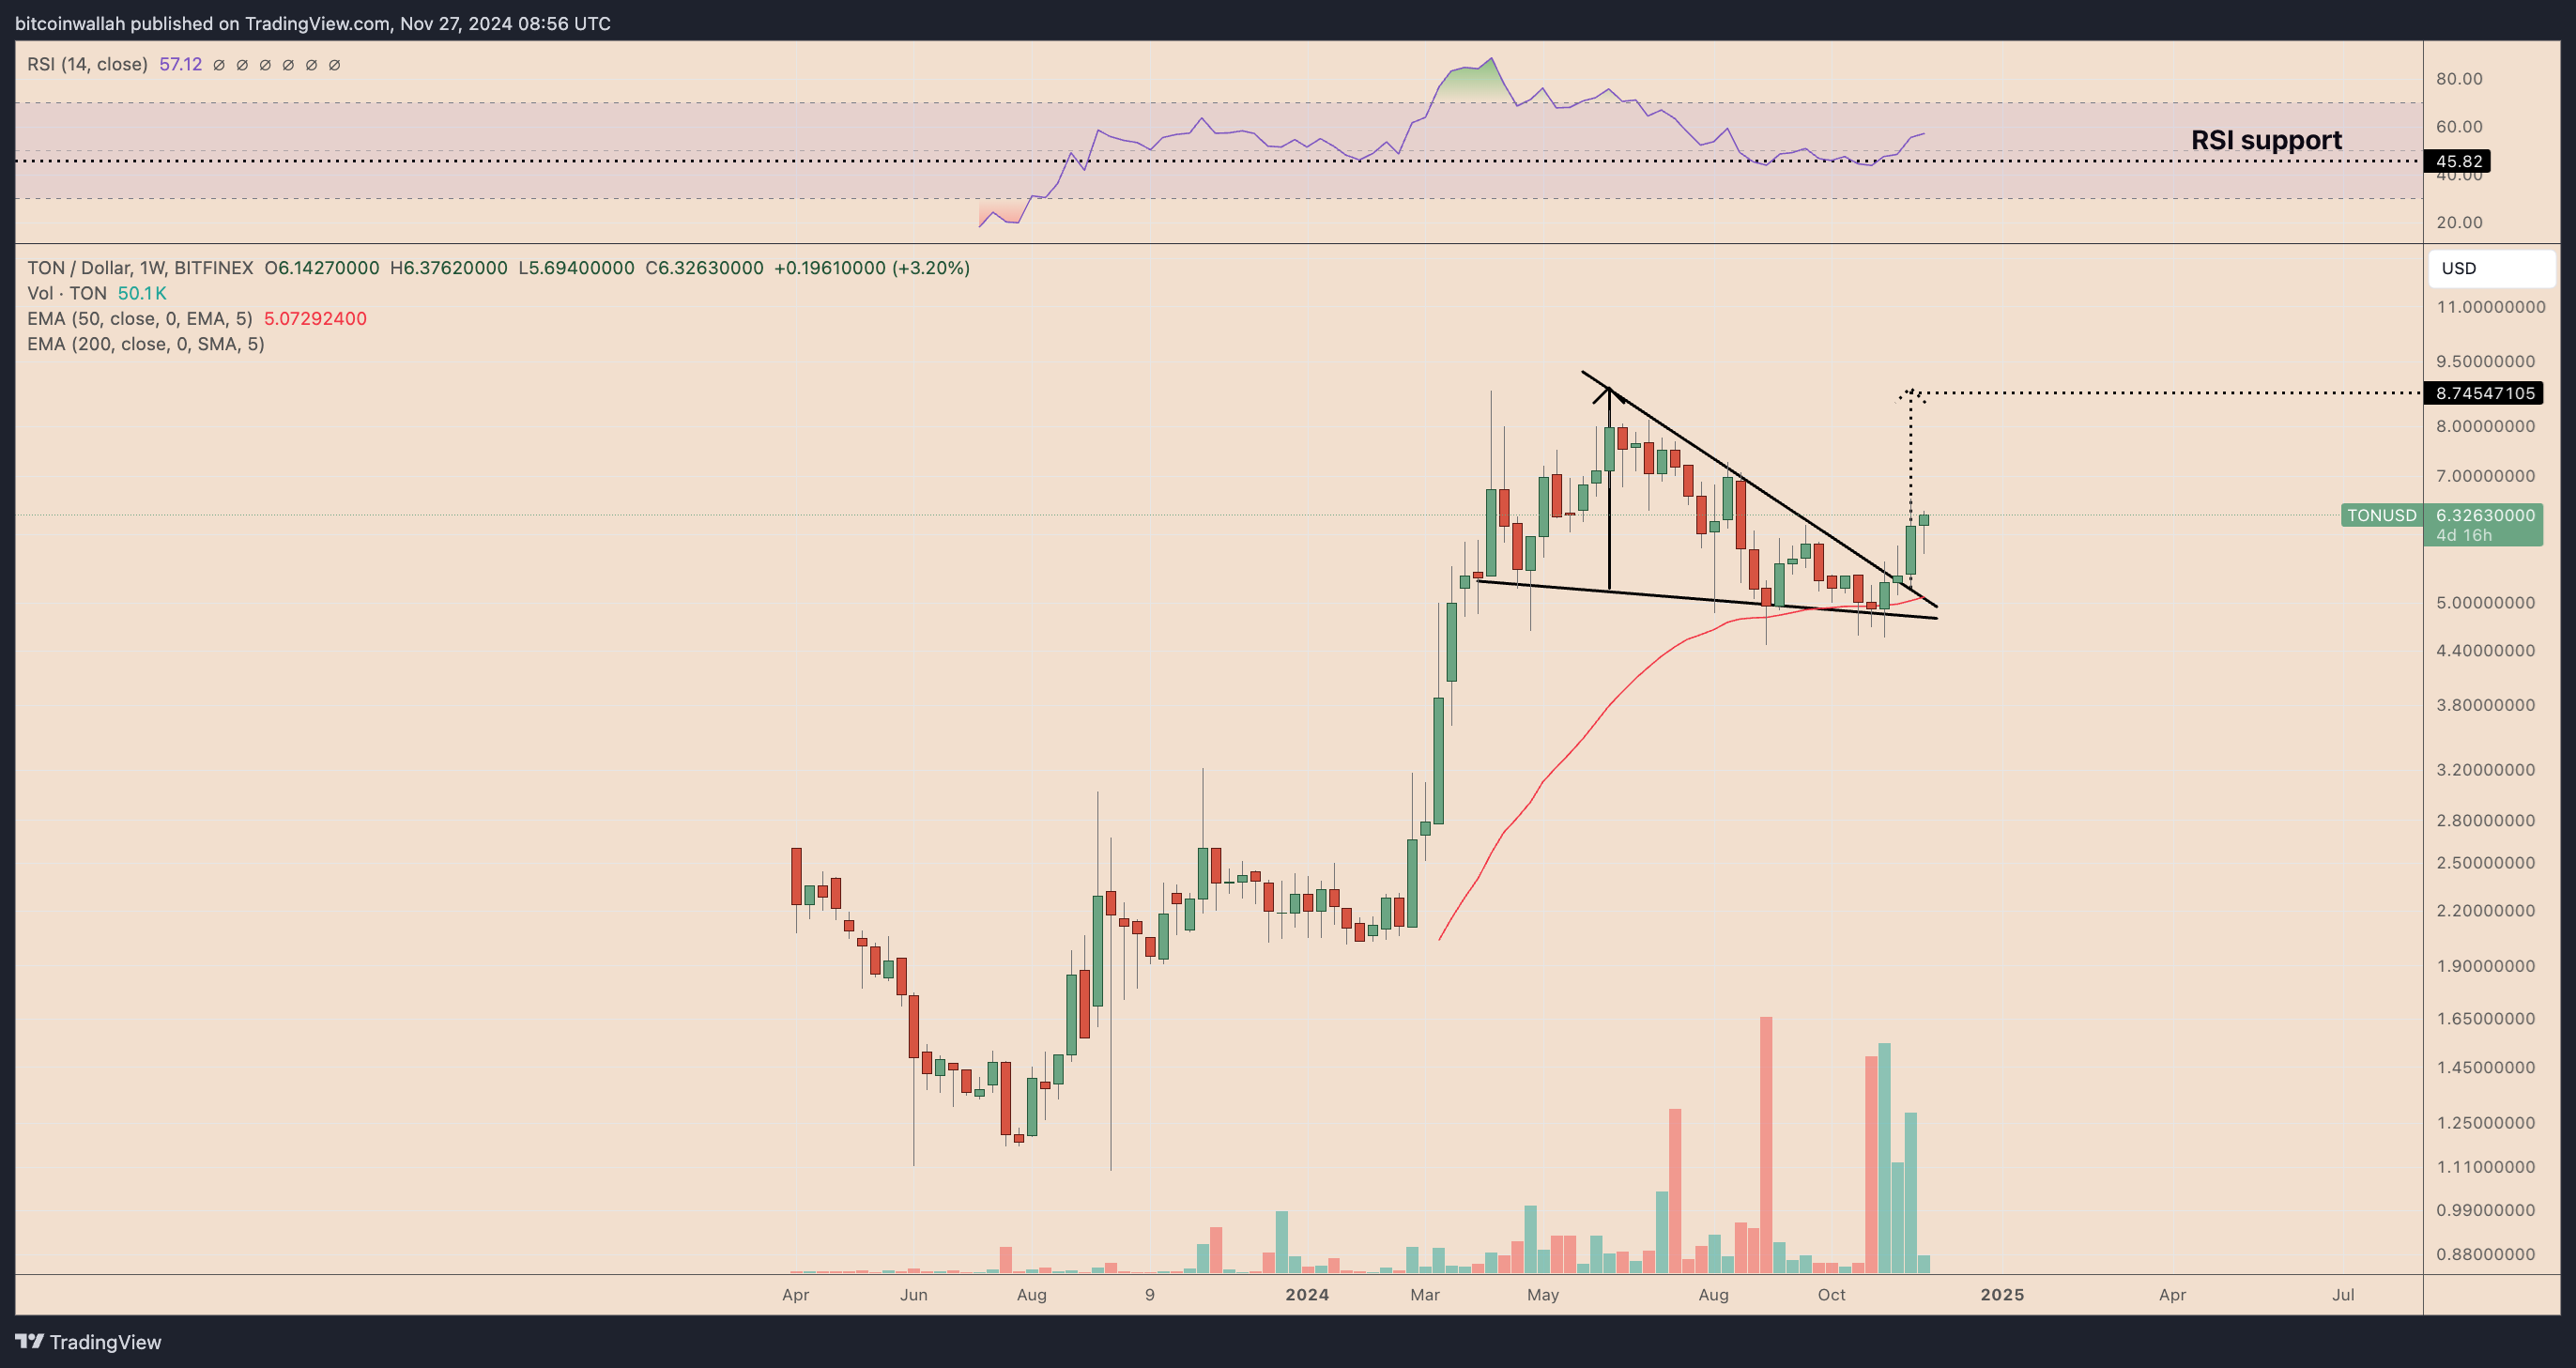
Toncoin has confirmed a breakout from a months-long falling wedge pattern on the weekly chart, signaling a potential bullish reversal. The breakout, which occurred as TON rallied past the $6.00 level, is supported by increased trading volumes and aligns with broader market strength.

The falling wedge—a bullish continuation pattern—suggests a measured move target near $8.75, derived from adding the wedge’s maximum height to the breakout point. The target represents a potential 38% upside from current price levels around $6.32.
Additionally, TON’s weekly Relative Strength Index (RSI) has bounced from support near 45, indicating renewed buying momentum without overbought conditions.
