


Earnings-Fueled Advance Meets First Pullback
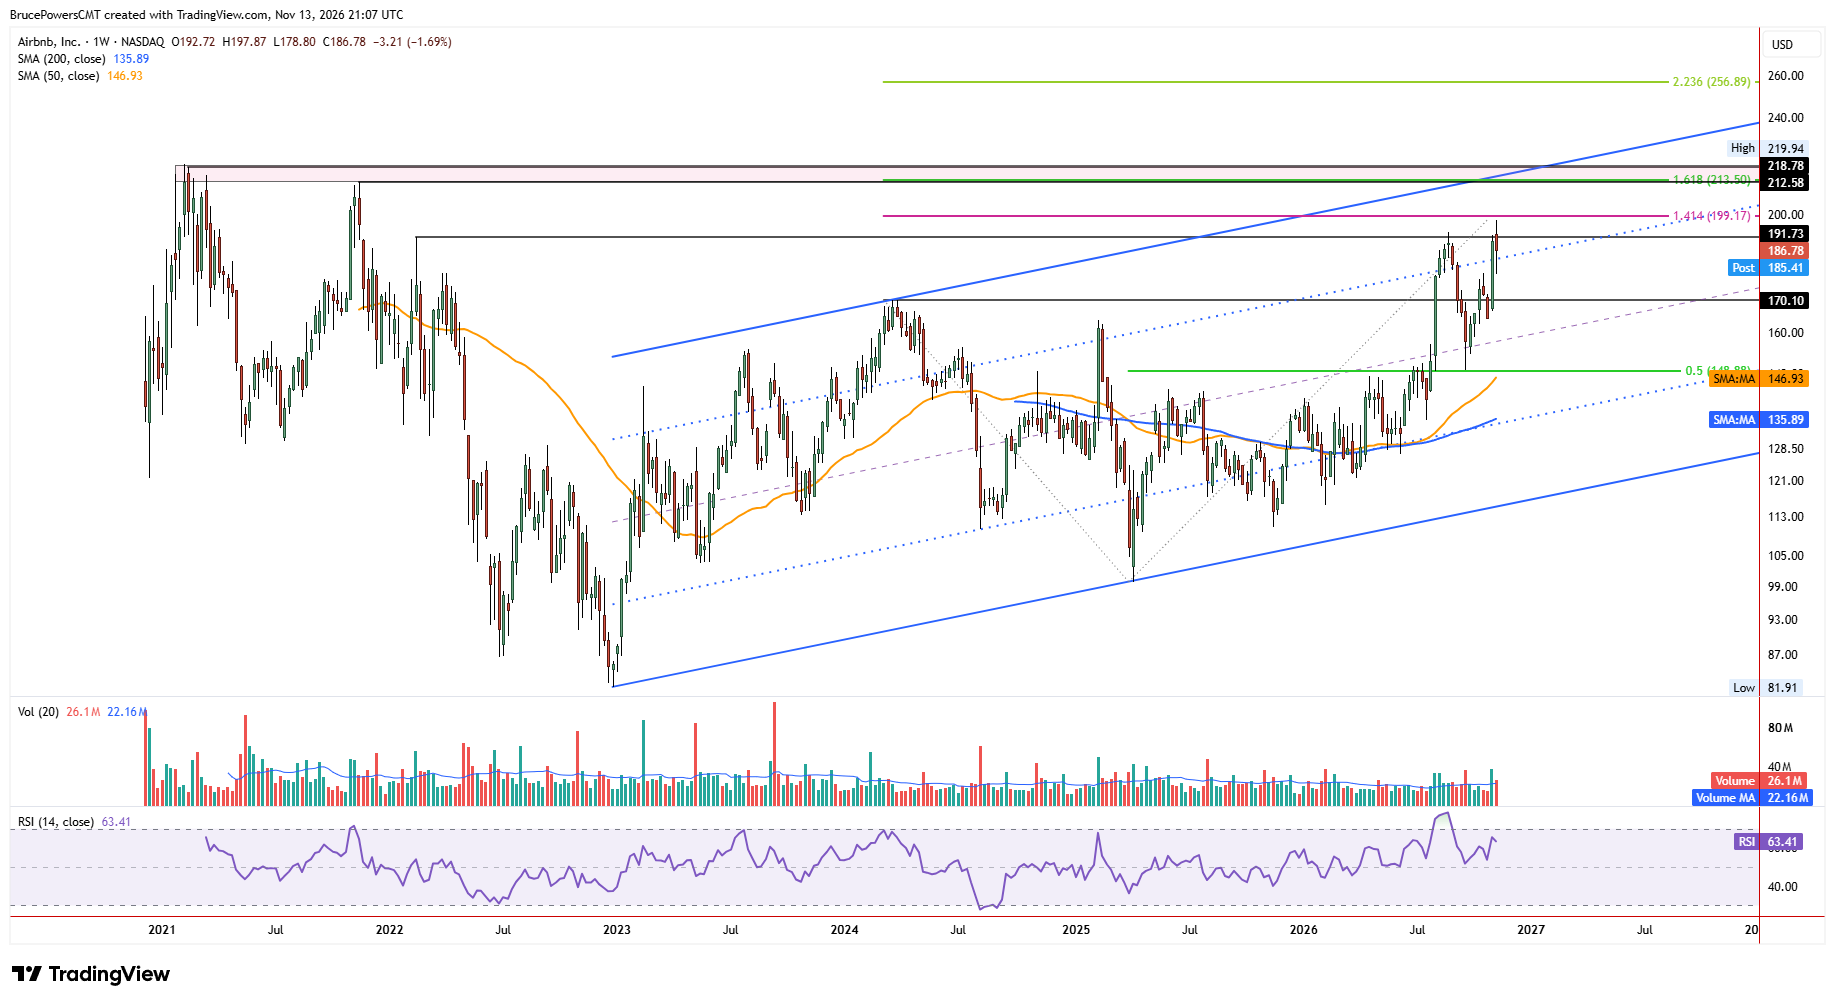
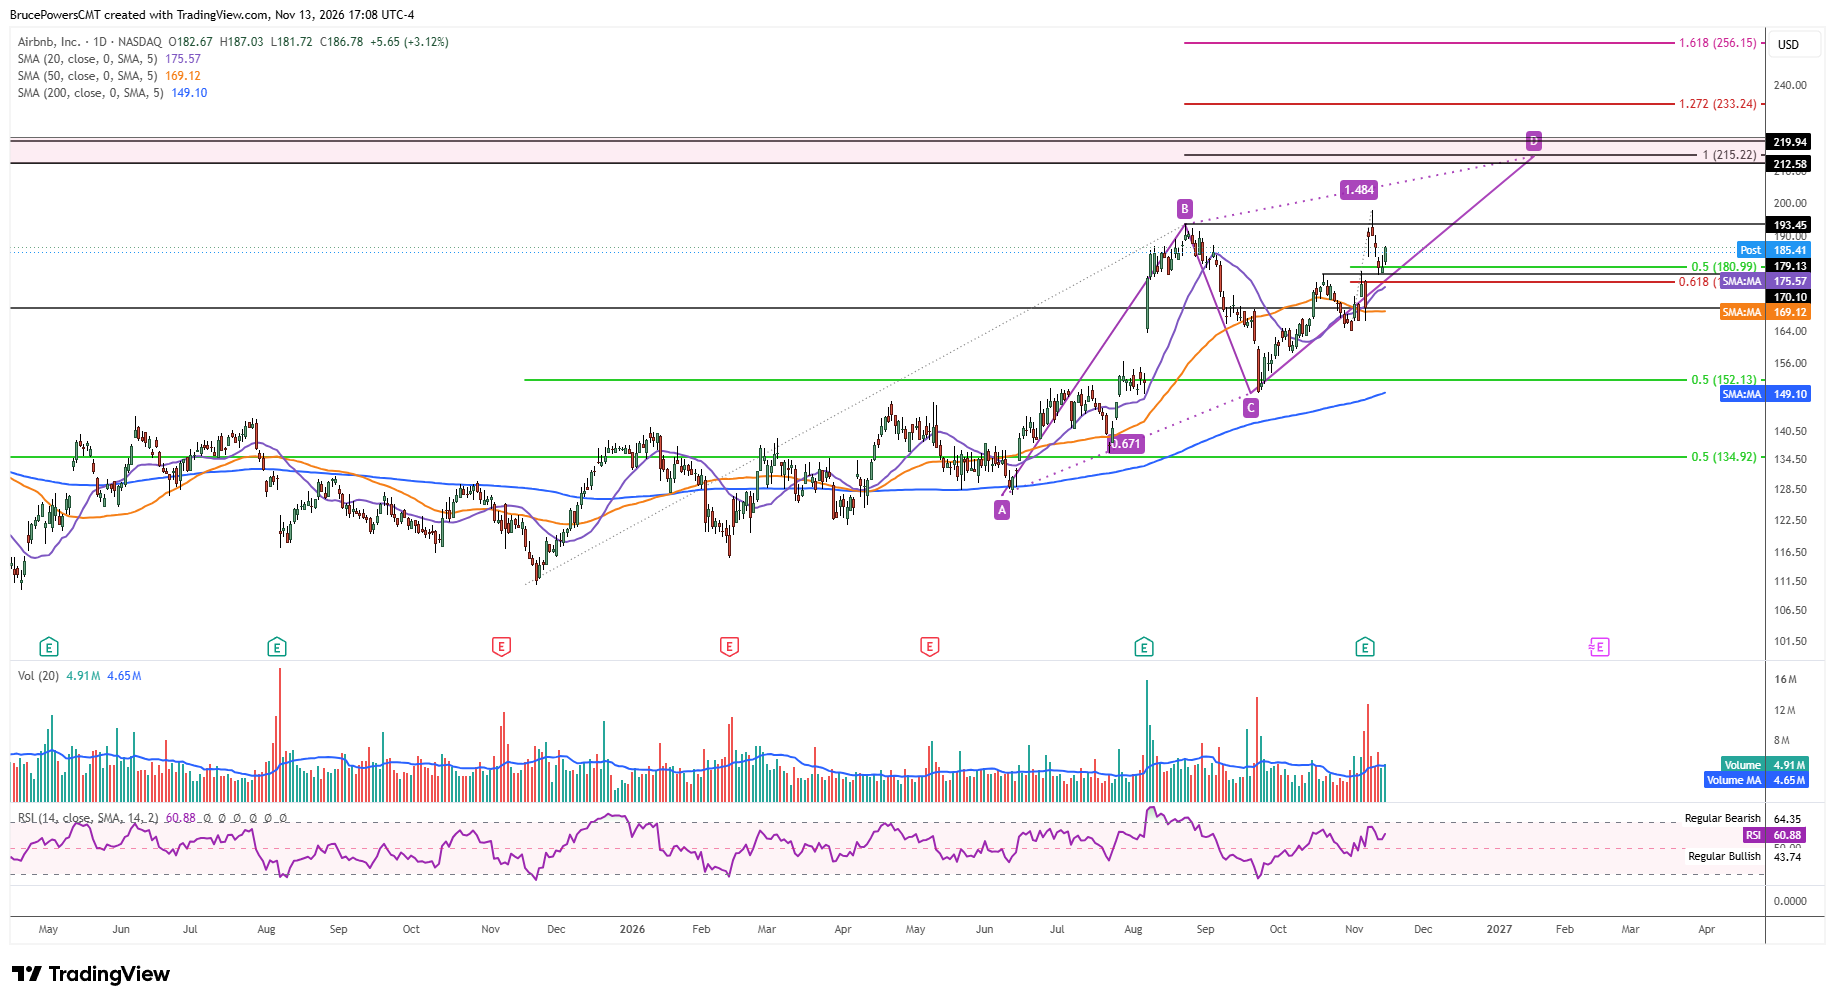
Airbnb, Inc. (ABNB) completed its first pullback this week following an extension of its bullish trend that triggered above $179.13. That advance followed the release of its Q3 2026 earnings on November 5. A high of $197.87 was hit on Monday, signaling an extension of the bullish trend above the prior high of $193.45 from August (B). However, the breakout was not confirmed by a close above that level, and the stock subsequently pulled back to test prior resistance as support.
Support Test Brings Buyers Back
Support was eventually found near $178.80, resulting in a higher swing low and the completion of a 50% retracement of the prior advance. Also, resistance at the recent swing high of $179.13 was successfully tested as support before buyers regained control. The subsequent rally to a three-day high of $187.03 on Friday signaled a potential completion of the pullback.
Relative Strength Favors Bullish Continuation
ABNB broke out of a long-term consolidation base in August in response to its earlier earnings report, leading to the $193.45 high. Given the weakness seen in the broader market, ABNB has held up well and is showing relative strength. If buyers can retain control, the stock is positioned for a potential continuation of the long-term bullish trend on a rally above this week’s high, which would also establish a new trend high above $197.87.
Historical Resistance Defines Upside Targets
There is a confluence of several resistance levels from $212.58 to $219.94 that marks a key upside target for the stock. Those levels come from prior peaks in 2021 and include an initial 100% projection for a large rising ABCD pattern at $214.22 (D). Key support is clear at this week’s higher weekly low of $178.80. If support holds and buyers retain control, ABNB is well positioned to eventually head towards that upside price zone. A breakout above that zone would further strengthen the bullish outlook, putting the stock on track for a test of resistance at the 127.2% Fibonacci extension of the ABCD pattern at $233.24 or the 161.8% projection at $256.15.
If you’d like to know more about technical analysis and how traders use it, please visit our educational area.