


Oversold Conditions Meet Long-Term Support
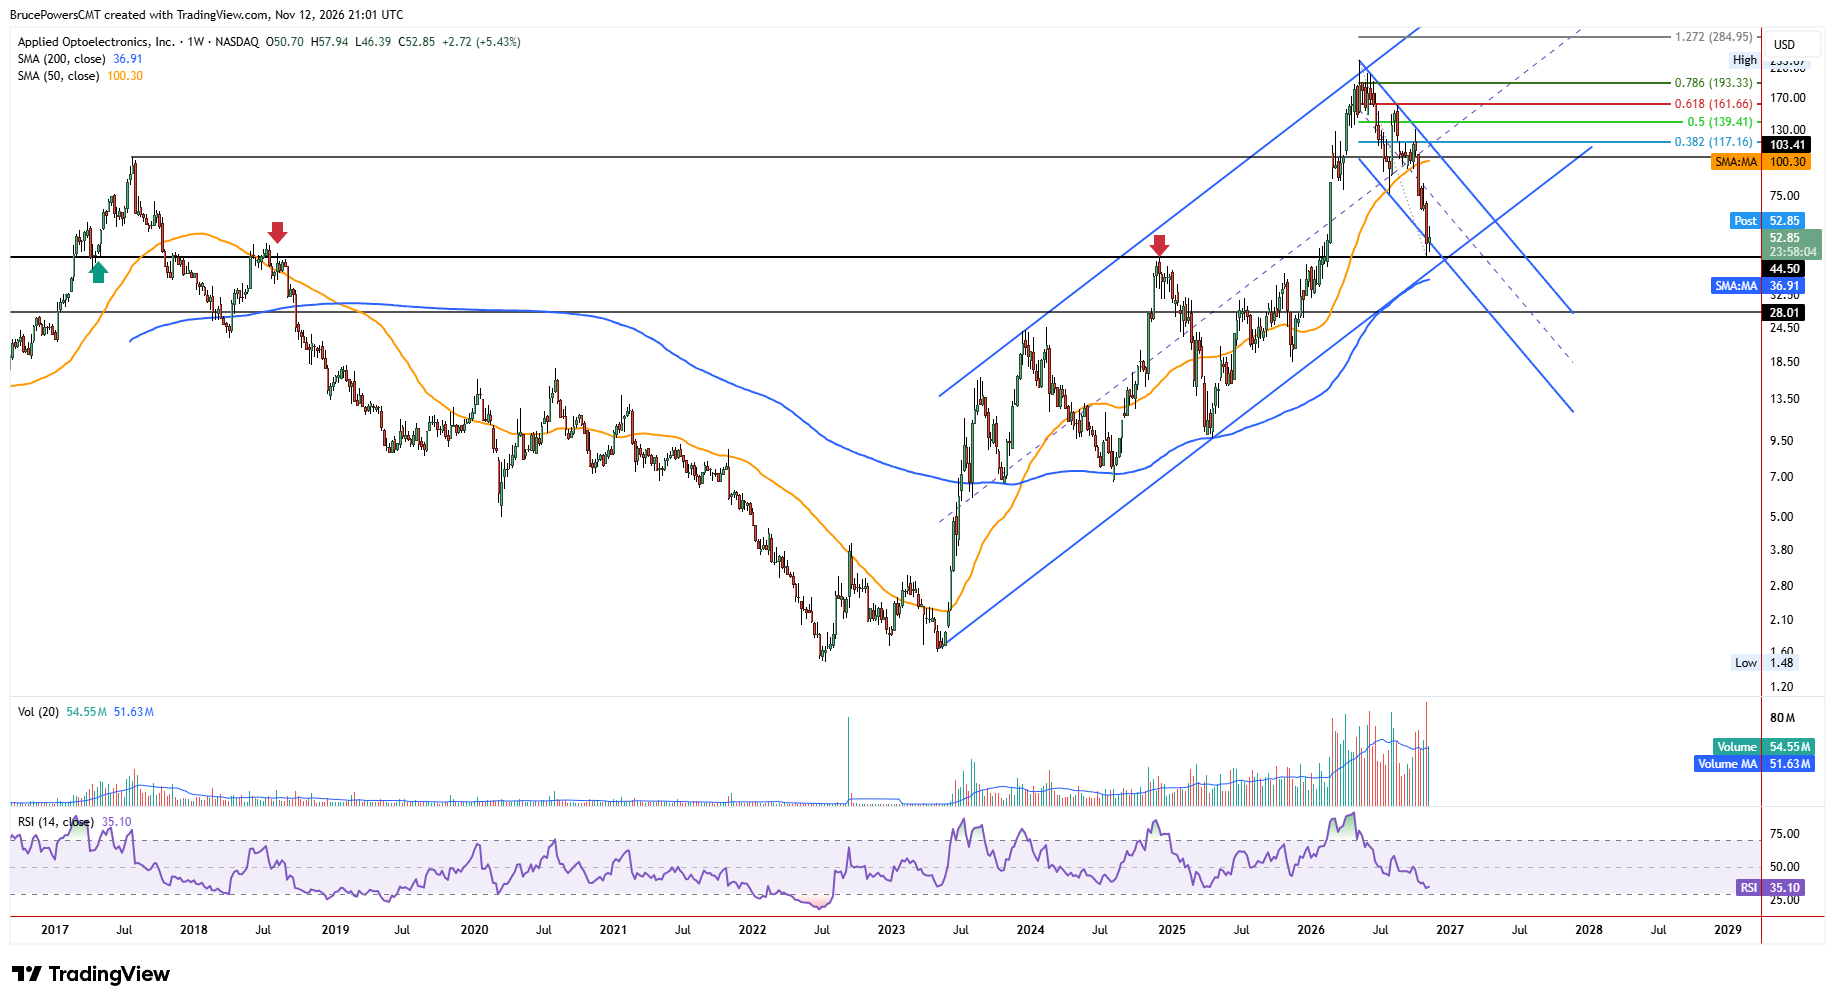
Applied Optoelectronics, Inc. (AAOI) remains under pressure following its Q3 2026 earnings report, with the stock extending its decline to a new low of $45.15 before bouncing. The company is involved in optical networking for data centers, CATV, and telecom networks. The relative strength index (RSI) moved into oversold territory for the first time since March 2025, as the angle of descent accelerated following the most recent break below the 200-day moving average in early October.
Historical Structure Offers a Potential Floor
Although support was suggested by prior structure and the lower boundary of a falling trend channel, the significance of that support deserves attention. Structure support goes back to 2017, suggesting it could be significant and eventually resolve to the upside. Nonetheless, key support is clear at $45.15, and a break below it would negate a near-term bullish scenario.
Channel Recovery Provides First Sign of Stabilization
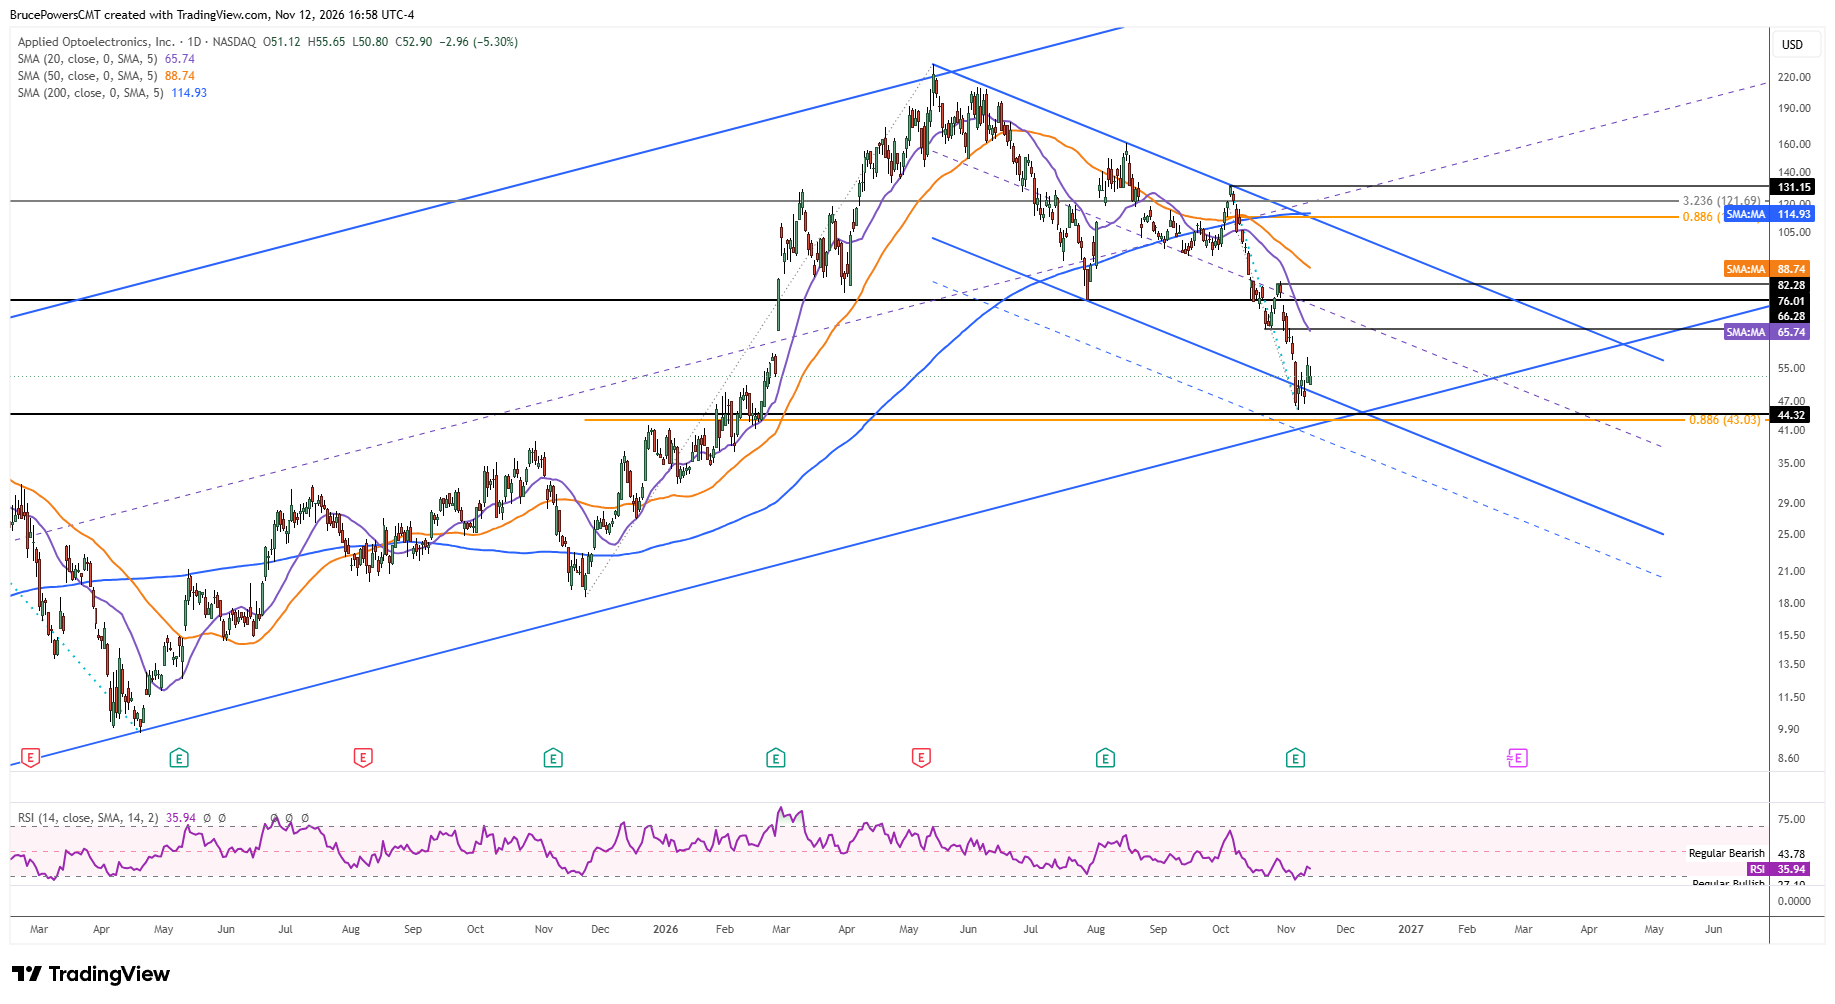
An initial bounce from the low recovered the lower channel boundary and it was successfully tested as support during both Wednesday’s and Thursday’s sessions, which is a sign of strengthening. If support continues to hold above that lower boundary, there is the potential for a sustained advance toward a test of higher resistance levels. A rally would further validate the channel structure, supporting a possible move to the upper boundary of the channel. This would improve the potential to reach initial upside resistance targets.
Buyers Face Initial Resistance Near $66
Since last week’s low of $45.15, AAOI has been consolidating near the lower channel boundary and may continue to do so before buyers regain control. The high for the six-day range was reached on Wednesday at $57.94. If buyers can regain control, initial upside targets include a swing low at $66.28 and a more significant swing low at $76.01.
There is also the falling 20-day moving average, currently near $65.76, providing potential dynamic resistance and a nearer-term initial target if reached soon, as it continues to decline and remains below $66.28. Holding the lower channel boundary remains important to this recovery scenario, while a break below $45.15 would undermine the potential for a sustained advance and reinforce the bearish implications of the decline that opened this analysis.
If you’d like to know more about technical analysis and how traders use it, please visit our educational area.