
Advertisement
Advertisement
Crude Oil Price Forecast September 11, 2017, Technical Analysis
Updated: Sep 9, 2017, 05:40 GMT+00:00
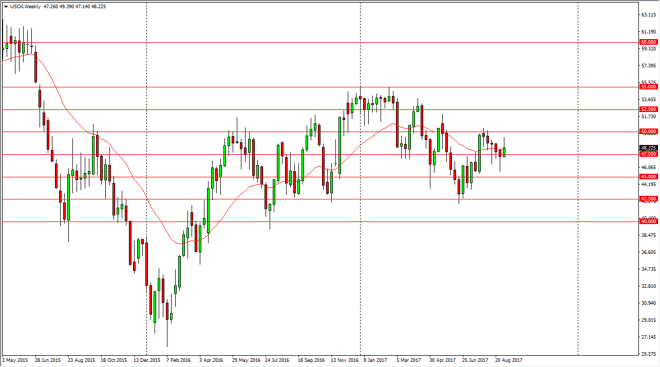
WTI Crude Oil The WTI Crude Oil market fell apart on Friday, as it looks to be reaching towards the $47.50 level. There should be a significant amount of
WTI Crude Oil
The WTI Crude Oil market fell apart on Friday, as it looks to be reaching towards the $47.50 level. There should be a significant amount of support in that area, but part of this is probably due to weekend profit taking and of course the fact that hurricane Irma won’t be doing as much destruction in the Gulf of Mexico. I believe that this market has been overdone for some time, and I had previously suggested that $50 would be “a bridge too far”, and it appears that has come true. Expect a lot of volatility in the markets as weather concerns play a major factor, which of course can change any moment. The US dollar strengthening during the day certainly does not help the price of WTI Crude Oil, and all things being equal I think that we will continue to see choppiness but I also believe that longer-term fundamentals are starting to come back into play.
WTI Video 11.9.17
Brent
The Brent market went sideways initially on Friday, but then collapsed and reached down towards the $54 level during US trading. There are a couple of different factors involved, as many traders had bet that hurricane Irma would cause disruptions. While it should a point, it looks as if the major infrastructure of the crude oil supply chain should be spared most of the damage. Also, I suspect that there are a lot of people taking profits before they go home for the weekend as betting on the weather is very risky to say the least. After that, there is a report coming out of China that they are closing privately owned oil refineries, which could cause a demand problem. Nonetheless, if we can break down below the $53.50 level, I don’t see the reason that the market doesn’t fall to the $52.50 level.
About the Author
Christopher Lewisauthor
Chris is a proprietary trader with more than 20 years of experience across various markets, including currencies, indices and commodities. As a senior analyst at FXEmpire since the website’s early days, he offers readers advanced market perspectives to navigate today’s financial landscape with confidence.


Advertisement