



Stock Market Rally Fades as Traders Await Anthropic
The major U.S. stock indexes gave up their early gains on Thursday as traders waited for Anthropic to begin trading. The Nasdaq Composite was near the flatline after rising 2.1%, while the S&P 500 fell 0.4% after gaining 1.3%. The Dow Jones Industrial Average dropped 492 points, or 1%, after being up more than 200 points.
Chip stocks also came off their highs. Nvidia was up nearly 1%, while Micron Technology gained more than 1%. Advanced Micro Devices fell more than 10% after Hunterbrook disclosed a short position and raised concerns about possible U.S. export control breaches involving China.
Anthropic is set to begin trading on the Nasdaq under the ticker ANT. The company raised $81.3 billion after increasing the size of its initial public offering and pricing shares at $83, above the expected range. Investors are waiting to see how the stock performs in its debut.
The IPO comes as investors question whether heavy spending on artificial intelligence will translate into profits.
Daily S&P 500 Index (SPX) Technical Analysis
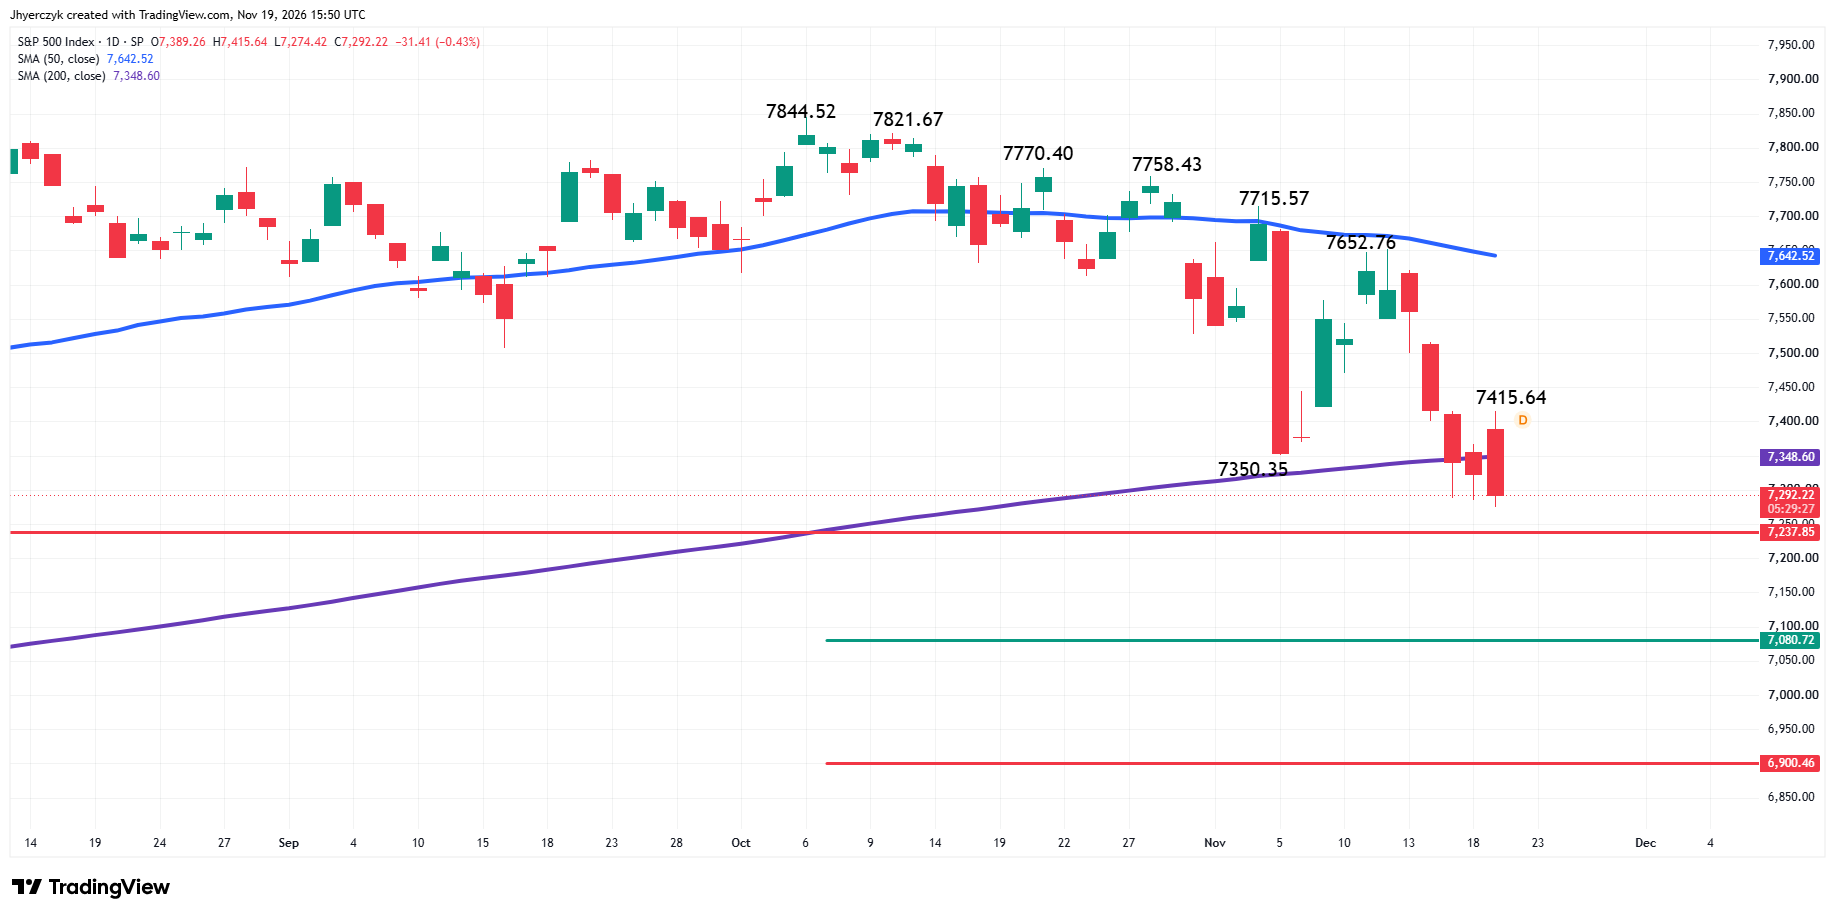
The S&P 500 Index gave back its early gains on Thursday and turned lower. The index crossed back to the weak side of the 200-day moving average at 7348.60 after trading above it earlier in the session.
The main trend is down according to the daily swing chart. The index has taken out Tuesday’s intraday low at 7288.34, putting the June 9 main bottom at 7237.85 at risk.
My long-term range is defined as the March 30 bottom at 6316.91 to the October 6 main top at 7844.52. If the downside momentum continues and the selling takes out 7237.85, then the selling pressure could extend into the long-term 50% to 61.8% retracement zone at 7080.72 to 6900.46.
The main trend will change to up when buyers take out the swing top at 7715.57. That move will also put the index on the strong side of the 50-day moving average at 7642.52.
The new minor top is 7415.64. A trade through this level will change the minor trend to up and possibly shift the momentum.
Daily Nasdaq Composite (IXIC) Technical Analysis
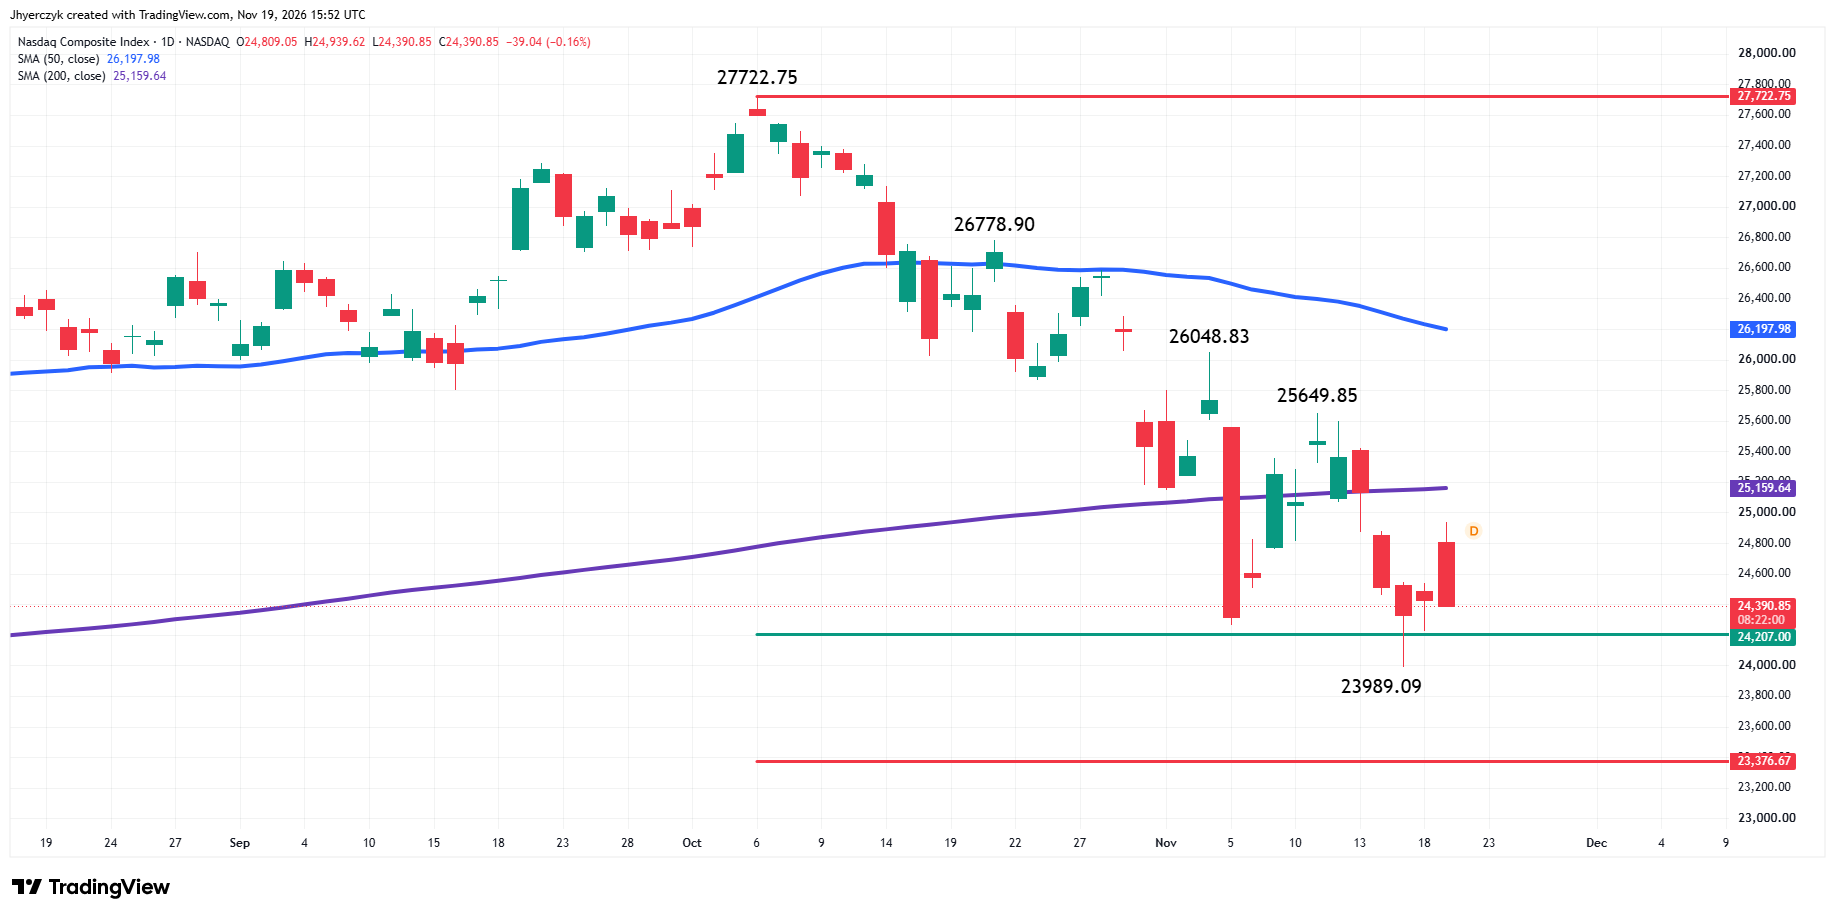
The Nasdaq Composite gave back its early gains on Thursday and turned lower. The index remains above its long-term 50% level at 24206.50, but is trading on the weak side of its 200-day moving average at 25159.64.
The main trend is down according to the daily swing chart. A trade through Tuesday’s intraday low at 23989.09 will signal a resumption of the downtrend. The main trend will change to up if the last main top at 25649.85 is taken out.
The long-term range is formed by the March 30 main bottom at 20690.25 to the October 6 main top at 27722.75. Its retracement zone is 24206.50 to 23376.67. Trader reaction to the upper or 50% level could determine whether buyers can stop the selling or the index challenges the lower end of the zone.
Daily Dow Jones Industrial Average (DJI) Technical Analysis
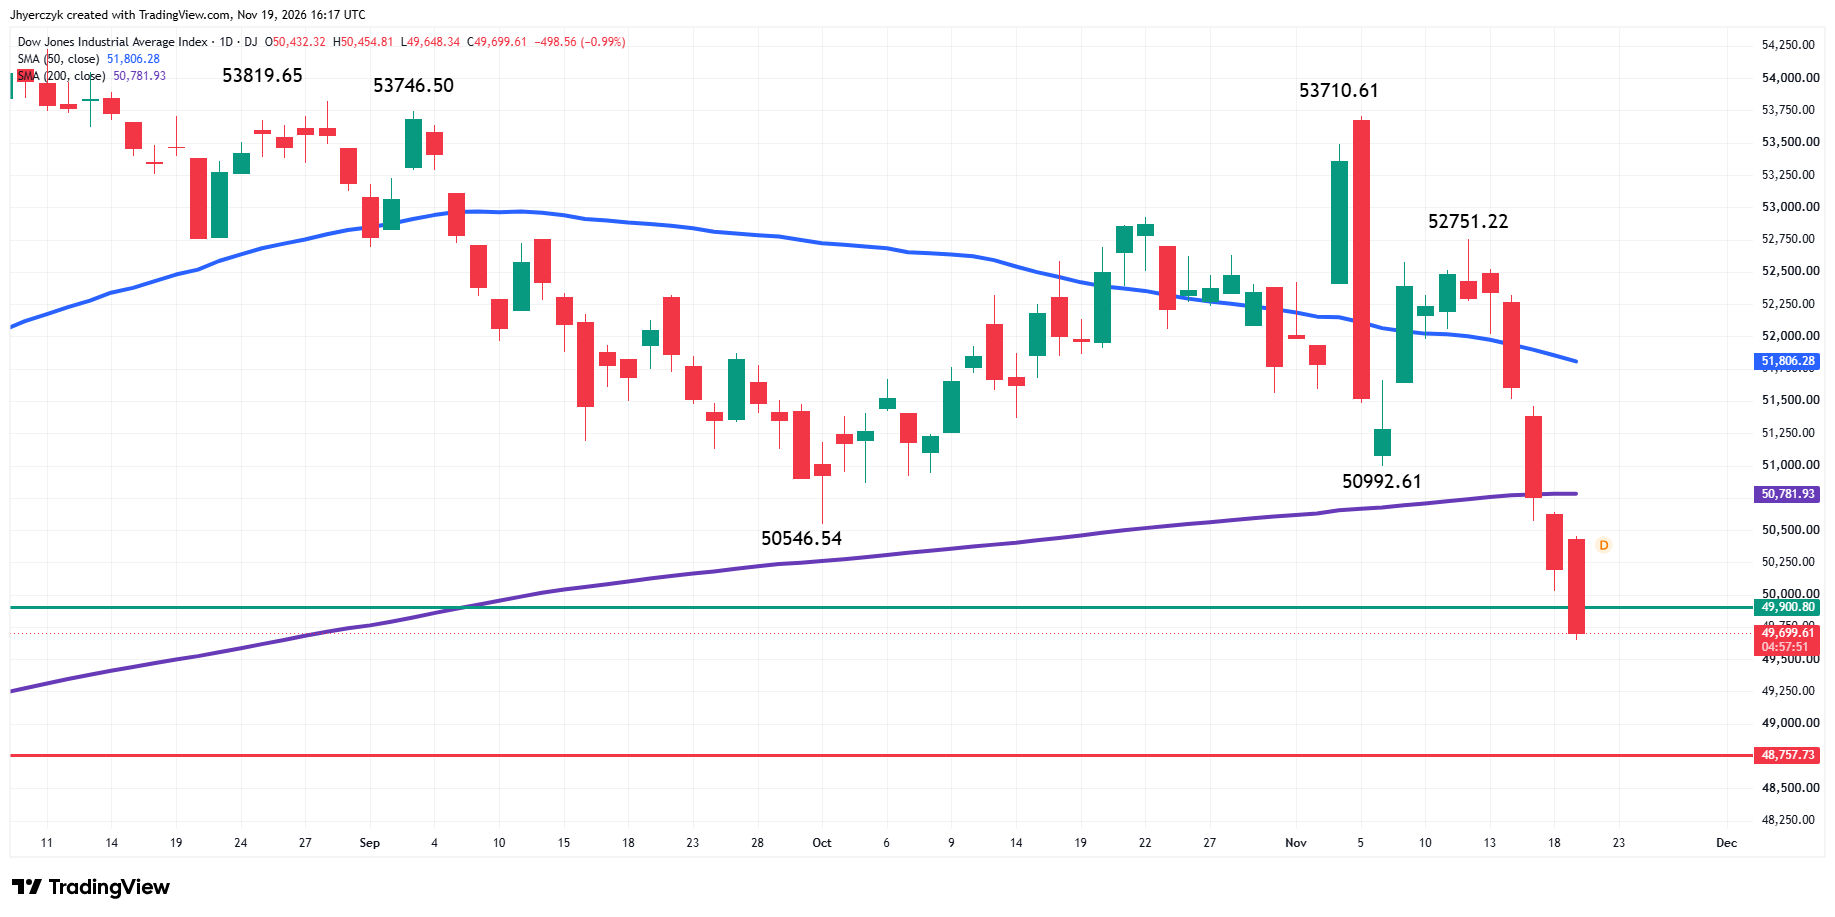
The Dow Jones Industrial Average turned lower on Thursday after trading higher earlier in the session. The index has broken through the upper or 50% level of its long-term retracement zone at 49900.80.
The main trend is down according to the daily swing chart. A trade through the swing top at 52751.22 will change the main trend to up.
The long-term retracement zone formed by the March 30 main bottom at 45057.28 to the August 5 main top at 54744.33 is 49900.80 to 48757.73. The Dow is trading inside this zone, which could be a potential value area for longer-term investors.
The Dow is also trading on the weak side of the 200-day moving average at 50782.38. The 50-day moving average at 51808.08 is resistance.
What to Watch
S&P 500 Index
My bias is bearish because the main trend indicator is down and the index is trading on the weak side of the 200-day moving average at 7348.60.
The trade through 7288.34 has put the main bottom at 7237.85 at risk. If selling pressure continues through that level, it could put the long-term retracement zone at 7080.72 to 6900.46 on the radar.
Recovering and holding above the 200-day moving average could weaken my bearish outlook and produce a rebound. My bias will change to up when buyers take out the swing top at 7715.57.
Nasdaq Composite
My bias is to the downside because the main trend is down on the daily swing chart and the index is trading on the weak side of the 200-day moving average at 25159.64.
I’ll be watching trader reaction to the 50% level at 24206.50 to determine my conviction to the downside. A strong rebound rally could develop from this level, making the 200-day moving average a potential target. However, a sustained move under the 50% level will encourage me to set my sights on the long-term 61.8% level at 23376.67.
Dow Jones Industrial Average
My bias is to the downside because of the downtrend on the main swing chart and the trade below the 200-day moving average at 50782.38. The Dow is testing the long-term retracement zone at 49900.80 to 48757.73. A sustained move under 49900.80 could put the lower or 61.8% level at 48757.73 on the radar.
I’ll monitor the price action inside this zone because it could produce a strong technical bounce. This is the area that will likely decide if investors are looking for value or for further downside pressure.
Recovering and holding above the 200-day moving average will weaken my bearish outlook somewhat because it could create the momentum needed to retest the 50-day moving average at 51808.08, which could be the gateway to the start of another rally.
More Information in our Economic Calendar.