


Gridlock Bets Drive Stocks Higher
The major stock index futures are holding on to their huge gains late Wednesday as President Trump accepted the election results and the strong gains by Democrats in yesterday’s midterm elections helped attract aggressive buyers.
With Democrats now controlling the House and Senate and Republicans retaining the White House, investors may be looking for gridlock in Washington. This could mean fewer policy changes and less uncertainty that could produce bouts of unexpected volatility.
At 19:30 GMT, the Dow is up 2.9%. The S&P 500 is higher by 1.8% and the Nasdaq Composite has gained about 1.9%.
Lower crude oil prices continued to support the market as part of the bullish price action was generated by hopes for lower future inflation and fewer rate hikes by the Federal Reserve. Earlier in the day, many political pundits cited high energy prices and stubborn inflation as factors behind some of the recent uncertainty in the market.
Wednesday’s performance by individual stocks reflected a belief that consumer and healthcare stocks would benefit greatly from the new political landscape, while AI build-out stocks may face some headwinds.
Ahead of Thursday’s opening, it’s very important that the major indexes finish near their highs of the session. This could give investors an incentive to continue to buy at Thursday’s opening.
Daily Dow Jones Industrial Average Technical Analysis
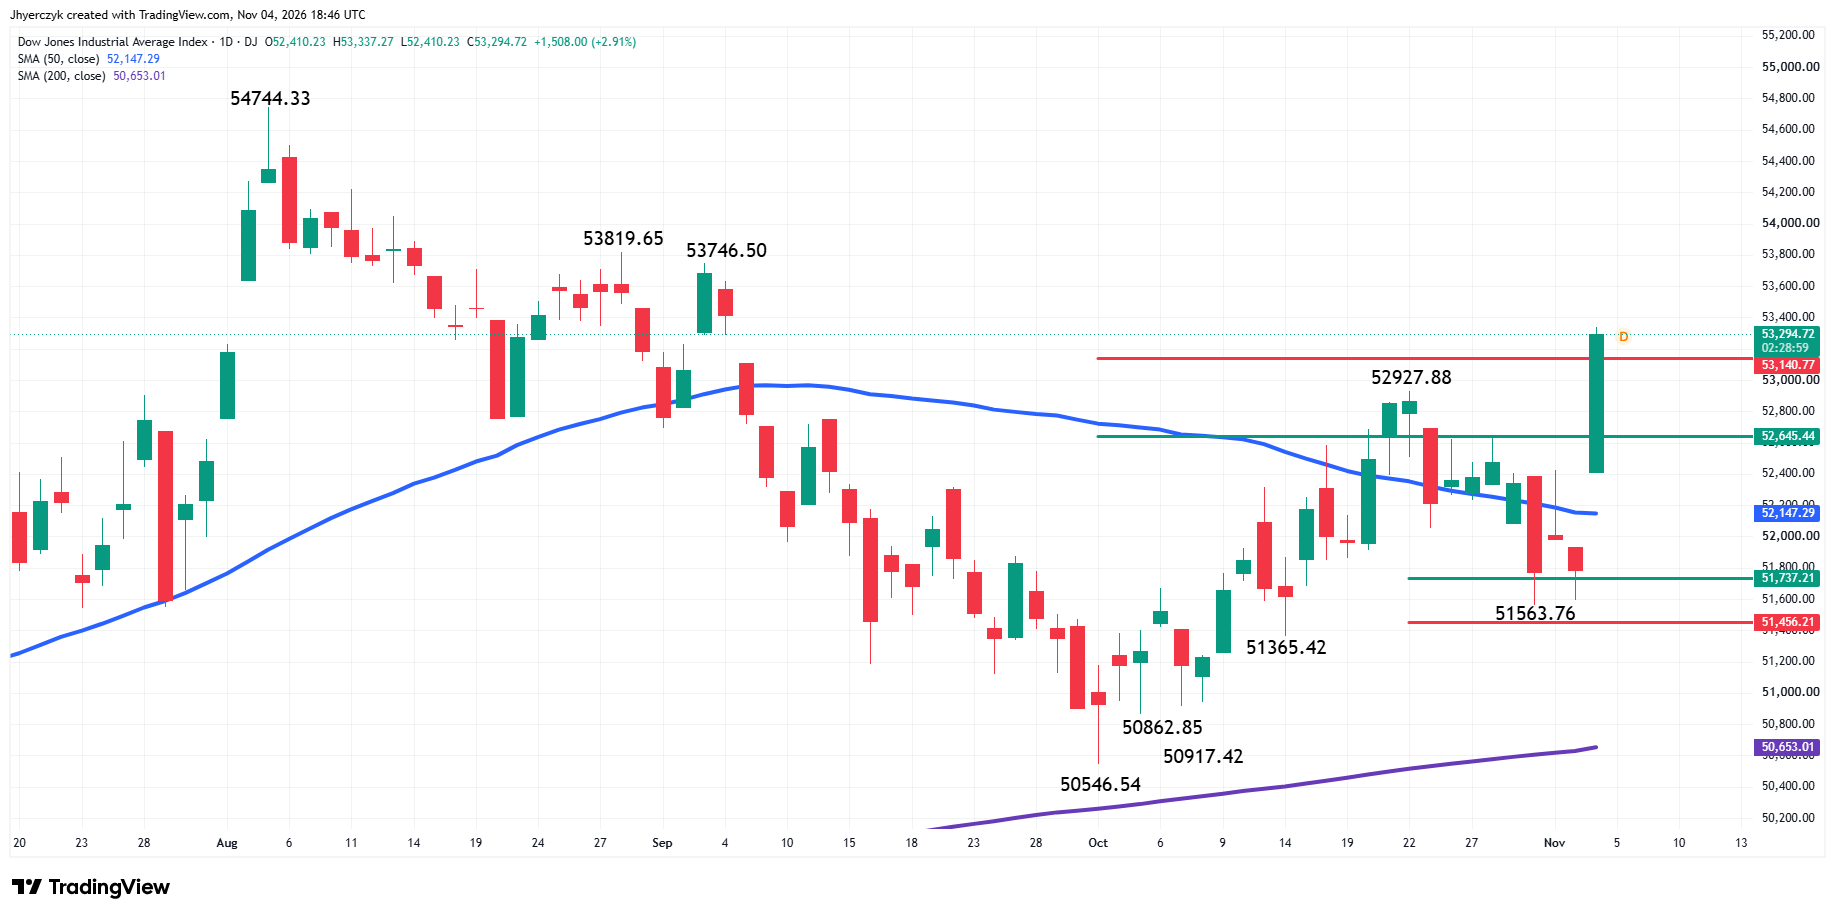
The Dow Jones Industrial Average continues to impress shortly after the mid-session on Wednesday. The main and minor trends are up, and the market is trading on the strong side of a major moving average. Not only that, but it gapped to the strong side of the 50-day moving average.
The main trend turned up on Wednesday after overcoming the swing top at 52927.88. A trade through 51563.76 will change the main trend to down. The minor trend is also up. It turned up when buyers took out the minor swing top at 52424.91.
At the opening, the cash market Dow crossed to the bullish side of the 50-day moving average at 52147.29, turning this trend indicator into support.
The intermediate range is 54744.33 to 50546.54. Currently, the Dow is trading on the strong side of its retracement zone at 53140.77 to 52645.44. The zone formed by these two retracement levels is support.
Dow Jones Price Forecast
Every new Dow Jones analysis as it publishes, today's technical signal and key levels, live price — on one page.
See all Dow Jones forecastsDaily S&P 500 Index (SPX) Technical Analysis
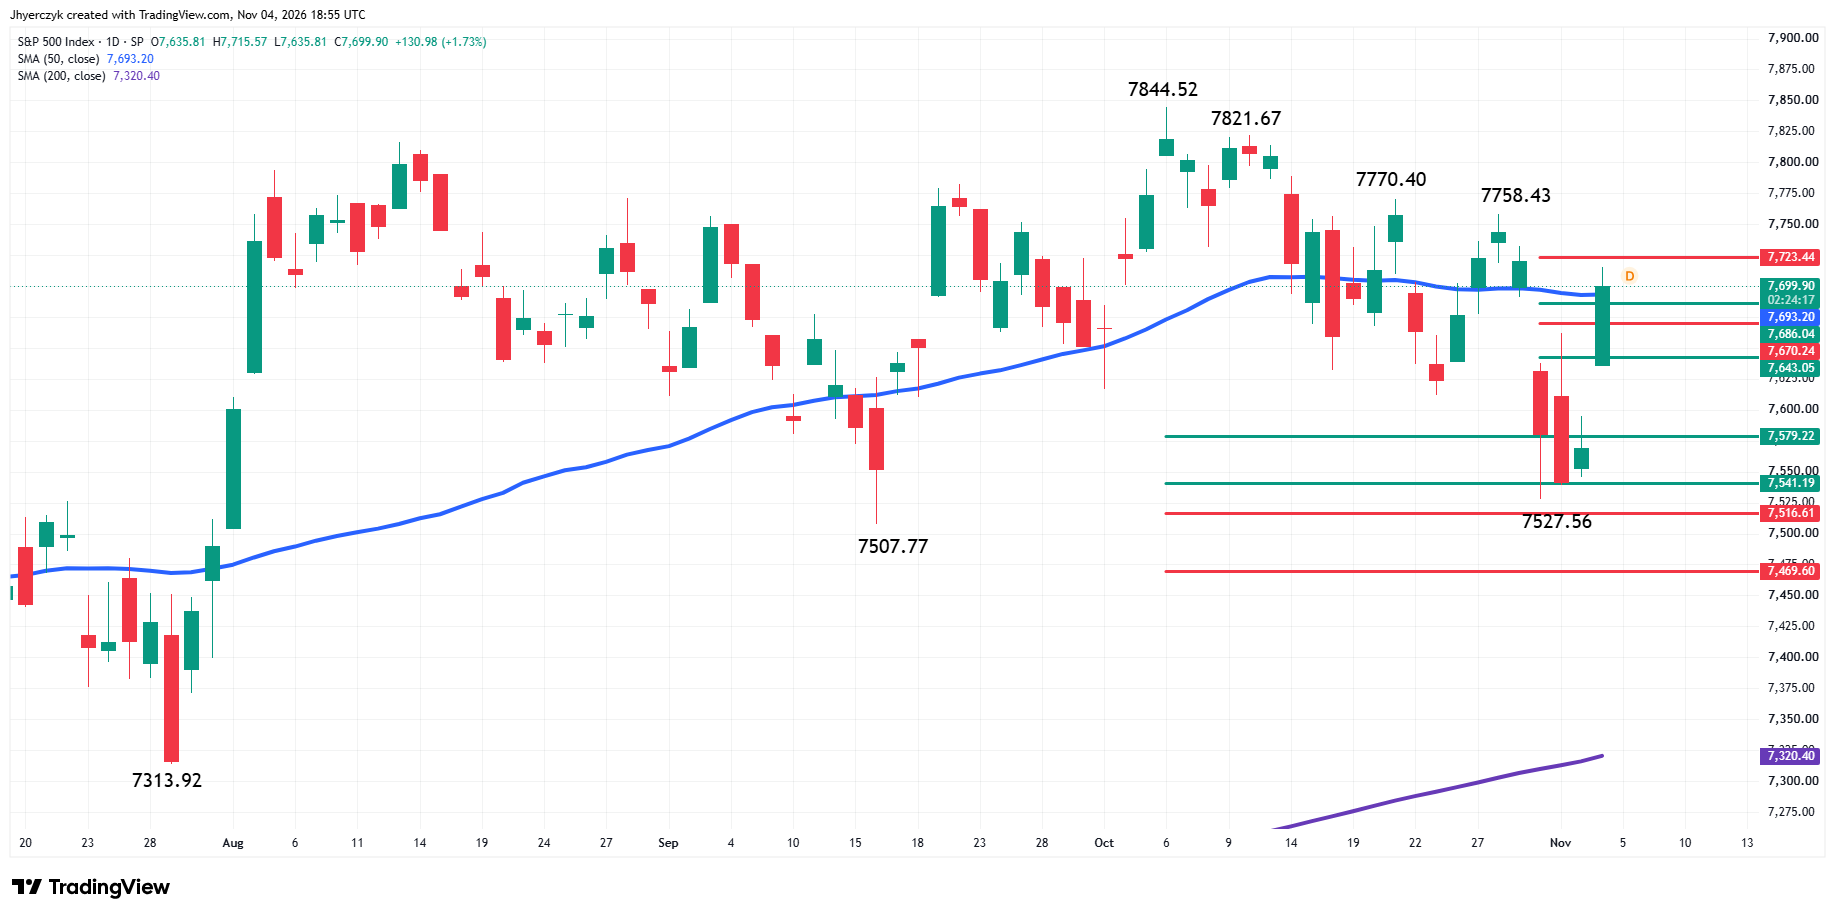
The S&P 500 Index continues to hold on to its nearly 2% gains late Wednesday as traders deal with the 50-day moving average at 7693.20. A close over this indicator will put the benchmark index in a strong position heading into Thursday’s session.
The main trend is down according to the daily swing chart. A trade over 7758.43 will change the main trend to up. A move through 7527.56 will signal a resumption of the downtrend.
After finding support inside an area formed by a pair of retracement zones at 7579.22 to 7516.61 and 7541.19 to 7469.60, momentum turned to the upside with the gap-higher opening. Buyers are now dealing with the retracement zone at 7686.04 to 7723.44. Overtaking the upper, or 61.8%, level could encourage buyers to take a run at 7758.43, with a potential breakout and change in trend to up.
What to Watch
Daily Dow Jones Industrial Average
My bias changed to bullish at the opening when the Dow crossed to the bullish side of the 50-day moving average. My outlook grew stronger as buyers recaptured the intermediate retracement zone at 52645.44 to 53140.77. Turning this zone into support will indicate that traders are buying with conviction.
Holding 53140.77 could also lead to a surge into the pair of main tops at 53746.50 and 53819.65. The latter is a potential trigger point for an acceleration into the all-time high at 54744.33.
If this was just a knee-jerk reaction to the midterm results, then the first sign of weakness would be a sustained break under the 61.8% level at 53140.77. Crossing to the weak side of the 50% level at 52645.44 would be the next. That leaves the 50-day moving average at 52147.29. If this fails, then look for a retest of the 51737.21 to 51456.21 retracement zone that helped launch the current rally from Monday’s low at 51563.76.
Daily S&P 500 Index
Although I’m impressed with the momentum, it has to be strong enough to overcome the 50-day moving average at 7693.20 to shift my bias to the upside. If the buying dries up and sellers resume their pressure, then look for a pullback into 7579.22 to 7469.60 over the near-term. If this area fails, then look for an acceleration to the downside with the 200-day moving average at 7320.40 the next major target.
A sustained move over the 50-day moving average will only work if buyers continue to buy strength and take out offers.
More Information in our Economic Calendar.