


The Dow Jones Industrial Average gained 1.67% last week but remains in wide consolidation in the short term. The risk to the Dow Jones in the short term comes from the Trump remarks about more tariffs on Mexican goods. US consumer inflation was hot, but US producer prices increased less than expected in October. But the annual producer inflation increased to 6.5%. The high inflation environment keeps expectations high for the rate hike in December. The US Treasury yields continue to rally above 5% which may limit the rallies in Dow Jones below 53,700 in the short term.
Trump’s Mexico Tariff Remarks Put Caterpillar in Focus
President Trump said that he may double tariffs on Mexican goods if the Mexico failed to stop migrant caravans from reaching US border. But he did not mention the timing and scope of these tariffs.
The economy minister of Mexico said that the talks about trade continue and the US Treasury Secretary Scott Bessent said that he was optimistic about the deals with Mexico and Canada.
The latest statistics show that the US and Mexico traded around $779 billion of goods during the first nine months of 2026. Caterpillar continues to produce equipment and components in Mexico and accounts for nearly 7% of Dow.
If the tariffs increase further, it may squeeze the margins and affect the profitability of companies. Once these costs are passed on to consumers, it may affect new orders from consumers as consumers will think more before making new orders.
Dow Jones Price Forecast
Every new Dow Jones analysis as it publishes, today's technical signal and key levels, live price — on one page.
See all Dow Jones forecastsU.S. Inflation and Rising Treasury Yields Test the Dow Jones Rally
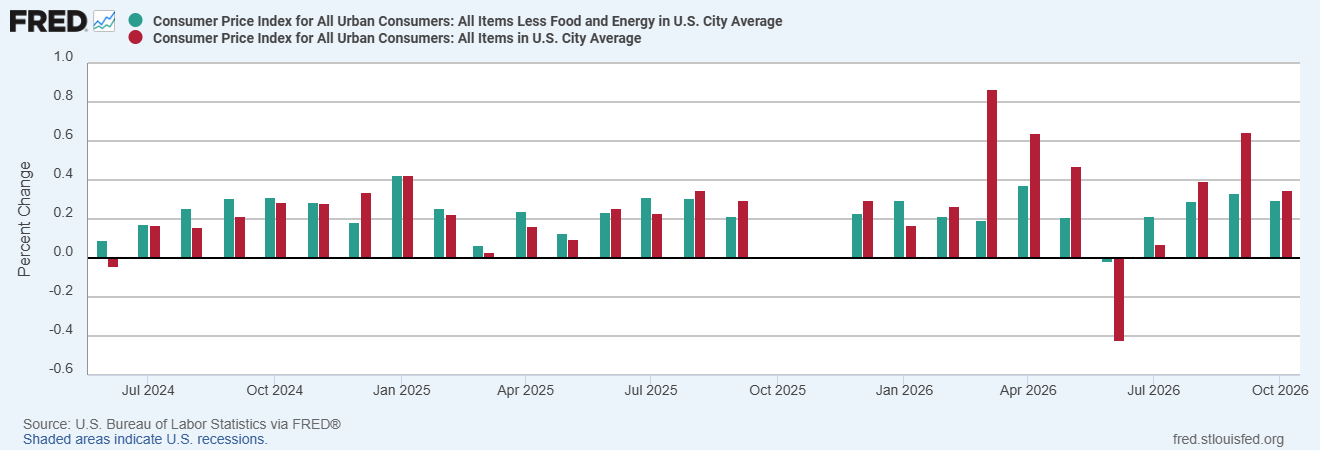
Inflation in the US remains hot. The chart below shows that the headline CPI increased 0.35% in October, which is higher than the forecast of 0.3%. The core CPI also increased by 0.3%, which is above the forecast of 0.2%.
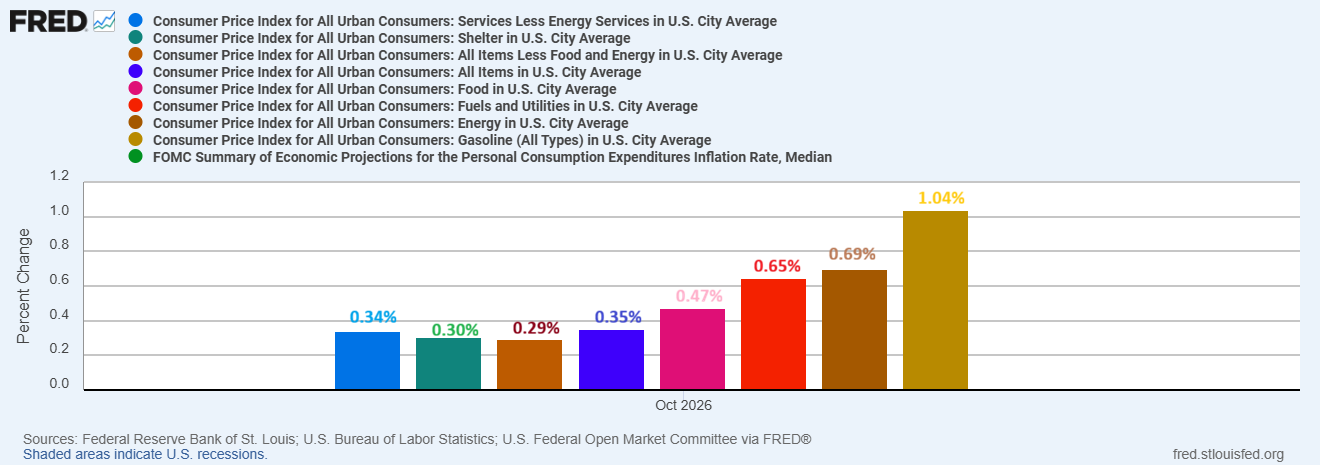
The high fuel prices are spreading across the economy beyond energy and food. The chart below shows that inflation in services, shelter, core, food, heating fuel and utilities and energy continues to increase.
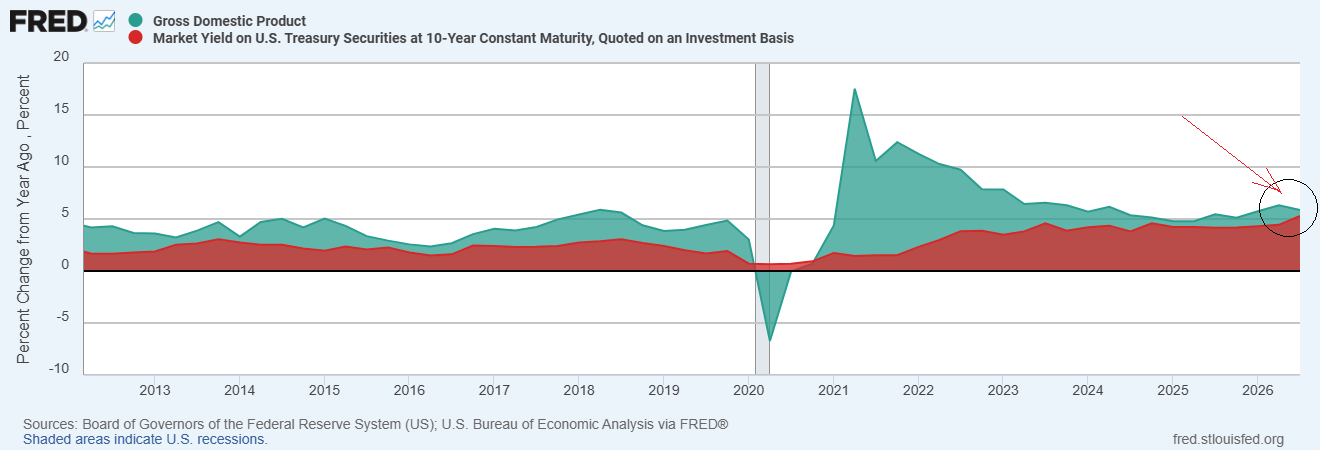
The chart below shows that the 10-year US Treasury yields may continue to increase and converge with nominal GDP growth which grew by 5.9% to September. In my view, GDP will likely remain strong due to heavy AI spending and the 10-year Treasury yields will continue to increase due to the high inflation environment.
U.S. Producer Inflation Hits 6.5% as December Rate Hike Bets Persist
The chart below shows that the US producer price index increased to 0.3% in October which is below the forecast of 0.4%. The Bureau of Labor Statistics revised the data for September up to 1.4%.
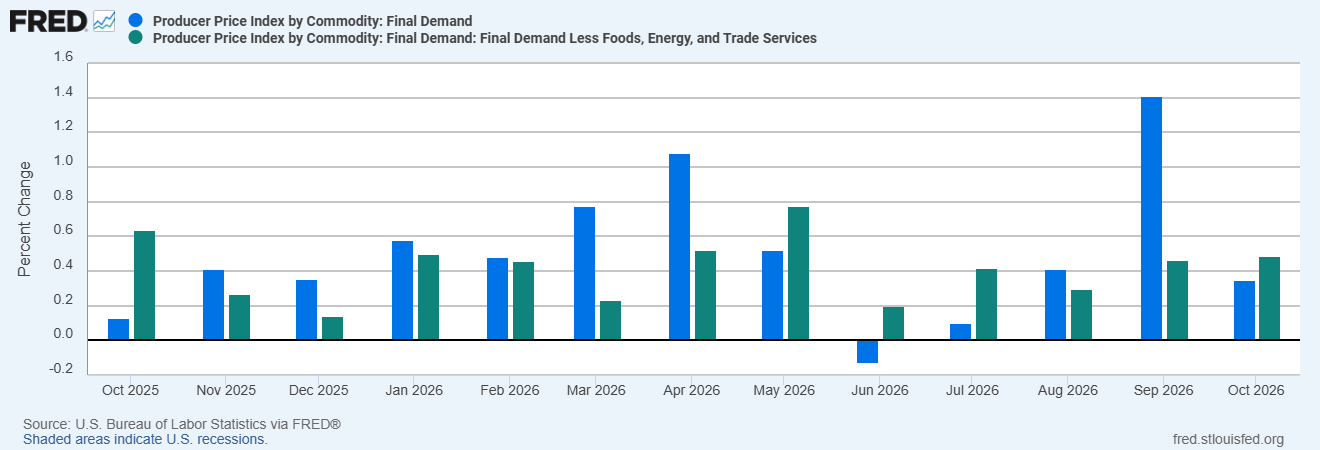
The annual producer inflation increased to 6.5% in October from 6.3%, which is the fastest pace since November 2022.
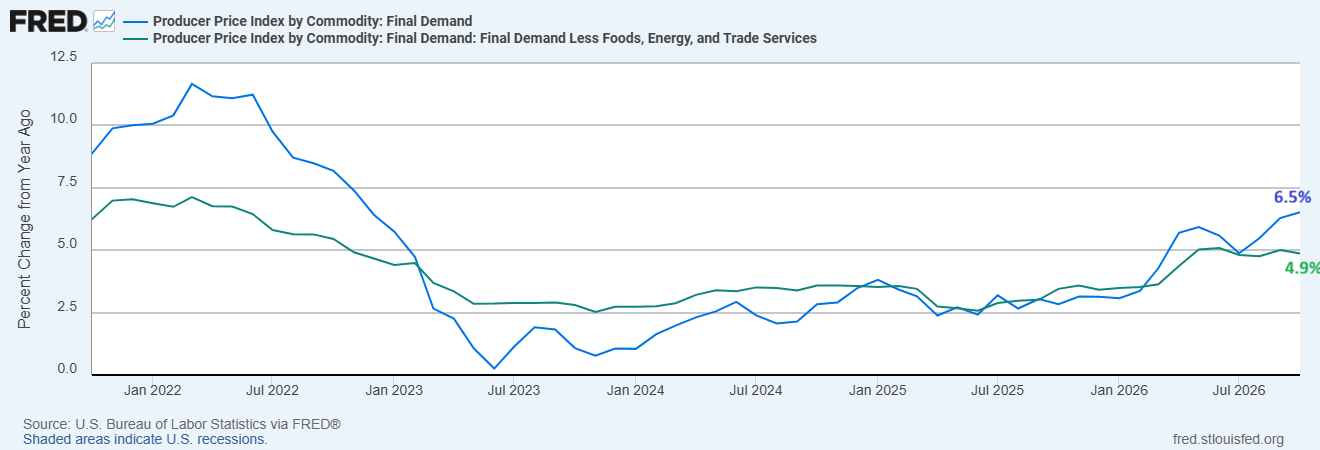
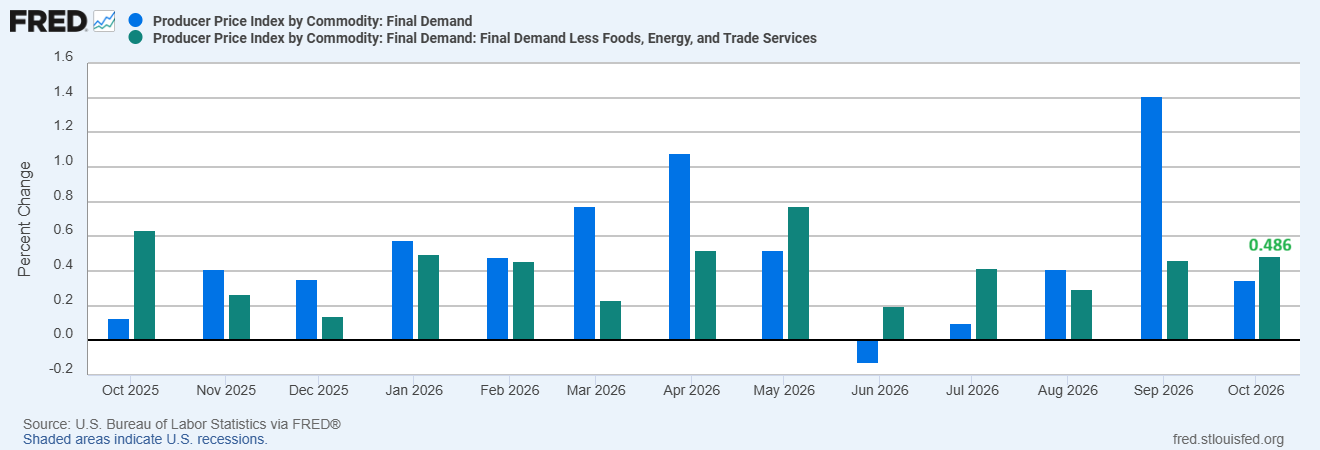
On the other hand, the core PPI increased 0.3% on monthly basis and 4.9% from the year earlier. The data excluding trade services also increased 0.5% for the second straight month in October.
The Dow Jones moved slightly higher after the US PPI data but reversed most of the gains to close the day at lower levels. The US Treasury yields increased to 5.17% and gained significantly last week. The US dollar also gained strength on the strong inflation data from the US.
The high inflation environment keeps the expectations of a rate hike in December. The high cost of borrowing delays the big renovation projects and limits rallies in stocks.
U.S. Retail Sales and Nvidia Earnings Are Next for the Dow
The data from the US retail sales will be released on Tuesday, November 17. The earnings from Home Depot, Inc. (HD) and Nvidia Corp. (NVDA) will also be released on November 17 while the earnings from Walmart Inc. (WMT) will be released on Thursday.
The Fed will also release the October meeting minutes on Wednesday. The data from the earnings of Home Depot and Walmart will help to understand the impact of higher prices on household spending. Moreover, the outlook for Nvidia will provide investors a fresh understanding of AI chip demand after the major leadership change in the company.
Dow Jones Technical Analysis and Key Price Levels
Dow Jones Weekly Outlook Hinges on 50,000 Support
From a technical perspective, the Dow Jones has been consolidating above the 50,000 area and shows a constructive outlook in the long term. The weekly chart shows that the Dow Jones formed the inverted head and shoulders pattern from November 2021 to November 2023. The breakout above the neckline of this pattern in November 2023 triggered the strong surge in Dow Jones.
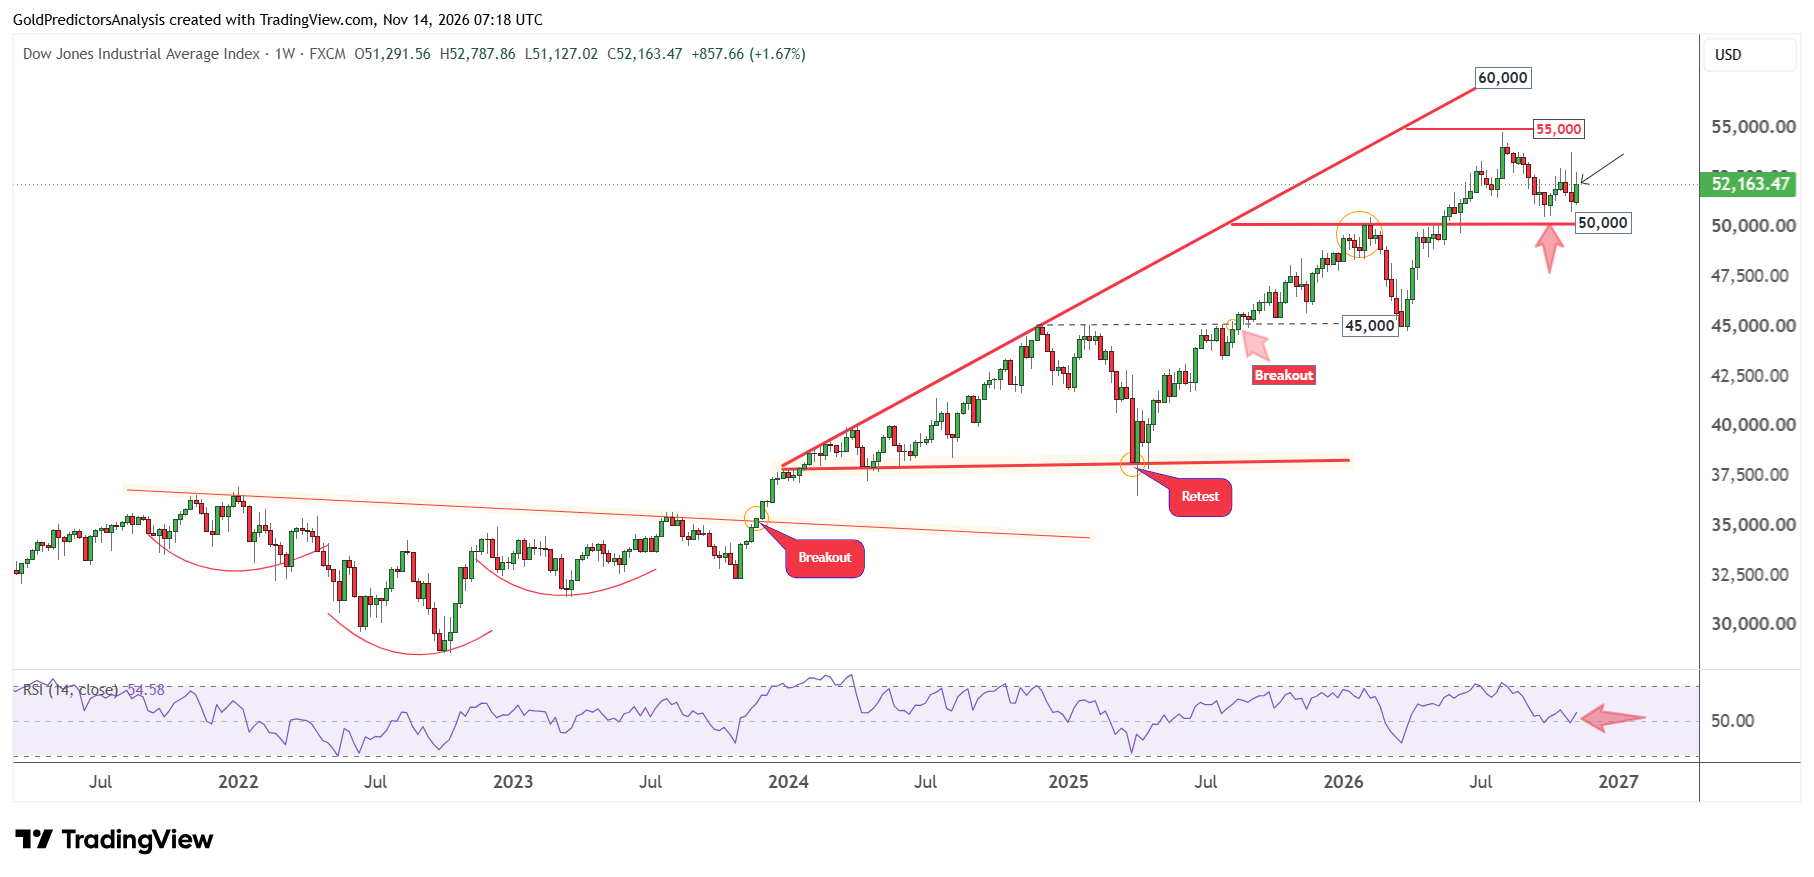
The index has now formed ascending broadening wedge pattern that extends from January 2024 to the record high. This suggests that the volatility in the Dow Jones remains high. The index formed basing pattern near 37,000, which triggered a strong surge to a record high of 54,778. The index is now consolidating between 50,000 and 55,000 as it looks for the next direction.
The Dow Jones gained 1.67% last week but the previous weekly candle was slightly negative and had long shadows. This suggests that the index may rally towards the 55,000 level if it holds above the 50,000 area. The break below the 50,000 level will likely open the way for further downside towards the 45,000 region. A break above the 55,000 level will trigger strong rally towards the 60,000 level.
53,700 Is the Dow’s Next Breakout Level
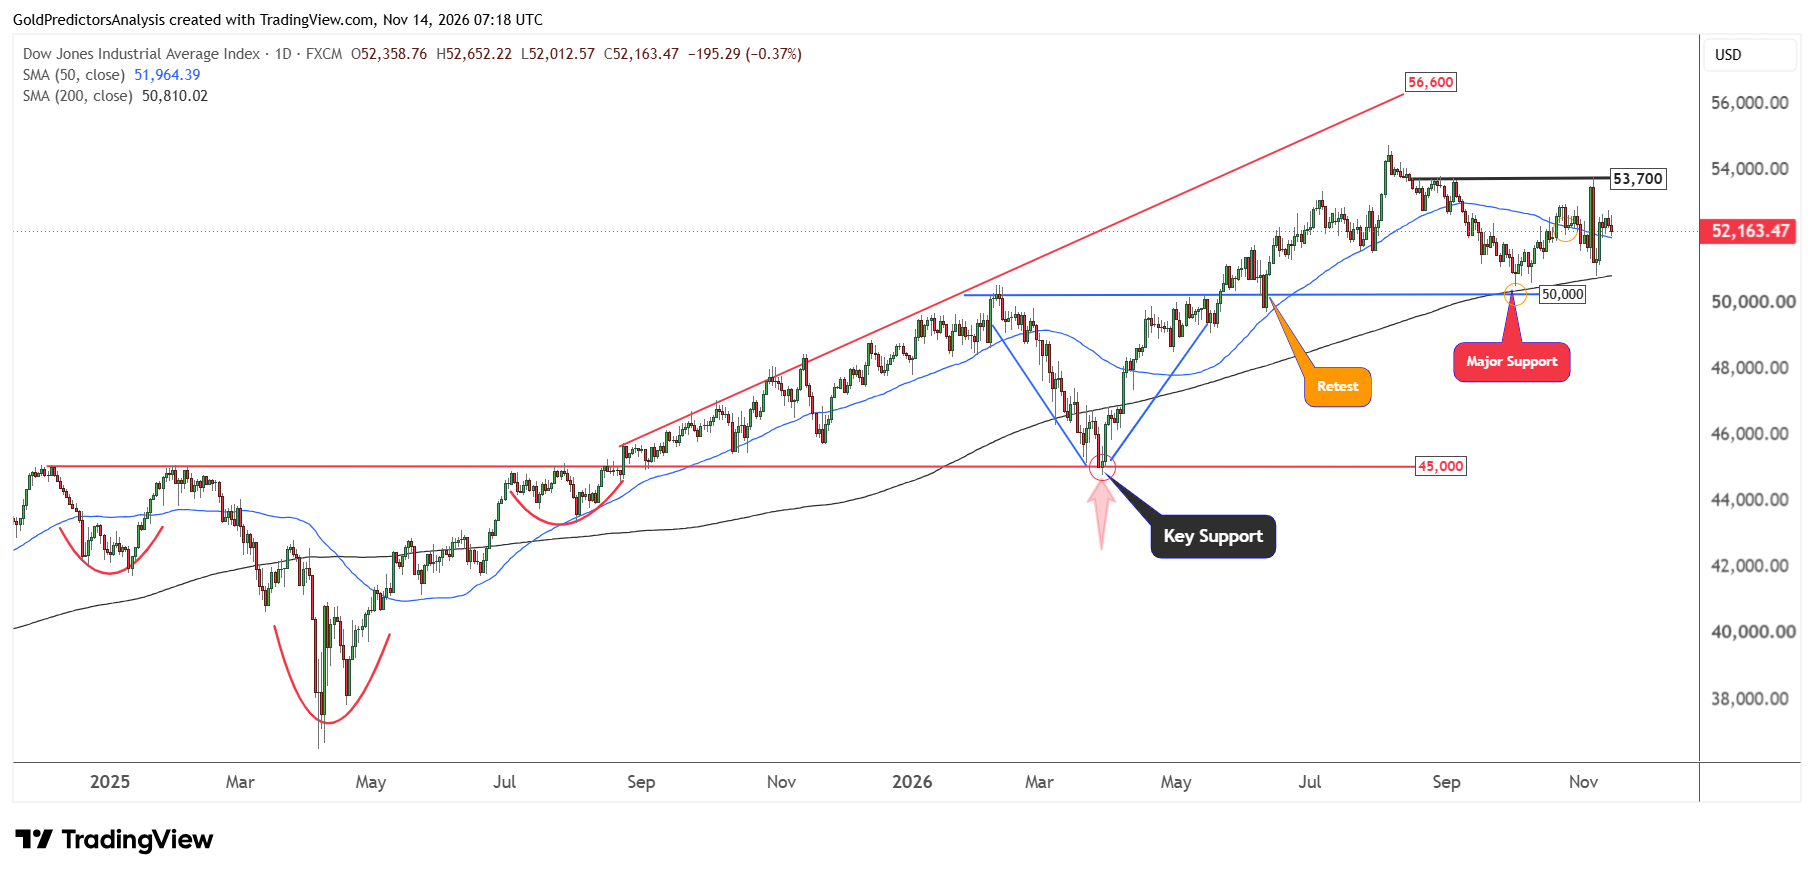
The strong consolidation in the Dow Jones is also visible on the daily chart which shows the formation of the inverted head and shoulders pattern from December 2024 to August 2025. The neckline of this pattern now provides base near 45,000. The index has strong support at the 50,000 level near the 200-day SMA.
The positive movements in the index during the last week have pushed the index above the 50-day SMA. The key resistance for the index on daily chart remains at 53,700. The index must hold 50,000 to increase the possibility of an upside breakout above 53,700. A break above 53,700 may open the way higher for 55,000 and 57,000.
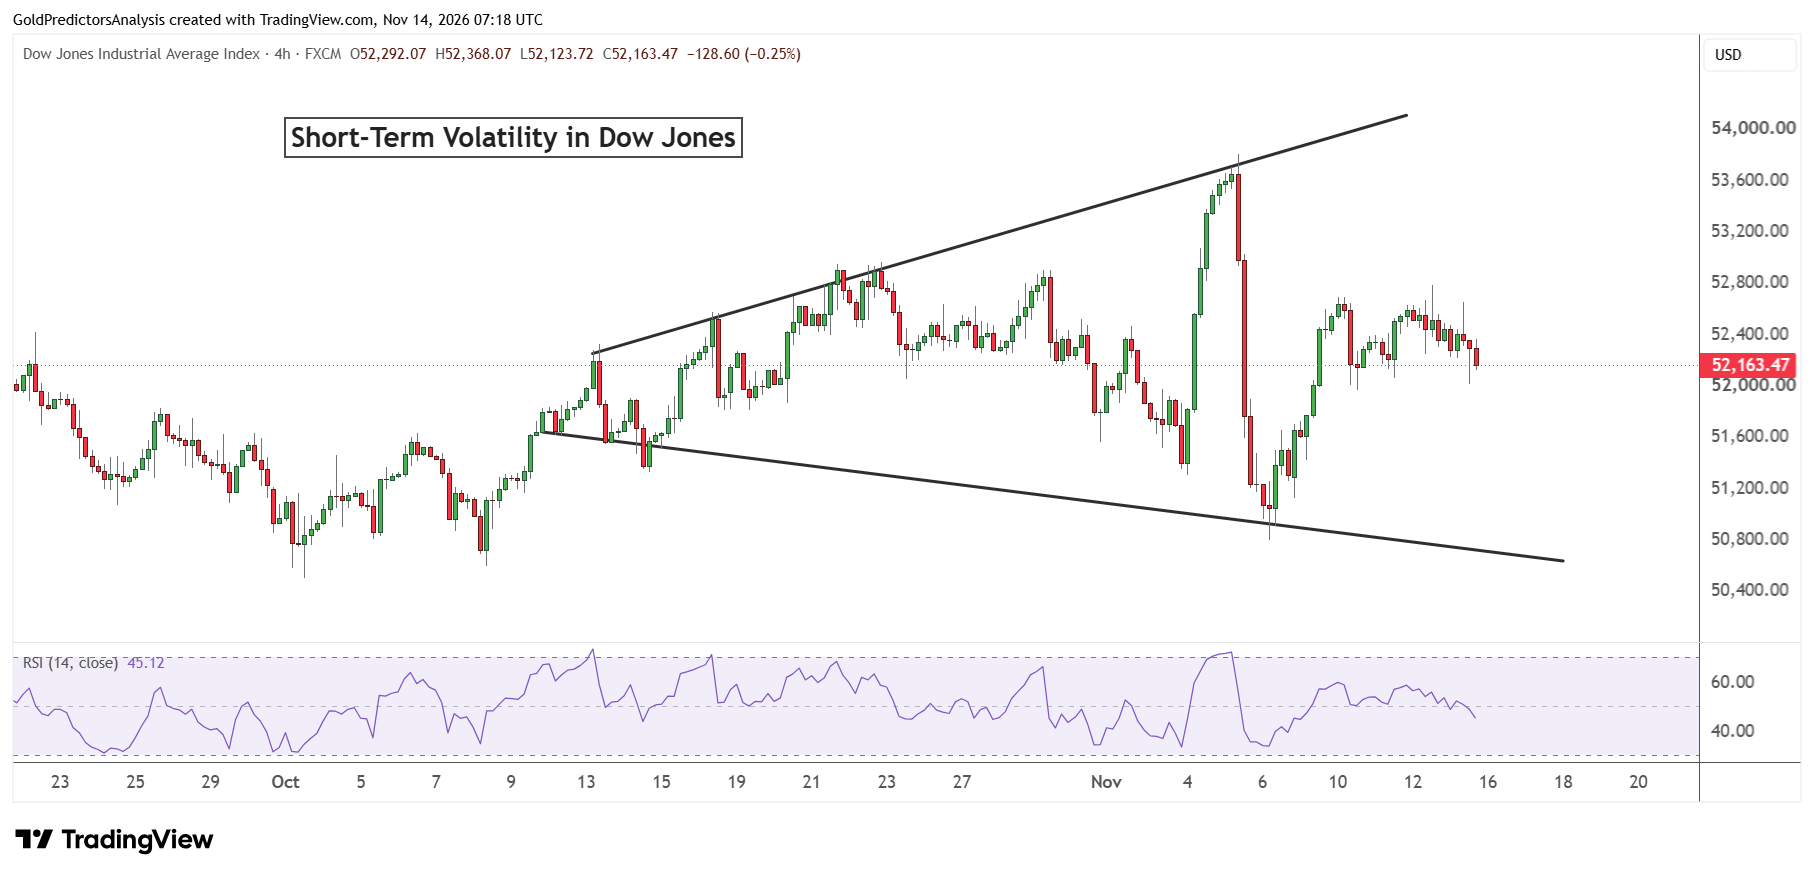
The 4-hour chart for Dow Jones also shows the heavy volatility. The chart shows that the price is forming the symmetrical broadening wedge pattern which shows that the trading range is widening over time. This wedge shows the support in the Dow Jones near 50,700, while the resistance is at 54,500.
A drop in the index within this wedge may provide support to rally toward 54,700. The RSI on the 4-hour chart has also remained between the 30 and 70 levels for the past 2 months which shows the wide swing in the short term.
Can the Dow Jones Rally Towards 55,000?
The rebound in Dow Jones from the key support near 50,000 faces new test of Trump’s remarks about the double tariffs on Mexican goods. The high duties may squeeze margins for companies. When these companies pass the costs to consumers by raising prices, it may affect consumer sentiment. This may cause customers to delay new orders due to high costs. If there is any progress made toward the trade talks, that may ease those concerns.
US producer prices increased less than expected in October, but annual producer inflation increased to 6.5%, which keeps expectations for a rate hike in December. The high US Treasury yields may also limit the rallies in Dow Jones. The weak retail sales data from US and earnings results from Home Depot and Walmart may indicate household spending patterns during high inflation.
A break below 50,000 may trigger deeper correction to the long-term support of 45,000. But a break above 53,700 may open the way for a rally towards 55,000. A break above 55,000 will suggest another strong rally toward the 60,000 zone.
Read more: Strong Jobs Data Tests Rebound After AI Rout