


The sharp selloff in the technology stocks pushed investors towards bonds and eased the expectations for further rate hikes. The market still expects a 68% probability of a rate hike by the Fed in December as per the FedWatch tool. But the market is now waiting for the US jobs and wage data on Friday. The strong hiring and faster wage growth may support the US dollar and continue to pressure gold (XAU) prices. On the other hand, the weak jobs data may ease the rate hike concerns and support precious metals.
Silver (XAG) is weaker than gold as investors continue to sell technology stocks, which puts pressure on industrial metals. The concerns about industrial demand limit the recovery in silver.
The risk in precious metals is also coming from oil prices. The oil price rebounded on Thursday as the uncertainty over the Iran conflict returned. Iran’s Revolutionary Guards reported fires that involved two tankers and tugboat in the Strait of Hormuz. The rally in oil prices may introduce fears of inflation and strengthen the case for higher interest rates.
Gold Price Forecast: Recovery Faces $4,150 Resistance
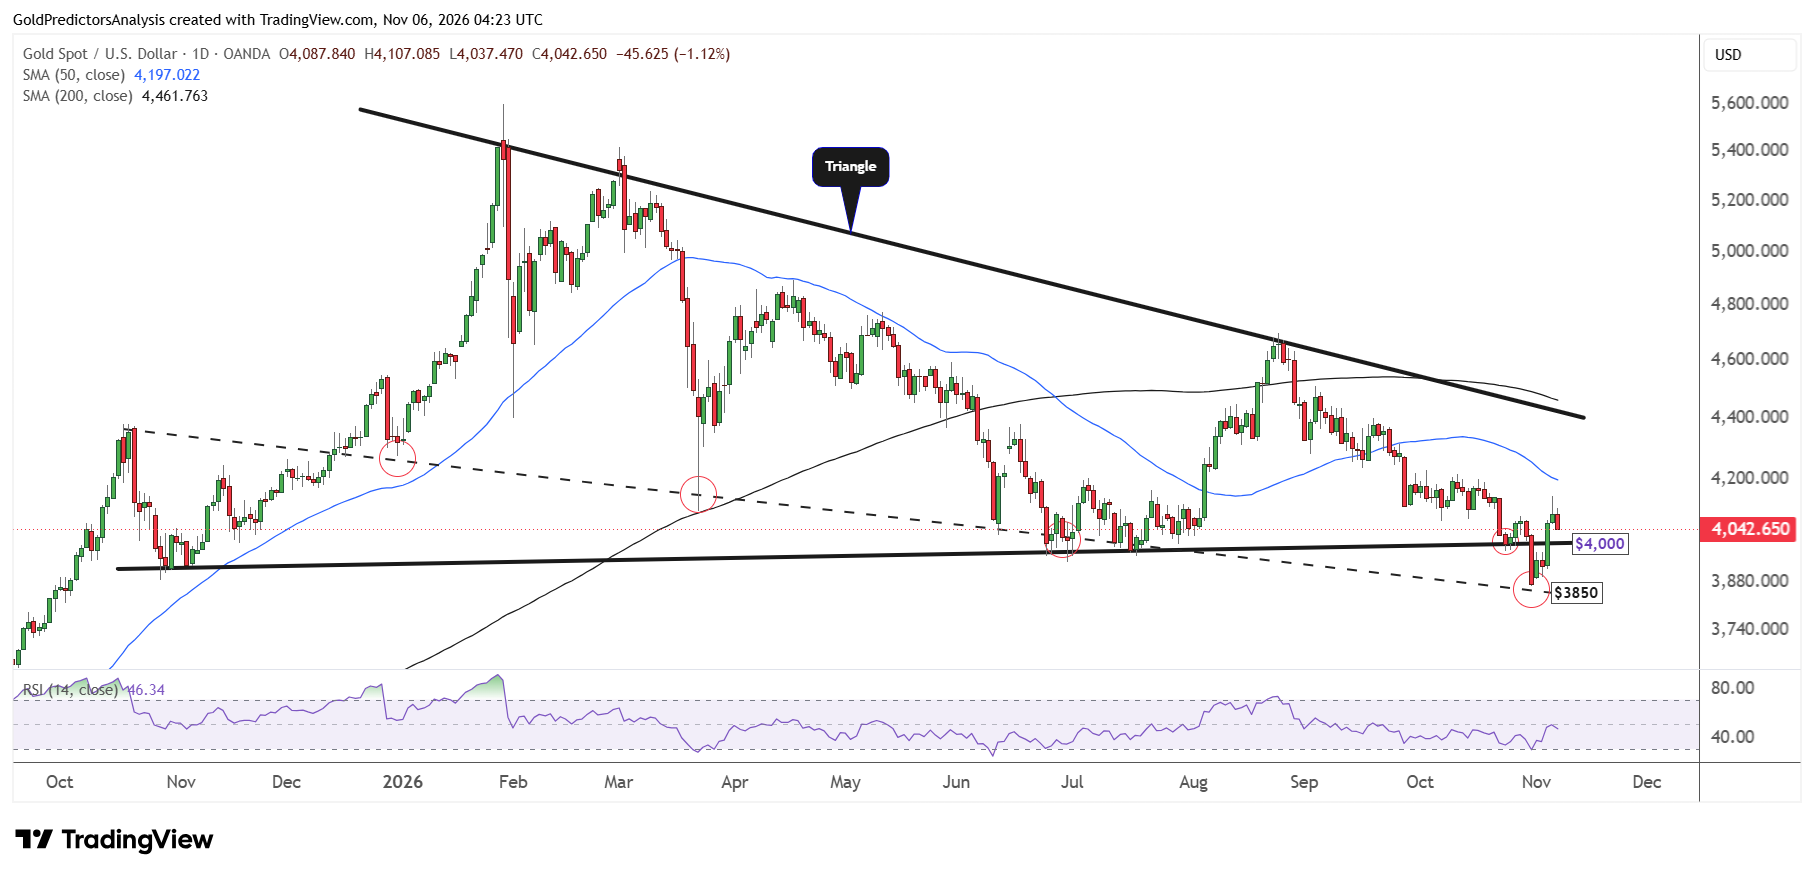
The daily chart for spot gold shows that the price has recovered above the $4,000 area after the strong drop last week. The price must close above the 50-day SMA to suggest strong recovery. But a break below $4,000 will likely open the way for further downside in the short term.
The rebound in gold was due to the extremely oversold conditions on the daily chart as seen by the RSI. The RSI has now reached midline as the price hit the $4,150 resistance area. A break above $4,150 will likely open the way for further upside toward 50-day SMA near the $4,200 level. But a break below the $4,000 level will likely push prices towards $3,850.
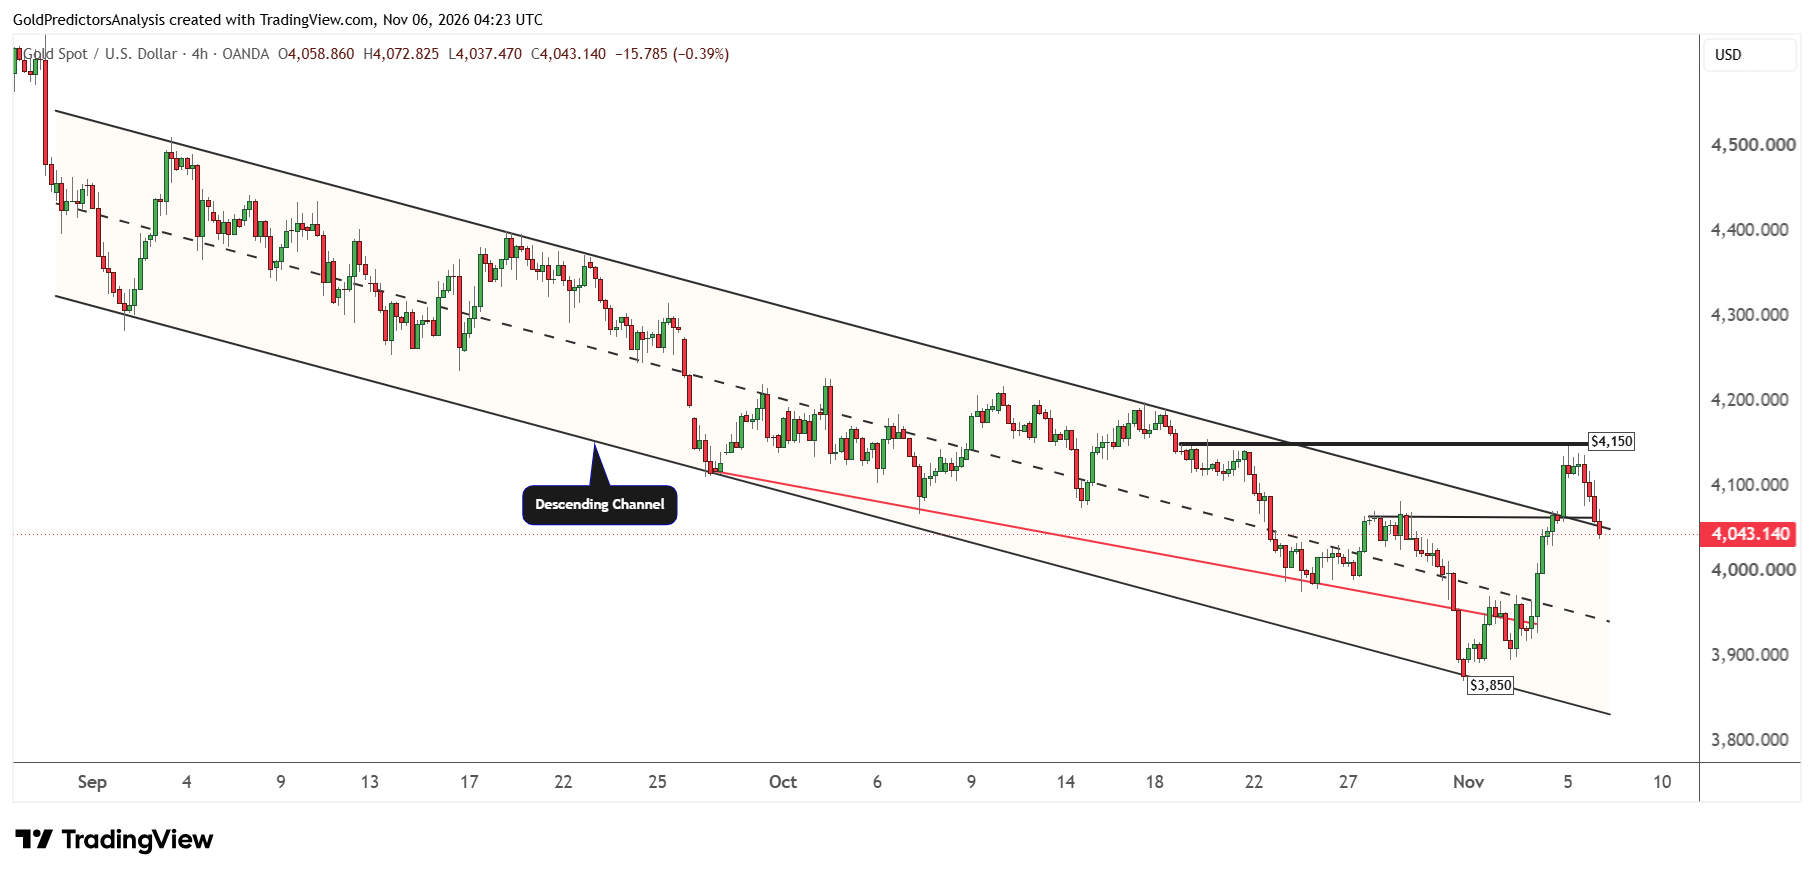
The 4-hour chart for spot gold shows that the price broke above the descending channel that stretches from the highs of September 2026. After the breakout, the price immediately hit resistance at $4,150 and is now correcting again towards the descending channel.
Gold Price Forecast
Every new Gold analysis as it publishes, today's technical signal and key levels, live price — on one page.
See all Gold forecastsSilver Price Forecast: Break Above $55 Could Open Path to $60
The daily chart for spot silver shows that the price has formed a triangle pattern from the highs of January 2026 and has hit strong long-term support at the $50 area. After hitting support, the price has rebounded back higher towards the $55-$56 level.
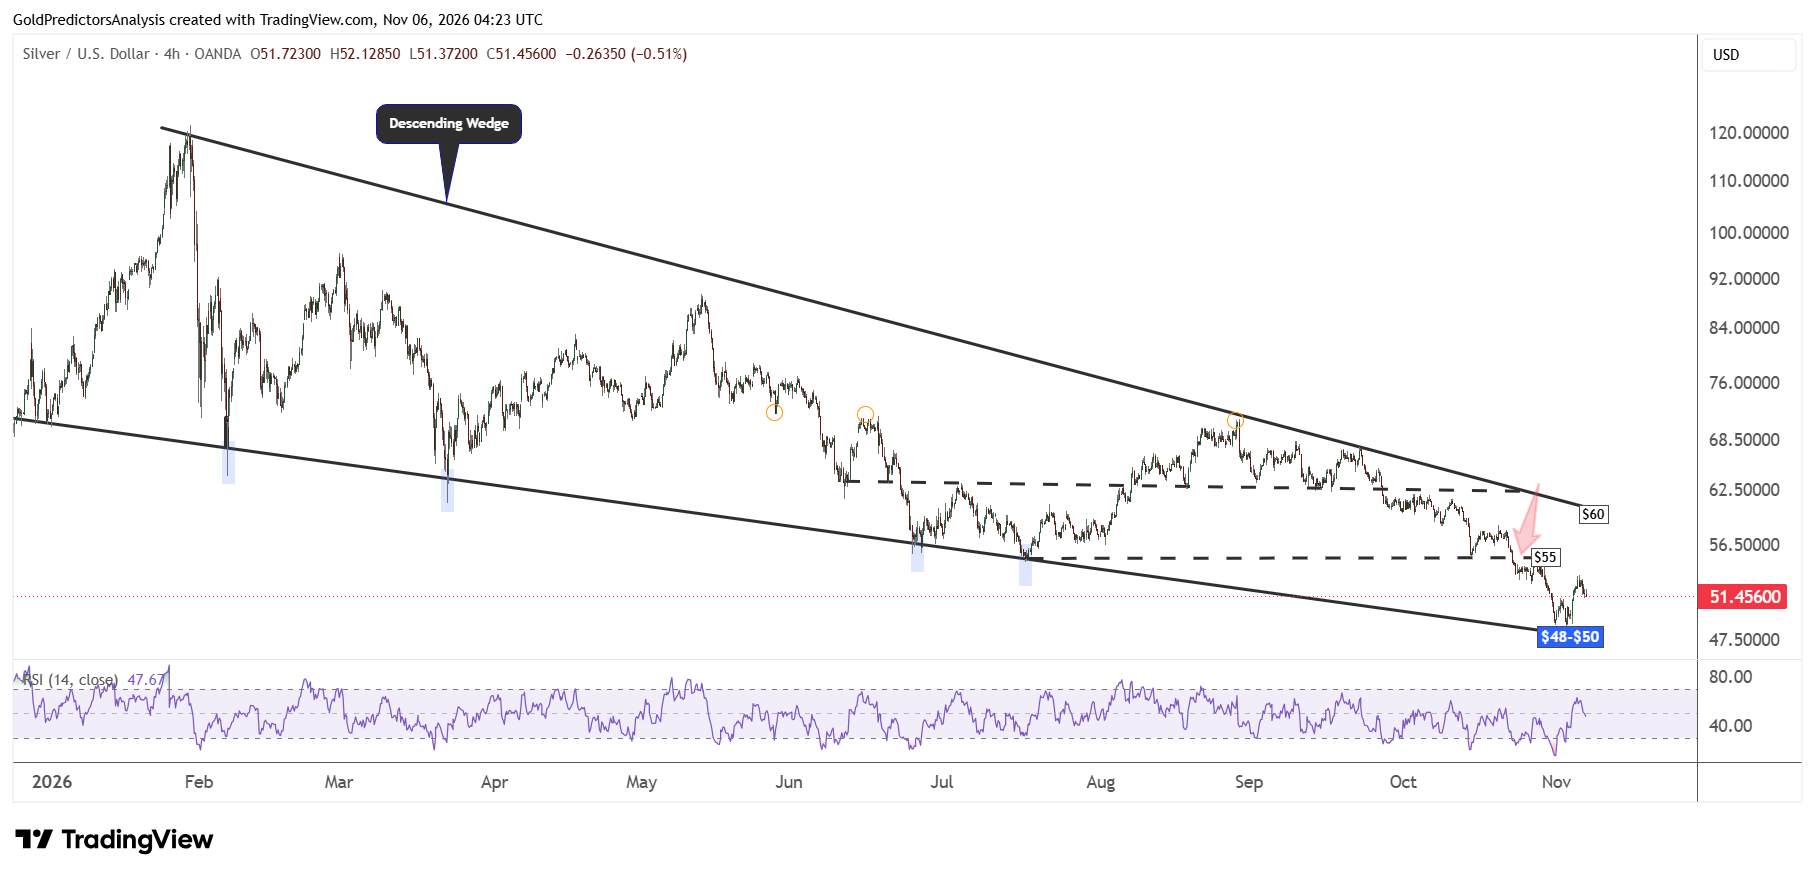
A break above $55 will likely push the price towards the 50-day SMA near the $60 area. The 50-day SMA now coincides with the resistance of the triangle pattern. Therefore, a break above $60 will likely open the way for further upside towards the $72 area.
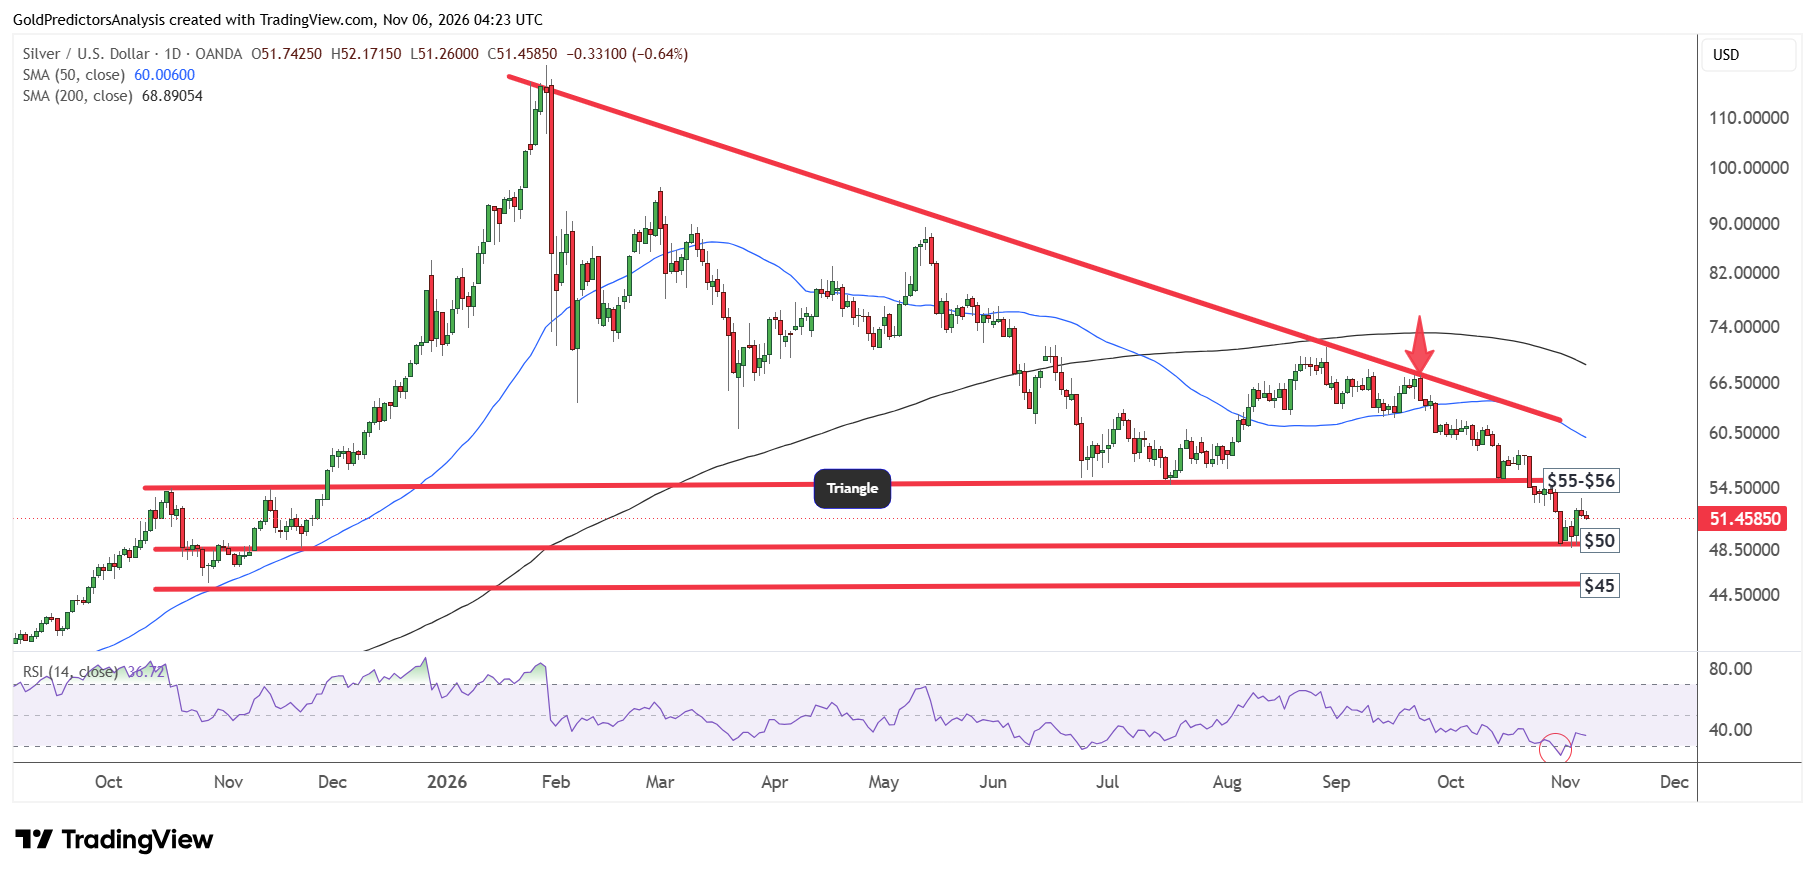
The rebound in silver prices is due to the extremely oversold conditions shown by the RSI. But the price must hold the $48-$50 region to protect against further downside toward the $45 area.
The 4-hour chart for spot silver shows the formation of descending wedge pattern. The price has hit support in the $48-$50 area as seen by the lower boundary of the wedge. The price now needs to break above $55 to push towards the resistance of the descending wedge near $60.
What to Watch Next
The market is watching for the US jobs data on Friday. Weak hiring and slow wage growth may ease fears of rate hike and support both metals. But the strong data may lift the US dollar and keep pressure on metals. The rebound in oil prices on Thursday may further fuel inflation concerns and keep gold and silver prices under pressure.
Gold needs to break $4,150 to push the price to $4,200. Silver needs to break the $55 level to open the way to the key level of $60. In my view, gold must hold $4,000 and silver must hold $48-$50 to keep the recovery in both metals in play.