



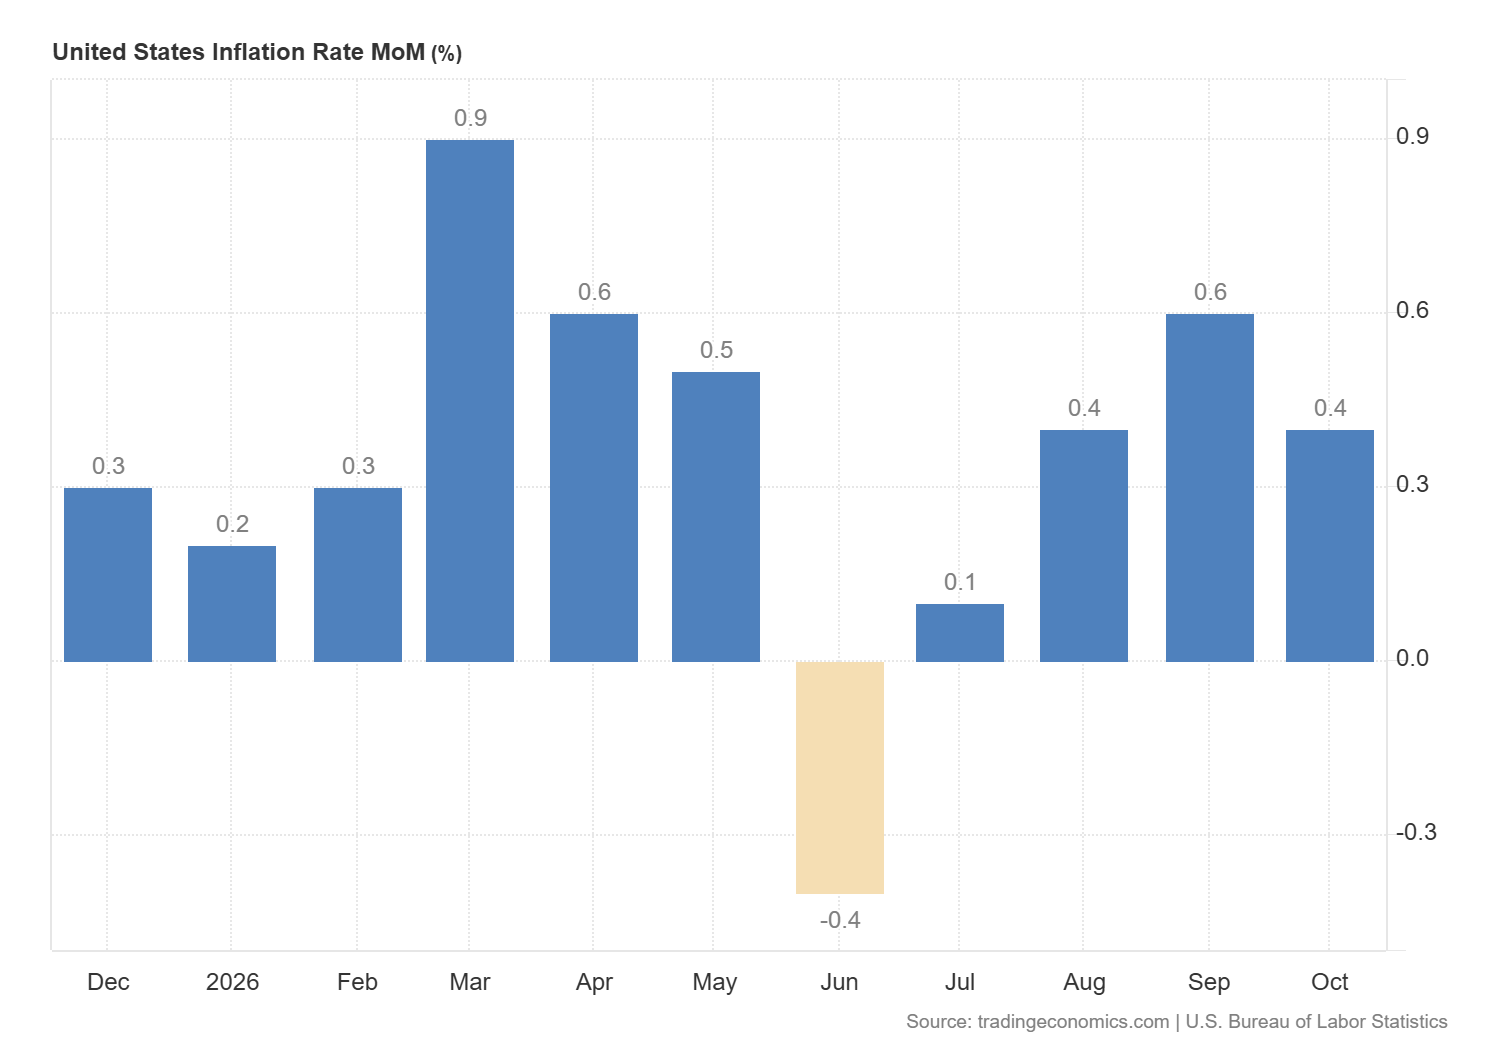
Gold (XAU) prices rebounded to $4,048 in early Asian trading on Wednesday after the sharp 2.61% drop on Tuesday. This drop in metals developed after the strong inflation data from the U.S. The chart below shows that U.S. consumer prices increased by 0.4% in October from September.
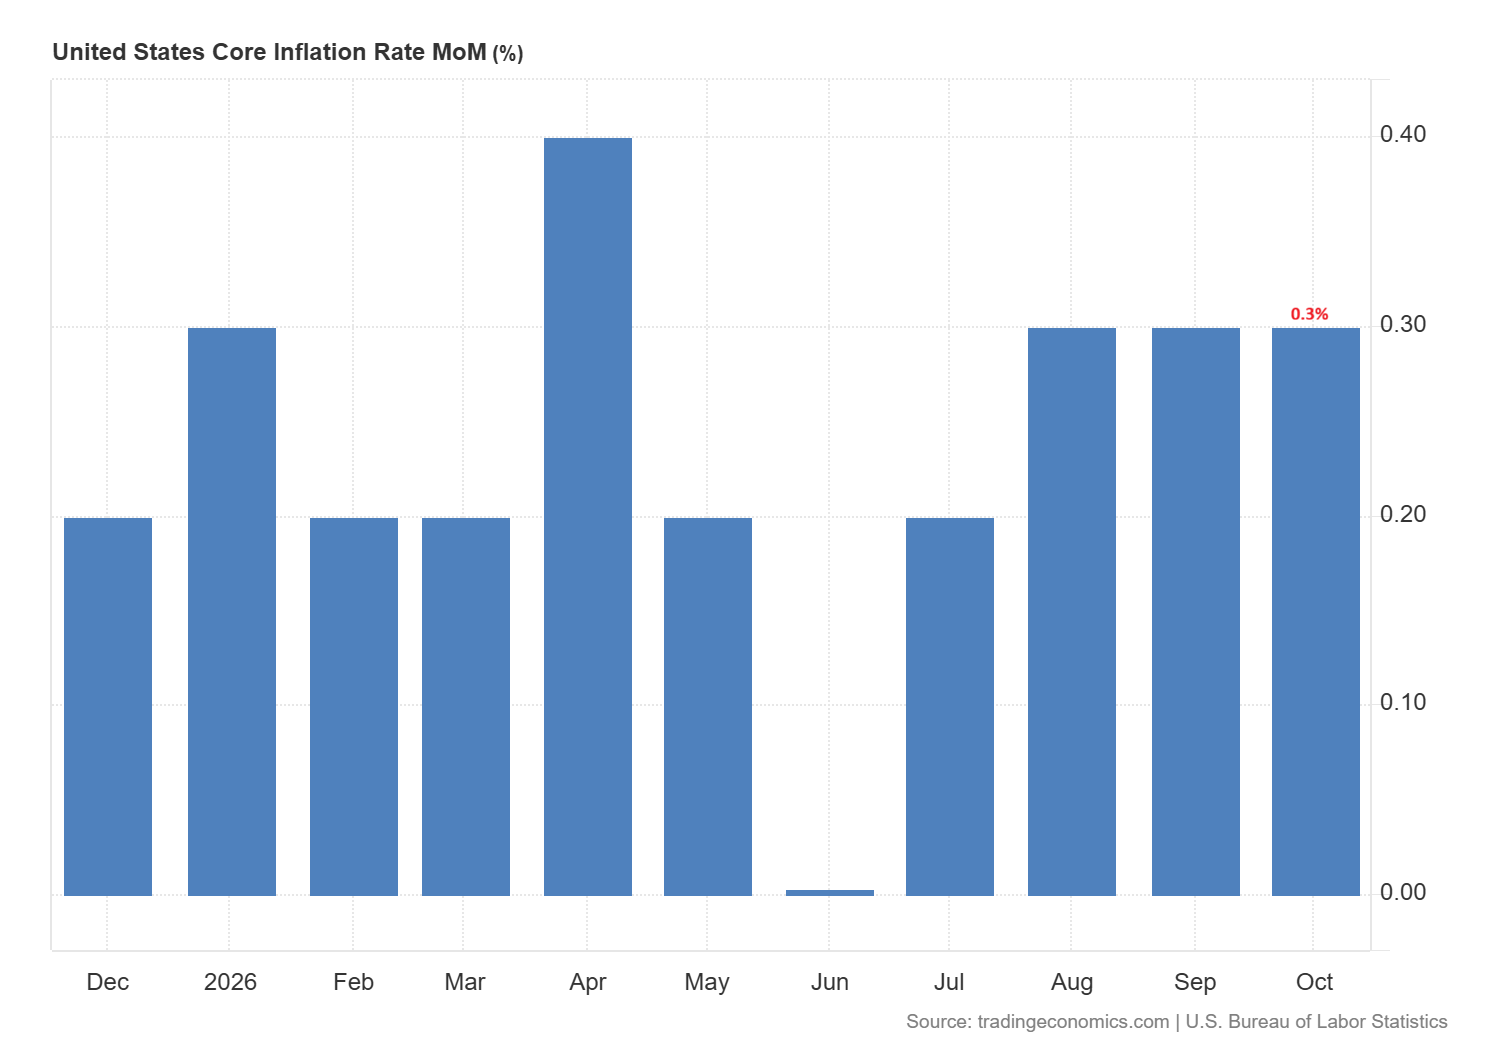
The core CPI increased by 0.3%.
The U.S. dollar gained momentum after the inflation data and gained 0.53% on Tuesday. The 10-year U.S. Treasury yield also rebounded after the inflation data and reached nearly 5% on Tuesday. The stronger U.S. dollar and higher Treasury yields kept gold prices under pressure. The market is now pricing in the probability of 90% of a Fed rate hike in December.
Silver (XAG) prices also rebounded to $52.45 on Wednesday after the sharp drop on Tuesday. The official manufacturing PMI from China dropped to 49.3 from 50.1. This data suggests weaker factory activity and softer backdrop for industrial silver demand.
Gold Price Forecast: $4,000 Support and $4,150 Resistance
The daily chart for spot gold shows that the price has been trading within triangle pattern since October 2025. The price recovered within the triangle after dropping to $3,870 in October.
The price dropped by 2.61% on Tuesday to hit the support of the triangle and is rebounding in early Asian trading on Wednesday. The outlook for gold remains neutral in the short term as long as the gold price holds the support of $4,000.
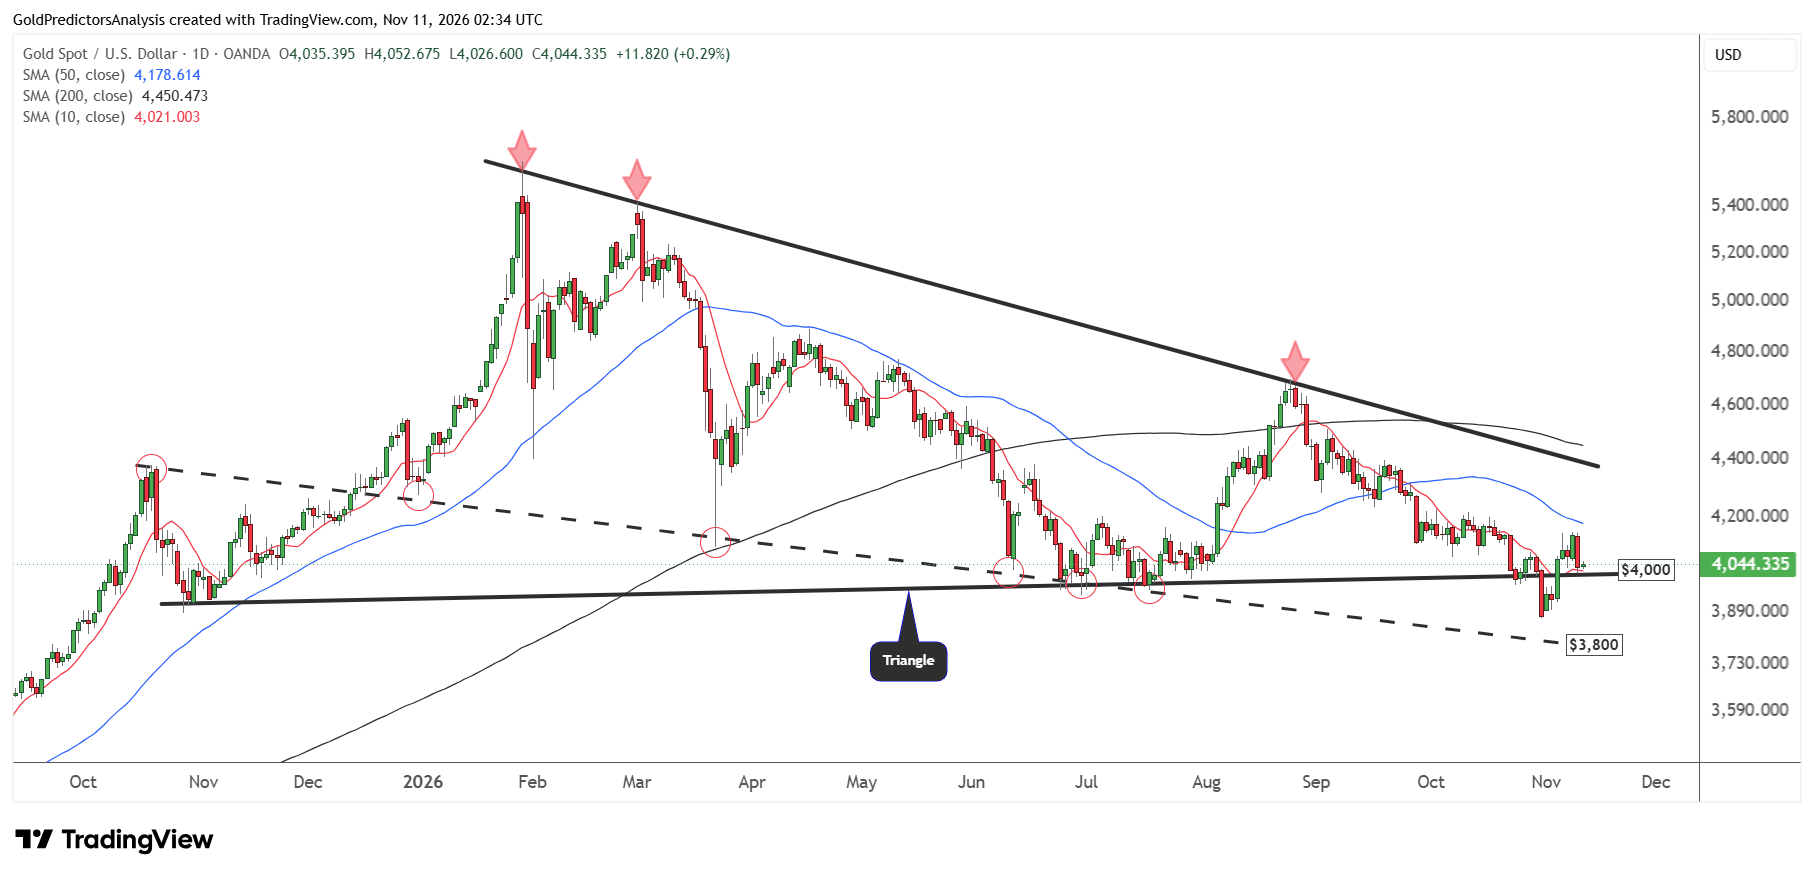
However, the price remains below the 50-day SMA at $4,178 which may consolidate prices in the short term. A break below $4,000 will open the way for further drop towards the $3,800 area. But a recovery above $4,150 may push prices toward the resistance of the triangle at $4,360.
The 4-hour chart for spot gold also shows that the price failed to break above the key level of $4,150. The price corrected towards the support of the descending channel that stretches from the highs of September 2026.
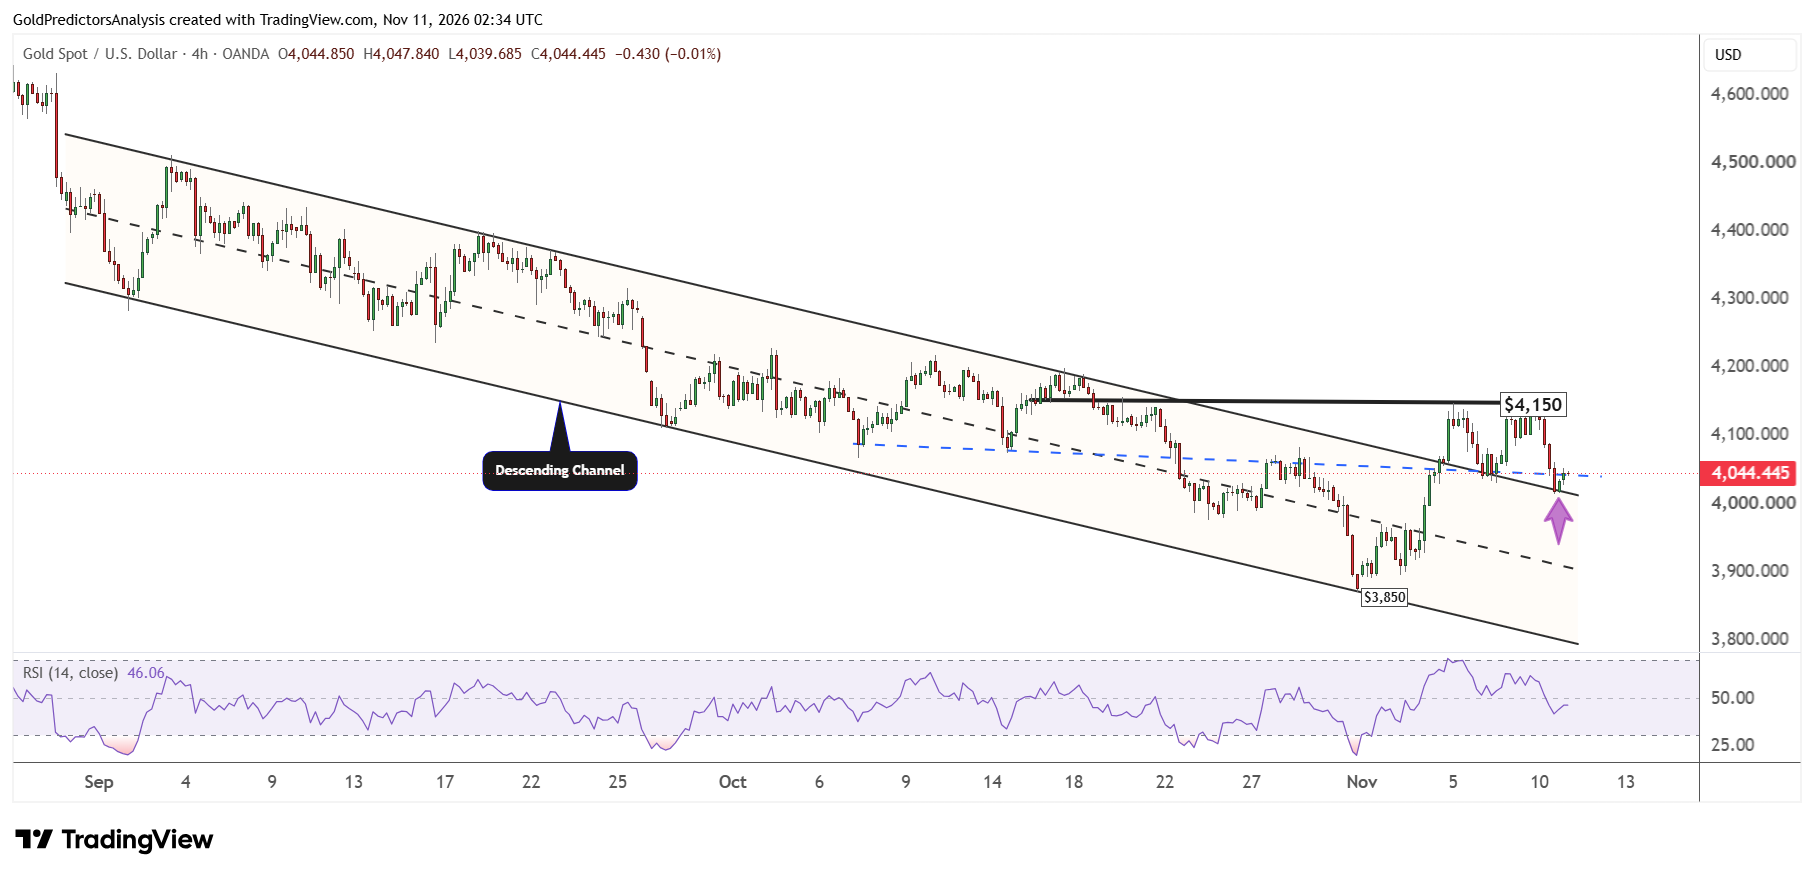
A break below $4,000 will likely push gold prices lower within this descending channel. The price needs to break above $4,150 to open the way for further upside towards $4,360. But the RSI has moved below the midline on the 4-hour chart which suggests that momentum remains weak in the short term.
Gold Price Forecast
Every new Gold analysis as it publishes, today's technical signal and key levels, live price — on one page.
See all Gold forecastsSilver Price Forecast: Break Above $55 Could Lift Prices to $60
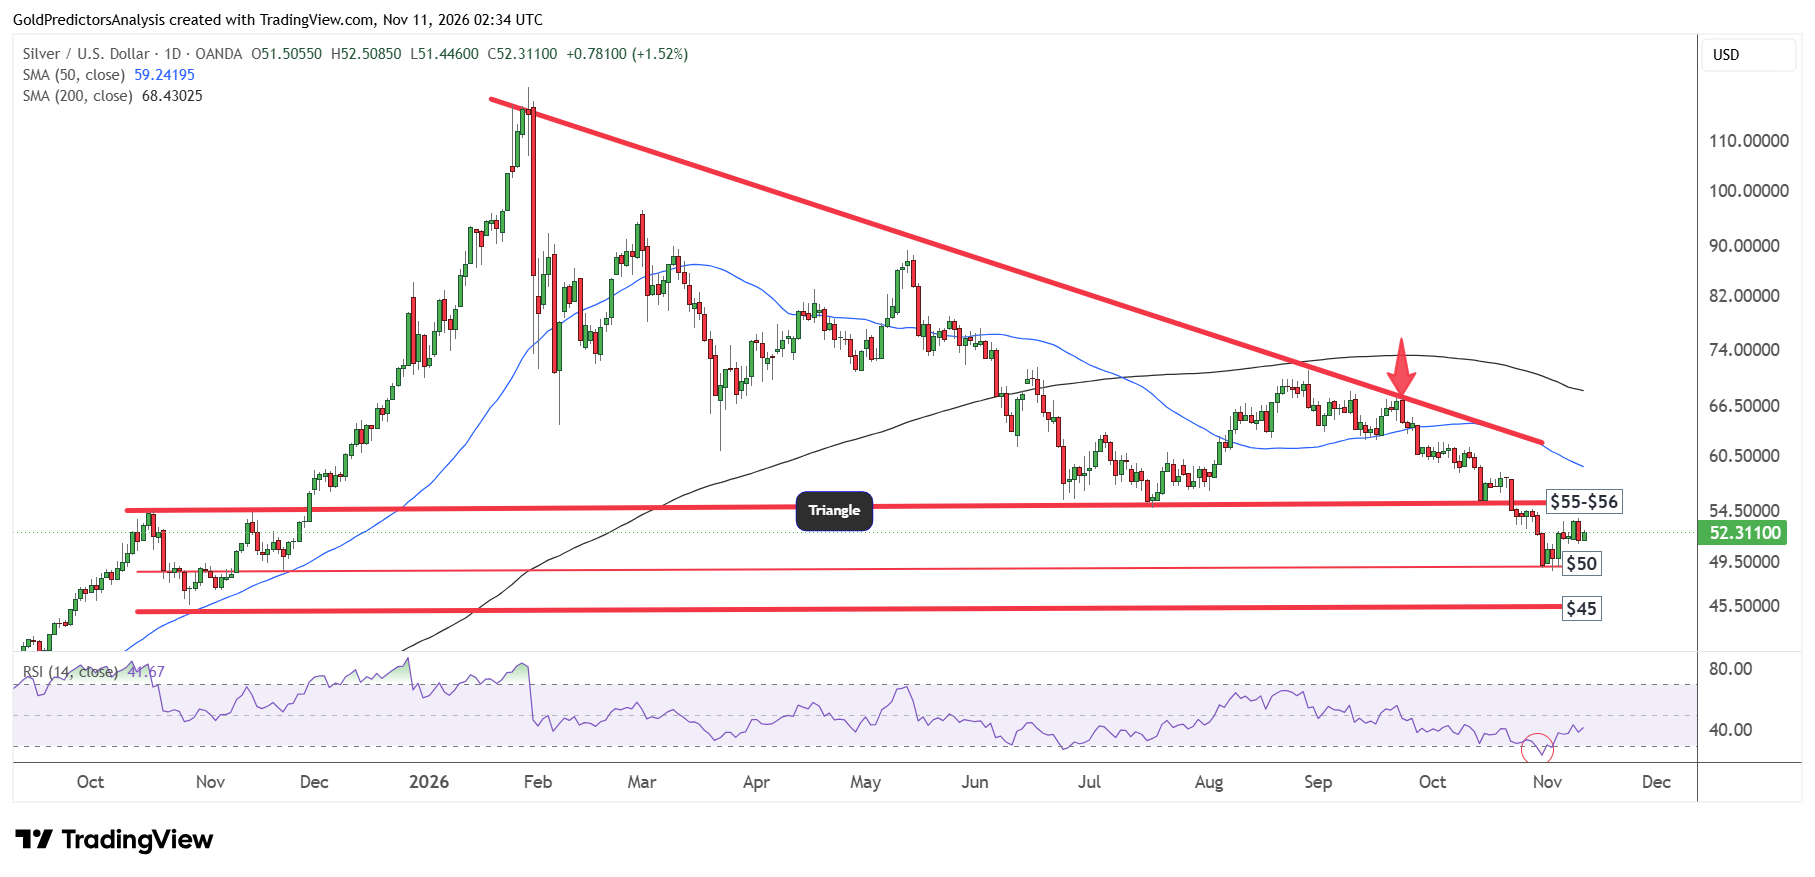
The daily chart for spot silver shows that the price has hit strong support in the $48 to $50 area. This support is defined by the horizontal support line on daily chart. The price is now rebounding from this support zone and resistance remains at $55 to $56.
A recovery above $55 will likely open the way for further upside towards the 50-day SMA in the $60 area. But a break below $50 will push prices further towards the $45 level, which may offer strong support in the long term.
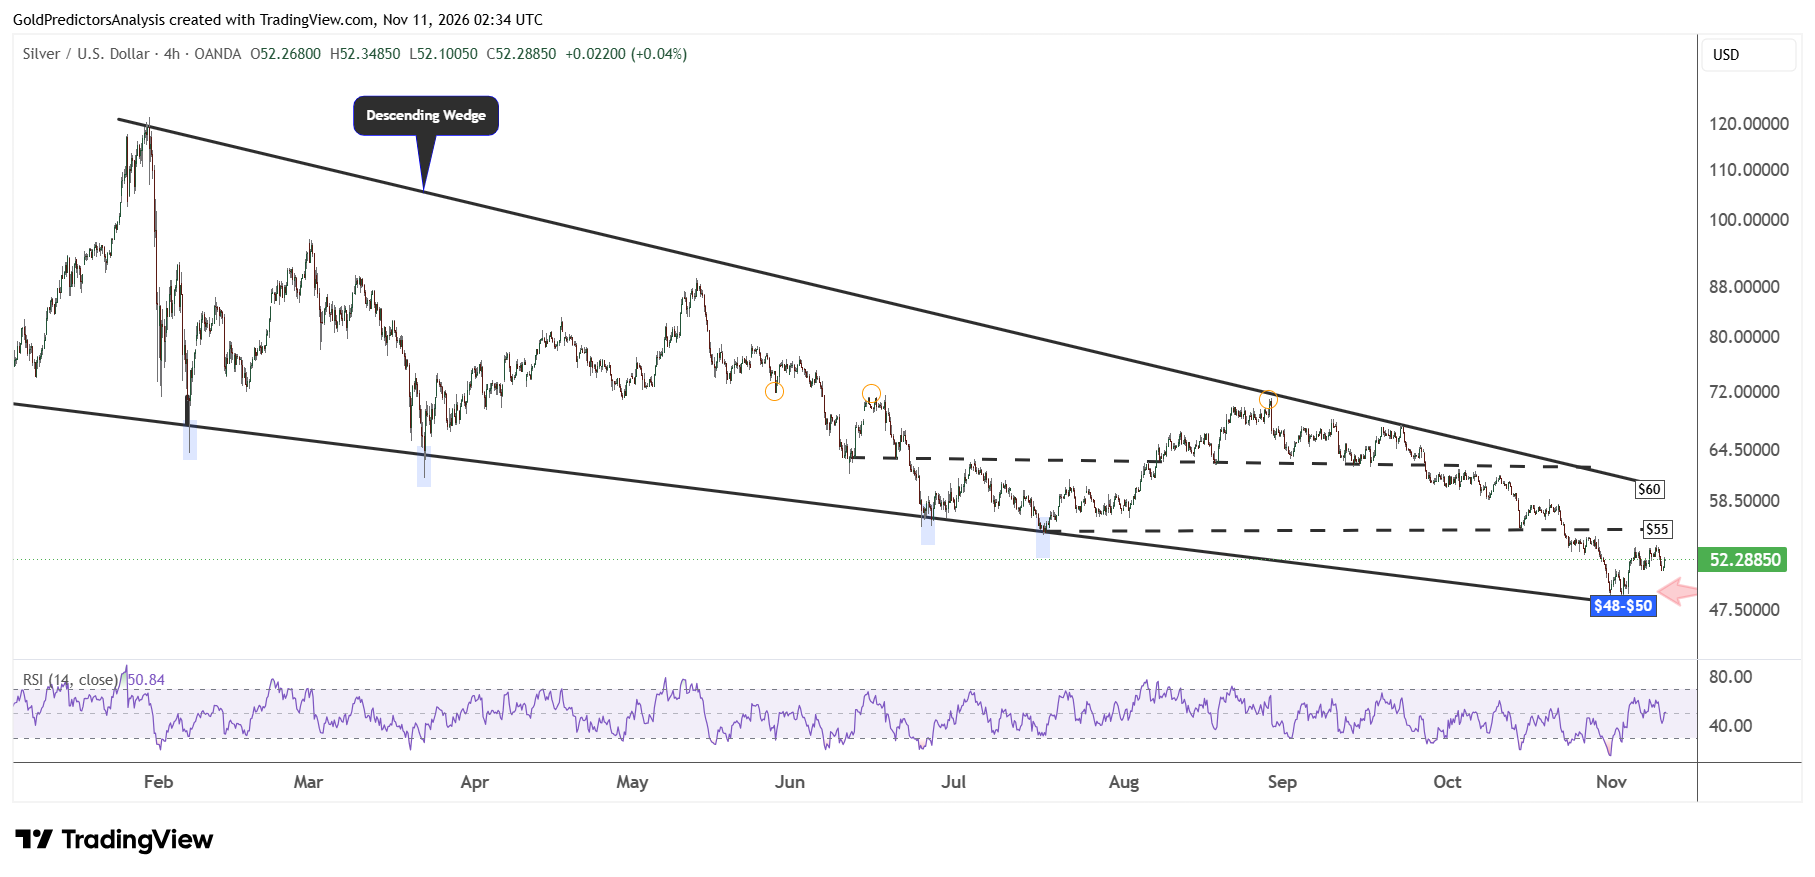
The 4-hour chart for spot silver also tells the same story. The chart shows that the price has been trading within descending wedge pattern since January 2026. The immediate resistance remains at $55.
The support at $48-$50 remains strong in the short term. A break above $55 will likely open the way for further upside toward the resistance of $60. A break above $60 will likely indicate positive trend in the silver market.
What to Watch Next
The market is now waiting for the US producer prices that will be released on Friday. The stronger than expected readings may push the US dollar higher and introduce further selling in gold prices. Gold prices must break above $4,150 to open the way for further upside to $4,360. Silver price needs to break above $55 to suggest a move to $60. The weak factory activity in China may limit rebound in silver. Silver must hold the $50 level to avoid deeper correction to $45. But a break above $55 will suggest a move to $60.