Advertisement
Advertisement
Gold Flirts With $2000 as U.S. Equities Continue to Encounter a Dramatic Selloff
By:
Gold continues to gain value based upon rising inflation levels and the current crisis in Ukraine.
The combination of geopolitical tensions and high levels of inflation are highly supportive of higher gold and silver pricing in the future. Also, major selling pressure resulting in lower prices in U.S. equities has market participants moving risk-on investment dollars into safe-haven assets.
As of 3:35 PM EST, with approximately 25 minutes left in the trading day, all three major indices are sharply lower. The NASDAQ composite is currently off by 3.21%, a decline of 427 points, with the index currently fixed at 12,886. The Standard & Poor’s 500 is down 2.64%, or 114 points, and is currently fixed at 4214.85. The Dow Jones industrial average has given up 2.18%, and after factoring in today’s decline of 716 points is fixed at 32,903.61. To effectively illustrate the massive decline in U.S. equities, consider that on February 9, the Dow closed at 35,751 points. In just under a month, the Dow has lost 7.96%.
The CPI (consumer price index) revealed that inflation has risen to a 40-year high in January, coming in at 7.5%. Unlike the PCE index (the preferred index used by the Federal Reserve), the CPI includes both energy and food costs. Therefore, it is a much more realistic barometer of current inflationary pressures. Because the price of crude oil has spiked tremendously, it is almost a certainty that the CPI index for February will reflect higher food and energy costs taking the inflation level well above 7.5%. The Bureau of Labor Statistics will release February’s CPI number this Thursday, March 10.
Crude oil futures continue their dramatic price increase. The most active crude light futures contract gained an additional 3.14%, or $3.63, and is now fixed at $119.42 per barrel. This will be reflected in rising gasoline prices that could now cost as high as five or six dollars per gallon in the United States.
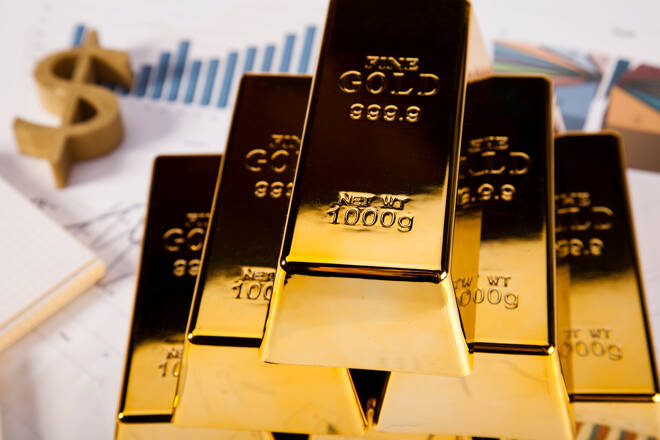
In trading overseas last night, gold futures, basis the most active April 2022 contract peaked at $2007.50. After trading to a low of $1964.20, gold prices recovered and are currently fixed at exactly $2000 per ounce, which is a net gain of $33.40 or 1.70%. Gold seems to be forming a base above $2,000.
The current level of inflation coupled with the crisis in Ukraine will continue to be highly supportive of gold and take the precious yellow metal yet to higher prices. Inflationary pressures continue to get hotter and the conflict in Ukraine continues to escalate which most certainly will continue to support higher pricing for gold. Now that gold is trading right around $2000, it is highly likely that $2,000 will become a new level of support.
Our technical studies indicate that current resistance levels begin at $2000, which should become support. The next level above that price point is $2022 and is based upon a price top that occurred at the end of September 2020. The next level of resistance above $2022 occurs at $2059, also based upon a top that occurred one week after gold achieved its record high of $2088. The brass ring so to speak, or the highest level of resistance that gold could easily take out during this leg of the rally is the record high at $2088.
Since that is the highest level that gold has traded to resistance levels above that require a different type of analysis, we have found that the combination of Elliott wave coupled with Fibonacci extensions provides the greatest insight to plot resistance above the record high. However, we are still $88 from that price point and will use the levels we have spoken about as the key levels of resistance should gold continue to rise.
For those who would like more information simply use this link.
Wishing you as always good trading,
Gary S. Wagner
About the Author
Gary S.Wagnercontributor
Gary S. Wagner has been a technical market analyst for 35 years. A frequent contributor to STOCKS & COMMODITIES Magazine, he has also written for Futures Magazine as well as Barron’s. He is the executive producer of "The Gold Forecast," a daily video newsletter. He writes a daily column “Hawaii 6.0” for Kitco News
Advertisement
