



Gold Shows Little Reaction to PPI
Spot gold is showing little reaction following the release of a relatively tame monthly producer inflation report. The price action suggests a relief rally could be developing rather than a support base and subsequent change in trend. However, I don’t think the data contains anything that would suggest an impending change in trend or even a strong counter-trend rally.
Fed Rate Hike Expectations Remain High
The market is getting some help from an initial dip in U.S. Treasury yields and the U.S. Dollar. However, there is nothing that indicates the PPI data will change the minds of some Fed members, who called for the need of a December rate hike after the hot CPI report on Tuesday. A 25-basis point rate hike is likely priced into gold. What traders really want to know is how much and for how long.
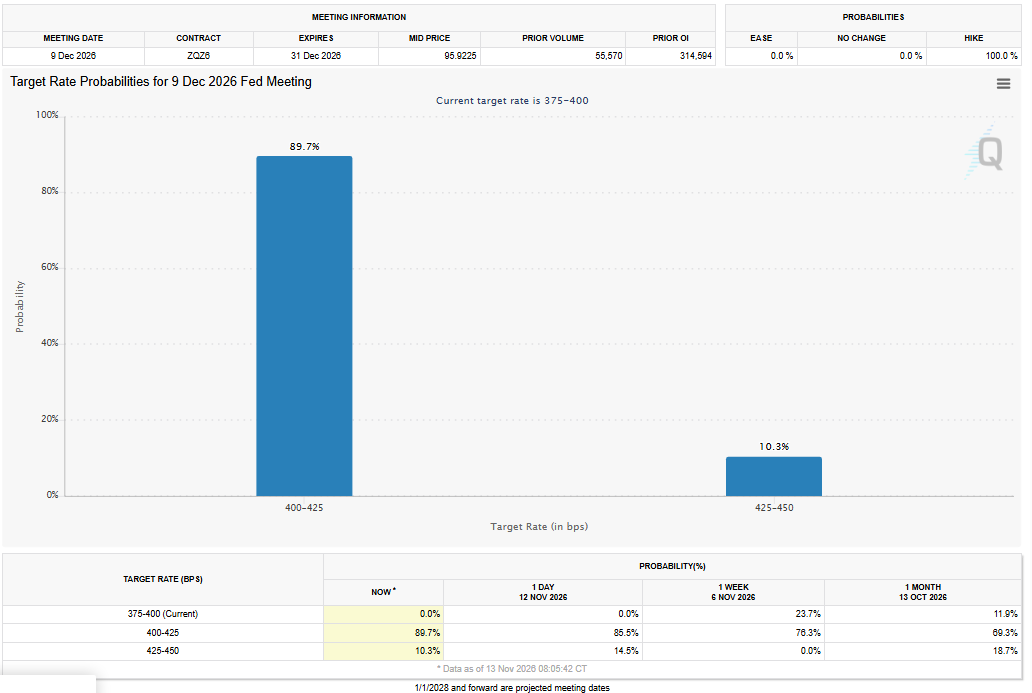
Currently, the CME’s FedWatch tool is showing an 89.7% chance of a 25-basis point rate hike and a 10.3% chance of a 50-basis point hike in December. Before the PPI report, the chances of the larger hike stood at 13.8%.
According to the Bureau of Labor Statistics, headline wholesale prices rose less than expected in October and core PPI met expectations. However, on an annual basis, PPI jumped 0.2 percentage points to 6.5%, its highest level since November 2022.
Gold Price Forecast
Every new Gold analysis as it publishes, today's technical signal and key levels, live price — on one page.
See all Gold forecastsDollar and Treasury Yields Keep Pressure on Gold
Technically, the U.S. Dollar Index (DXY) is in an uptrend on the daily chart. After breaking out over the recent swing top at 102.945, the current upside momentum indicates traders could be targeting the long-term top at 103.540. Besides the uptrend on the swing chart, DXY is also getting support from the uptrending 50-day moving average at 101.396.
Gold traders are also eyeing the 10-year U.S. Treasury yield. It has been soaring this week and is currently testing the upper-end of its retracement zone at 5.155%. A breakout over this area could drive the greenback higher, putting further pressure on the demand for dollar-denominated gold.
Daily Spot Gold (XAUUSD) Technical Analysis
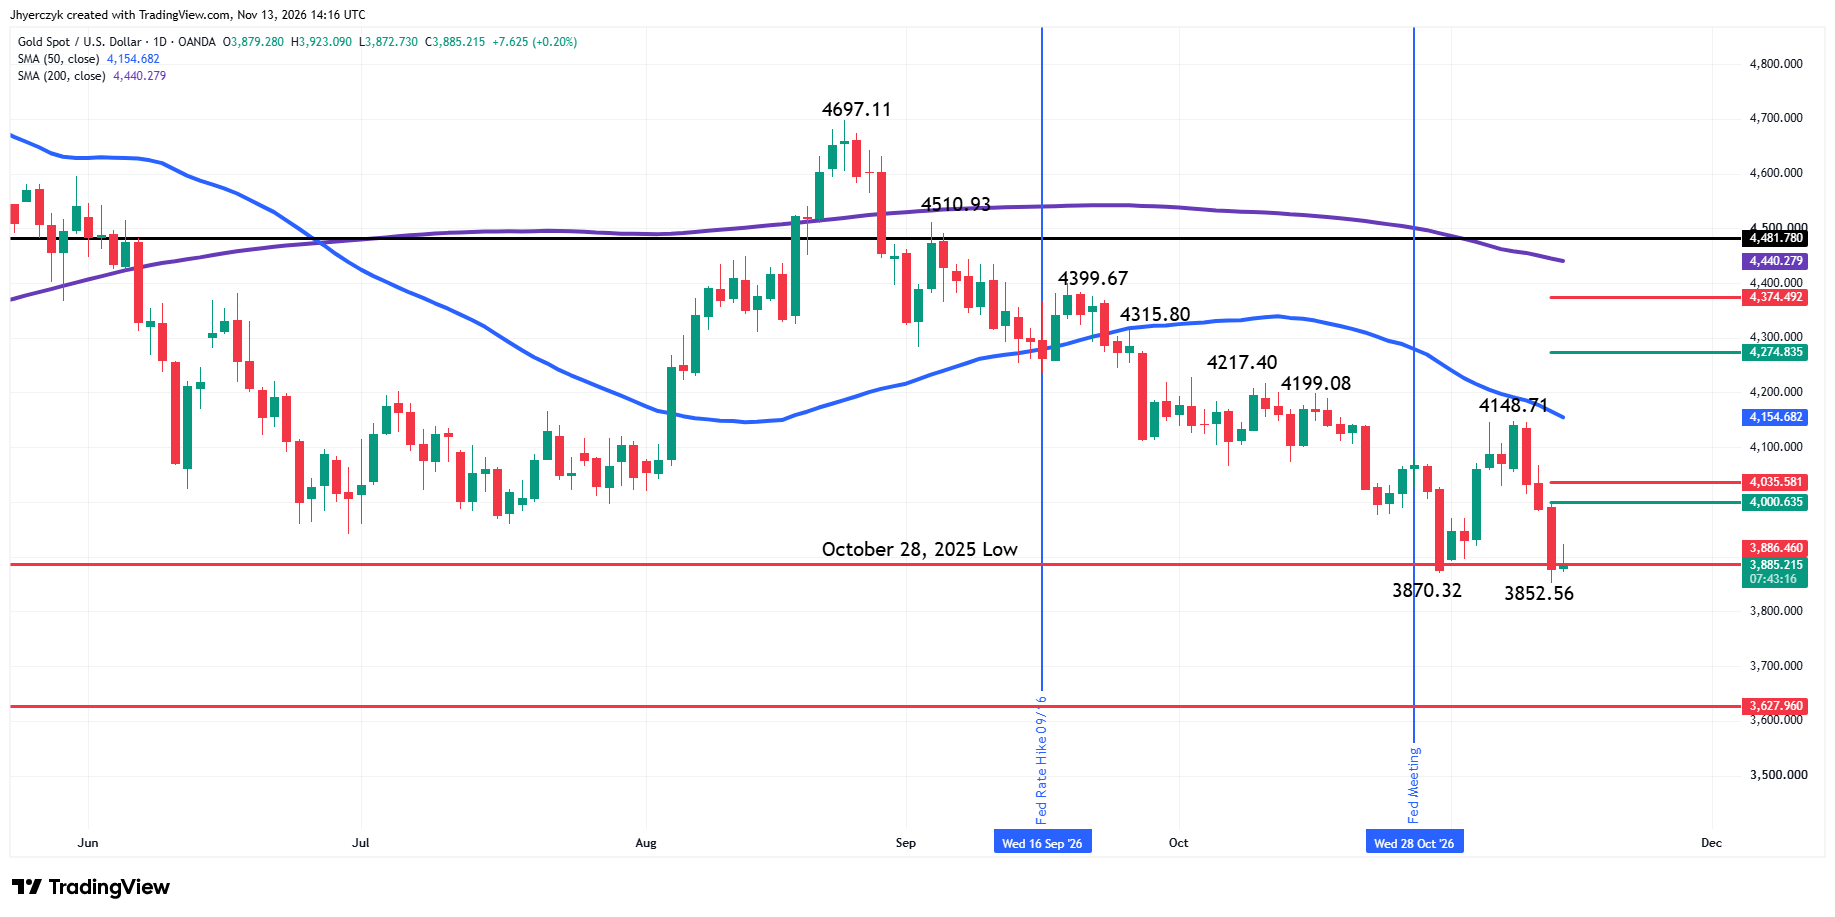
Spot gold is attempting to stabilize on Friday after touching a 52-week low the previous session. The main trend is down according to the daily swing chart. A trade through $4148.71 will change the main trend to up. Taking out yesterday’s low at $3852.56 will signal a resumption of the downtrend.
The new short-term range is $4148.71 to $3852.56. Its retracement zone at $4000.64 to $4035.58 is potential resistance.
The 50-day moving average at $4154.78 is capping the market. It forms a potential resistance cluster with the last main top at $4148.71.
Weekly Spot Gold (XAUUSD) Technical Analysis
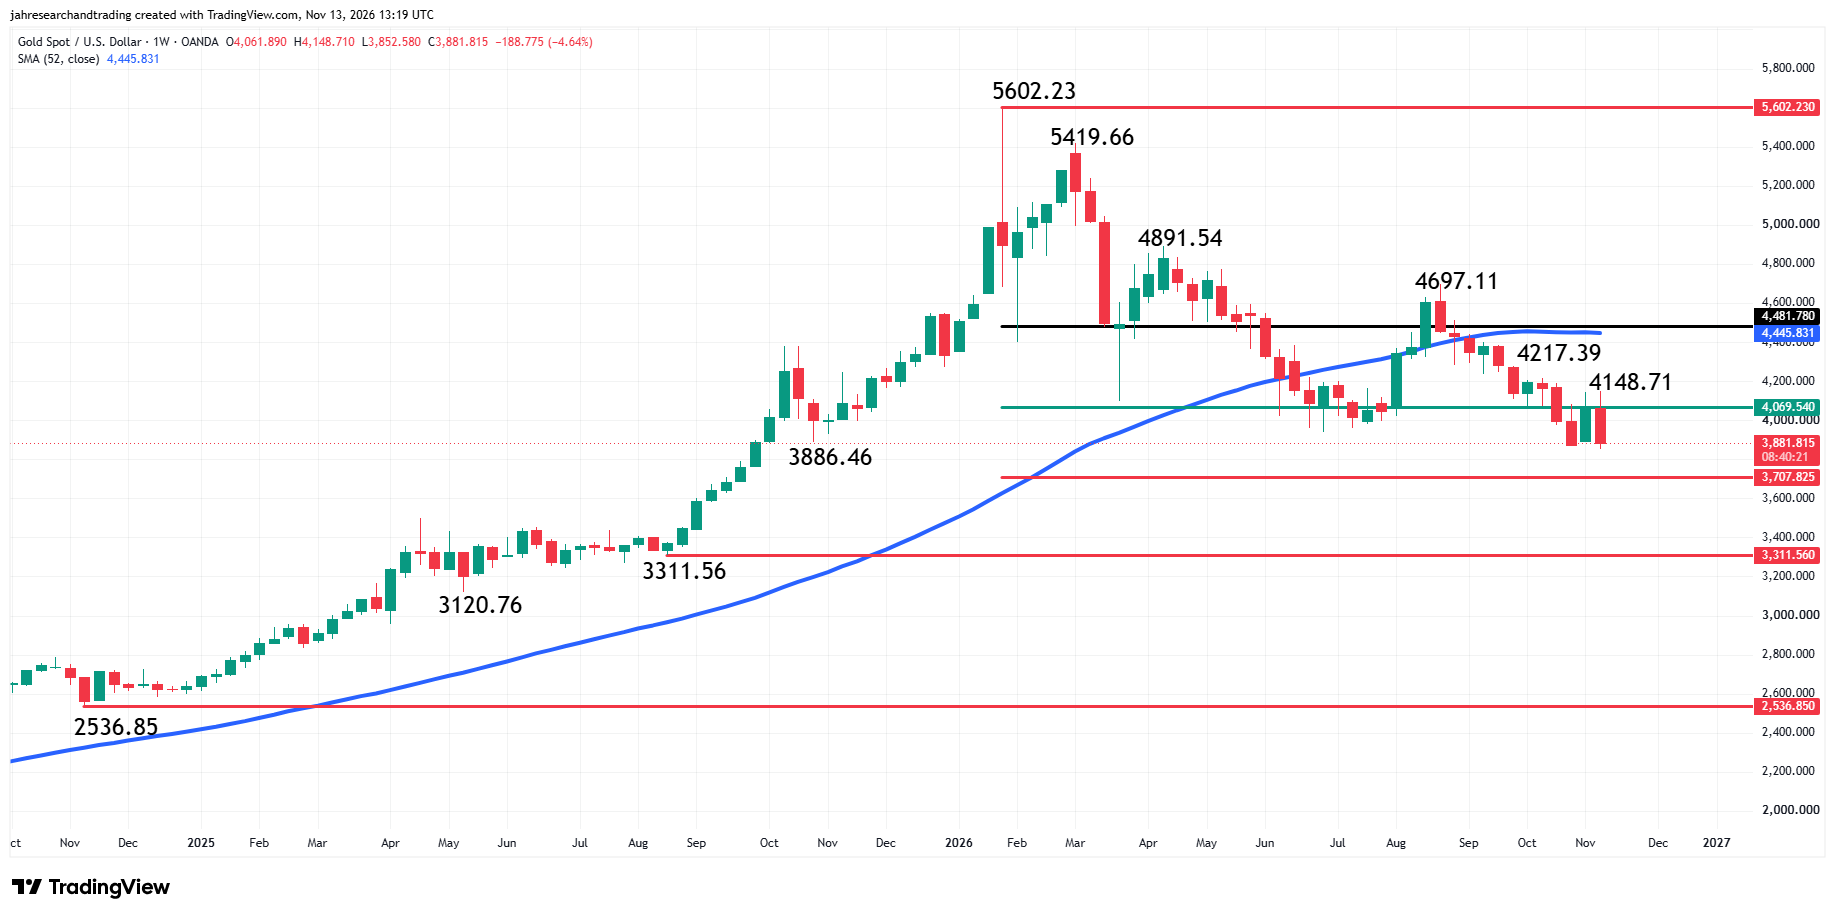
The Spot Gold main trend is also down on the weekly chart. A trade through $4697.11 will change the main trend to up. The trade through $3886.46 has reaffirmed the downtrend. This changes the next major downside objective on the weekly chart to $3311.56.
The minor trend is also down. A trade through $4148.71 will change the minor trend to up. This could shift momentum to the upside.
The long-term range is $2536.85 to $5602.23. Spot gold is currently trading inside its 50% to 61.8% retracement zone at $4069.54 to $3707.82. To some investors, this area represents value, but without a major catalyst to drive it higher and out of the zone, prices could continue to drift lower.
Spot gold is also trading on the bearish side of the 52-week moving average at $4445.94. This forms a tight resistance cluster with $4481.78. This level is 20% below the all-time high at $5602.23. According to classical analysis, this means XAUUSD is in a bear market. Overtaking $4481.78 will take gold out of a bear market, but that won’t mean the market just flipped to a bull market.
What to Watch
Daily Spot Gold (XAUUSD)
With the main trend down and the market testing its lowest level in a year, my bias is to the downside. The daily chart indicates there is plenty of room to the downside with the next major objective $3627.96.
My outlook will weaken if traders can overcome the 61.8% level at $4035.58 and I’ll likely flip to the upside on a sustained move over the 50-day moving average at $4154.78.
Weekly Spot Gold (XAUUSD)
My short-term and long-term biases are bearish. My short-term outlook will weaken if buyers can overcome the 50% level at $4069.54. I may reconsider the short side if buyers overtake the minor swing top at $4148.71.
Although the market is testing a long-term retracement zone at $4069.54 to $3707.82, my long-term bias is still bearish because spot gold is trading on the weak side of the 52-week moving average at $4445.94. My outlook is likely to turn bullish on a sustained move over this indicator.
If you’d like to know more about how to trade gold, please visit our educational area.