


Gold kicks off the Wednesday session around a disconnect between recently measured investment accumulation and the market’s sharp loss of momentum. The World Gold Council’s October exchange-traded fund review, published on November 5, showed global physically backed gold ETFs adding $2.7 billion in net inflows. Holdings increased by 19 tons to a record 4,275 tons at month-end, even as a lower gold price reduced assets under management. A substantial position in the metal therefore remained in portfolios at the end of October.
That being said, the fact did not prevent selling pressure from intensifying during November. The timing does matter. October’s ETF figures are historical monthly flows, not evidence that buyers were active today, for example. In an update published November 17, the World Gold Council described weakening Chinese exchange-traded fund demand during early November after 4 consecutive months of inflows. China’s gold ETFs added 6.3 tons in October, reaching a record 310 tons at month-end. More recent modest outflows marked a reversal in near-term demand.
The difference between the end-of-month holdings record and today’s trading pressure is precisely what investors should not overlook.
There Is an Unusually Informative Change in the Rate Backdrop
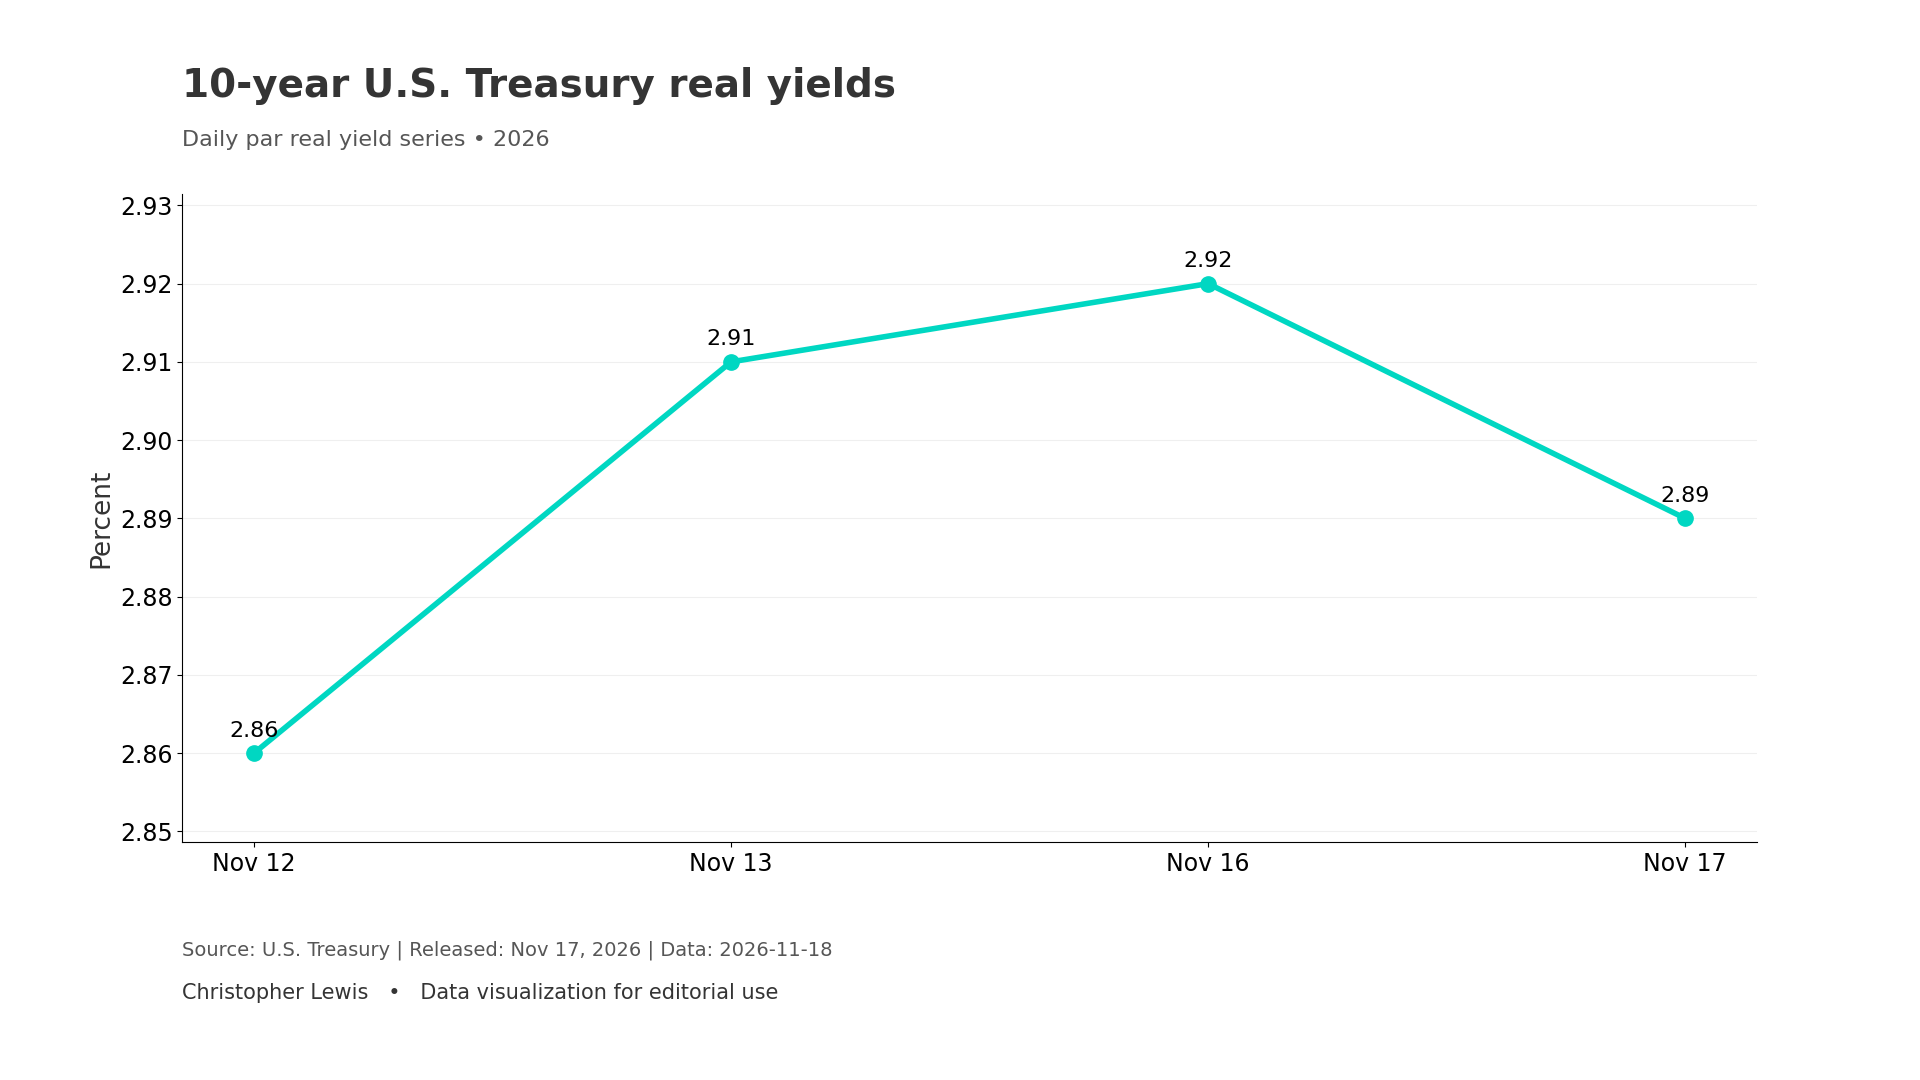
The U.S. Treasury’s 10-year real yield measured 2.92% on November 16 and 2.89% yesterday. Real yields thus edged lower on the latest available official observation despite a broader higher-rate environment. Higher real yields can make non-interest-bearing bullion less attractive, but the day-to-day correlation is not necessarily mechanical. Gold can sell off even as real yields dip, as we have seen during the trading session on Wednesday.
If investors are reducing leverage, changing risk budgets, or selling liquid assets to meet margin requirements, the dollar and expectations of Federal Reserve policy do remain relevant to the metals opportunity costs. But a careful analysis should not assign every intraday movement to one macro variable, obviously. A strengthening dollar makes dollar-priced bullion more expensive for some non-U.S. holders, while shifting expectations of policy rates affect the appeal of cash and bonds at the same time.
Different investor groups act in different ways. A long-term reserve manager and gold ETF holder and a leveraged COMEX trader do not necessarily trade on the same timetable, and that is part of what we are seeing play out here.
Liquidity Figures
The World Gold Council’s October liquidity figures offer a useful second lens. It estimated average daily global gold trading volumes of $365 billion in October, a 13% monthly decline. Exchange-traded activity fell more sharply than over-the-counter activity. Lower derivatives participation alongside weakening prices raises questions about whether the market is undergoing a positioning reset rather than a simple collapse in the underlying asset. Its reported reduction in net COMEX long positions during October supports taking a closer look at derivatives positioning. These data sets are based on October, not a new November liquidation number.
Gold Price Forecast
Every new Gold analysis as it publishes, today's technical signal and key levels, live price — on one page.
See all Gold forecastsChinese Investment
Chinese physical and investment channels deserve attention as well. The November 17 World Gold Council note says local prices weakened during October, yet buying of certain physical products remained much more resilient. The distinction matters because a gold price decline may simultaneously discourage momentum investors and attract buyers looking for longer-term value. These offsets are not instantaneous, and they do not guarantee a floor. Separating retail physical demand from ETF creations and futures exposure helps prevent exaggerated claims about who is buying or selling.
My working interpretation is that gold is confronting a positioning and confidence problem while its longer-term investment base does remain somewhat substantial. The strongest evidence of a renewed advance in price would come from an improvement in price action accompanied by fresh, dated ETF inflows and stabilization in speculative positioning. Until that happens, October’s record holdings should not be presented as proof that today’s weakness is already over.
The Charts Look Horrible
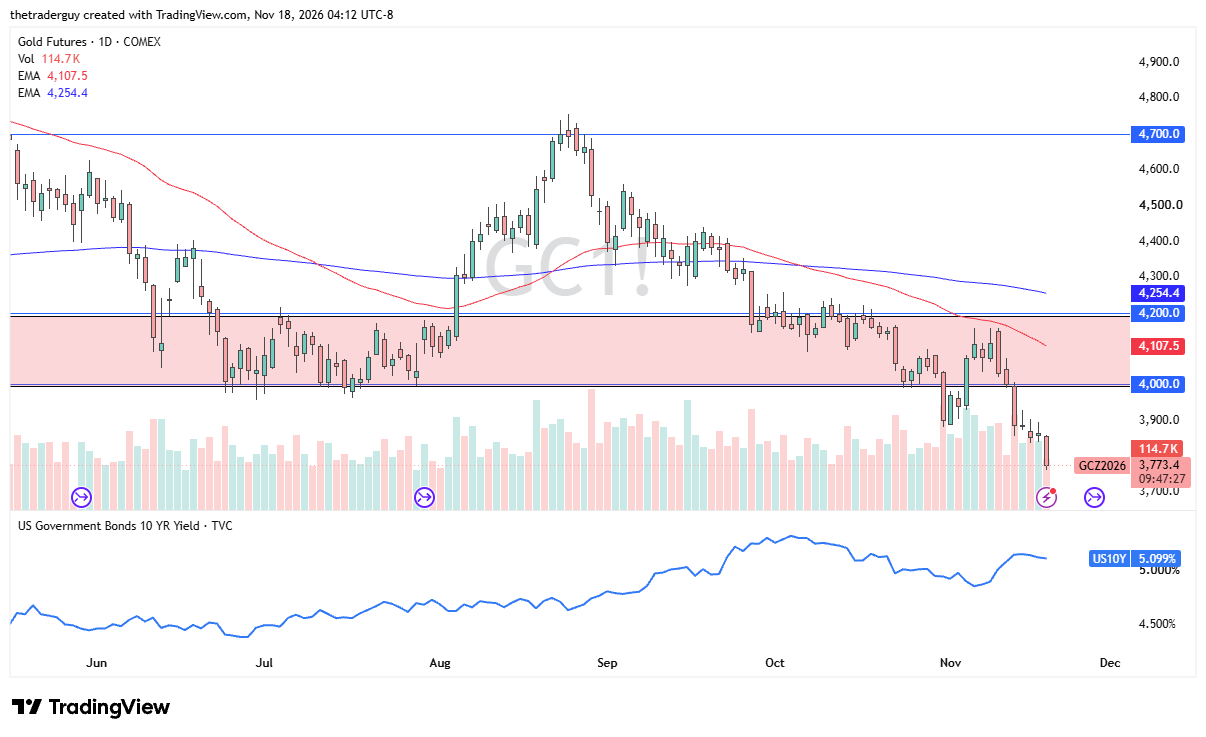
Looking at the charts, the gold markets have essentially collapsed as we continue to see a lot of strength in the U.S. dollar, and higher rates remain one of the biggest problems for gold holders at this point in time. It looks like we have just seen the bottom fall out, and with that being the case, markets are likely to continue to see a lot of selling pressure on any attempt at a rally. There is technical support closer to $3,500.
If you’d like to know more about how to trade gold and silver, please visit our educational area.