Advertisement
Advertisement
Gold, Silver, Copper Daily Forecast: Rising on Fed’s Dovish Stance and Economic Data
By:
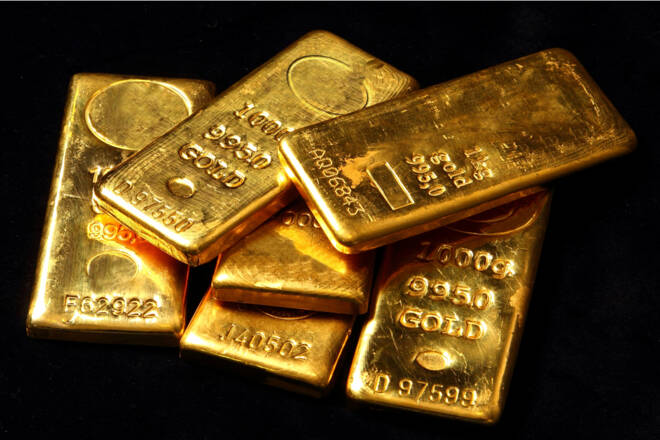
Gold prices have risen, driven by the Federal Reserve's dovish signals, with spot gold stabilizing above $2,036, despite remaining below its monthly peak.
Key Insights
- Gold prices rise on Fed’s dovish stance, with spot gold at $2,036.83, but remain below monthly highs.
- Lower interest rates may shift investments from gold to riskier assets.
- Copper strengthens on weak dollar and positive Chinese data, with futures up 0.3%.
- Gold’s technical analysis indicates bullish trend above $2,040, breaking key resistance patterns.
- Copper exhibits a bullish trend, breaching the pivotal $3.85 level.
Silver Prices Forecast
Silver’s market performance on December 15th reflects a cautiously optimistic outlook. The metal, currently trading at $24.219, has seen a modest gain of 0.16%.
Positioned just above its pivot point of $24.22, Silver faces immediate resistance at $24.63, with further levels at $24.91 and $25.20. Should the momentum shift, support can be found at $23.83, $23.52, and $23.24.
The Relative Strength Index (RSI) of 71 indicates an overbought condition, suggesting the possibility of a near-term pullback. Notably, Silver’s current trading above the 50-Day Exponential Moving Average (EMA) of $23.64 confirms a short-term bullish trend.
A significant technical pattern is Silver completing the 50% Fibonacci retracement around the $24.20 mark. A bullish breakout above this level could signal further buying interest. In summary, Silver exhibits a bullish trend above the $24.15 threshold.
Copper Prices Forecast
Copper, as of December 15th, displays a bullish trend in the commodities market, marking an increase of 0.75% to a price of $3.91. This upward move situates the metal comfortably above its pivot point of $3.86, hinting at a possible continuation of its recent gains.
Copper faces immediate resistance at $3.93, with the next key thresholds at $3.99 and $4.05. In the event of a downturn, support levels are positioned at $3.77, $3.73, and $3.68.
The technical indicators offer a positive outlook. The Relative Strength Index (RSI) stands at 67, hovering below the overbought territory and suggesting a sustained bullish momentum. Notably, Copper is trading above the 50-Day Exponential Moving Average (EMA) of $3.83, reinforcing the short-term bullish sentiment.
A critical development in Copper’s chart pattern is its breach of the pivotal $3.85 level, which solidifies the bullish bias in its trading behavior. In conclusion, the technical analysis suggests that Copper is likely to maintain its bullish stance above the $3.85 mark.
For a look at all of today’s economic events, check out our economic calendar.
About the Author
Arslan Aliauthor
Arslan is a finance MBA and also holds an MPhil degree in behavioral finance. An expert in financial analysis and investor psychology, Arslan uses his academic background to bring valuable insights about market sentiment and whether instruments are likely to be overbought or oversold.
Advertisement
