



Spot gold (XAUUSD) price consolidates below $3,900 on Tuesday after the drop to $3,832 on Monday, which is the lowest level since October 2025. These consolidations below $3,900 indicate bearish pressure. This bearish pressure is driven by the strength in the US dollar which has reached 19-month high, as the market expects the Fed to increase interest rates by 25 basis points in December.
Summary of the Forecast
The inflation data from the US remained hot in October. The import prices also increased 1.1% in October which shows signs of persistent inflation. The hot inflation data increased expectations of a Fed rate hike. The market now expects the Fed to increase interest rates by 25 basis points in December with a probability of 95%. The Fed will release the meeting minutes for October on Wednesday. If the meeting minutes lead traders to expect further rate hikes in 2027, the gold price may face deeper correction.
Short-Term Forecast and Target of $3,760–$3,800
U.S. producer prices increased 6.5% from a year earlier in October, which is the fastest annual increase since November 2022. Consumer inflation in the US was also hot as consumer prices increased 0.4% in October from September which is above the forecast of 0.3%. The import prices increased 1.1% in October and the nonfuel import prices were up 0.8%.
The 10-year US Treasury yields jumped after the inflation data and reached 5.17% last week. The US dollar index also remained strong last week and gained over 1%. The index consolidated near the 103.60 level on Tuesday. The elevated US Treasury yields and strong US dollar keep gold prices under pressure in the short term.
Gold price broke the key support level at $4,000 and hit the $3,832 level on Monday. A break below $3,800 will increase the risk of deeper correction toward $3,760 in the short term. A daily close above $3,900 is required to push the price back to $4,000.
Gold Price Forecast
Every new Gold analysis as it publishes, today's technical signal and key levels, live price — on one page.
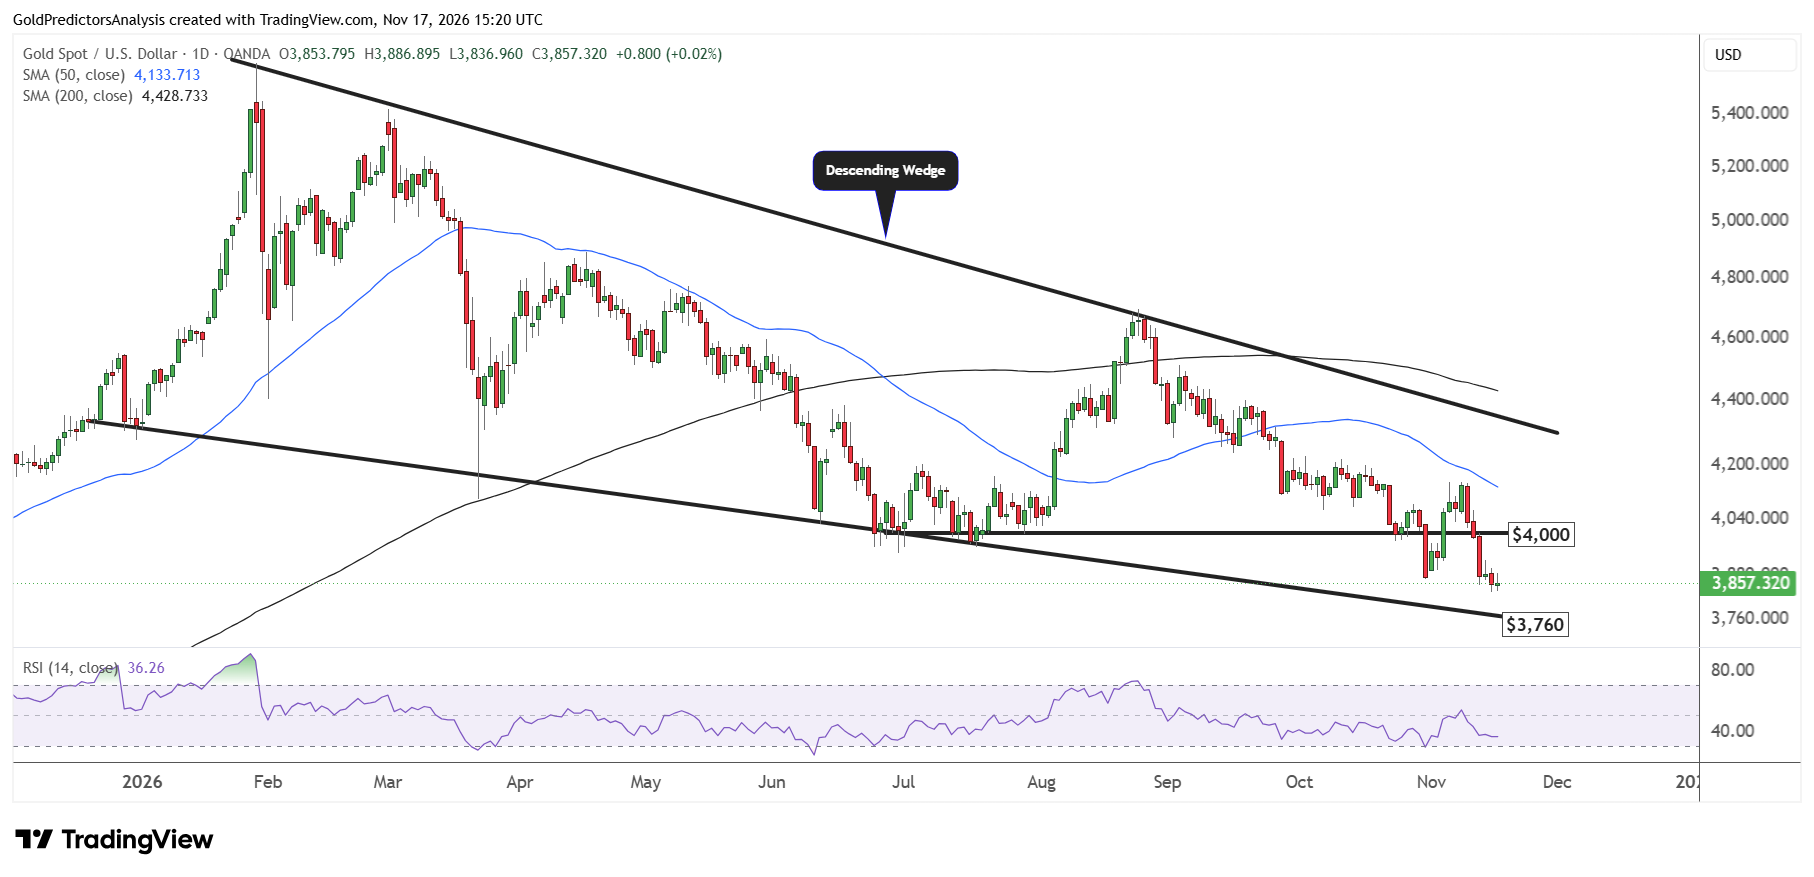
See all Gold forecastsThe chart below shows that the price is approaching the lower boundary of descending wedge at $3,760. The 50-day and 200-day SMAs are sloping downward and RSI remains below the midline. The price needs to recover above the 50-day SMA near $4,150 to ease the bearish pressure in the short term.
Medium-Term Forecast and Range of $3,800–$4,500
The Federal Reserve will update the interest rate forecasts at the next meeting on December 8-9. The officials projected the median rate of 4.1% in September for the end of 2027. If they raise this forecast and real yields continue to increase, then gold may remain under pressure. The slowdown in inflation and correction in real yields may support gold prices.
Lower gold prices have encouraged some buyers to return. The World Gold Council said that lower gold prices boosted the demand for jewelry, bars and coins during festival season in India.
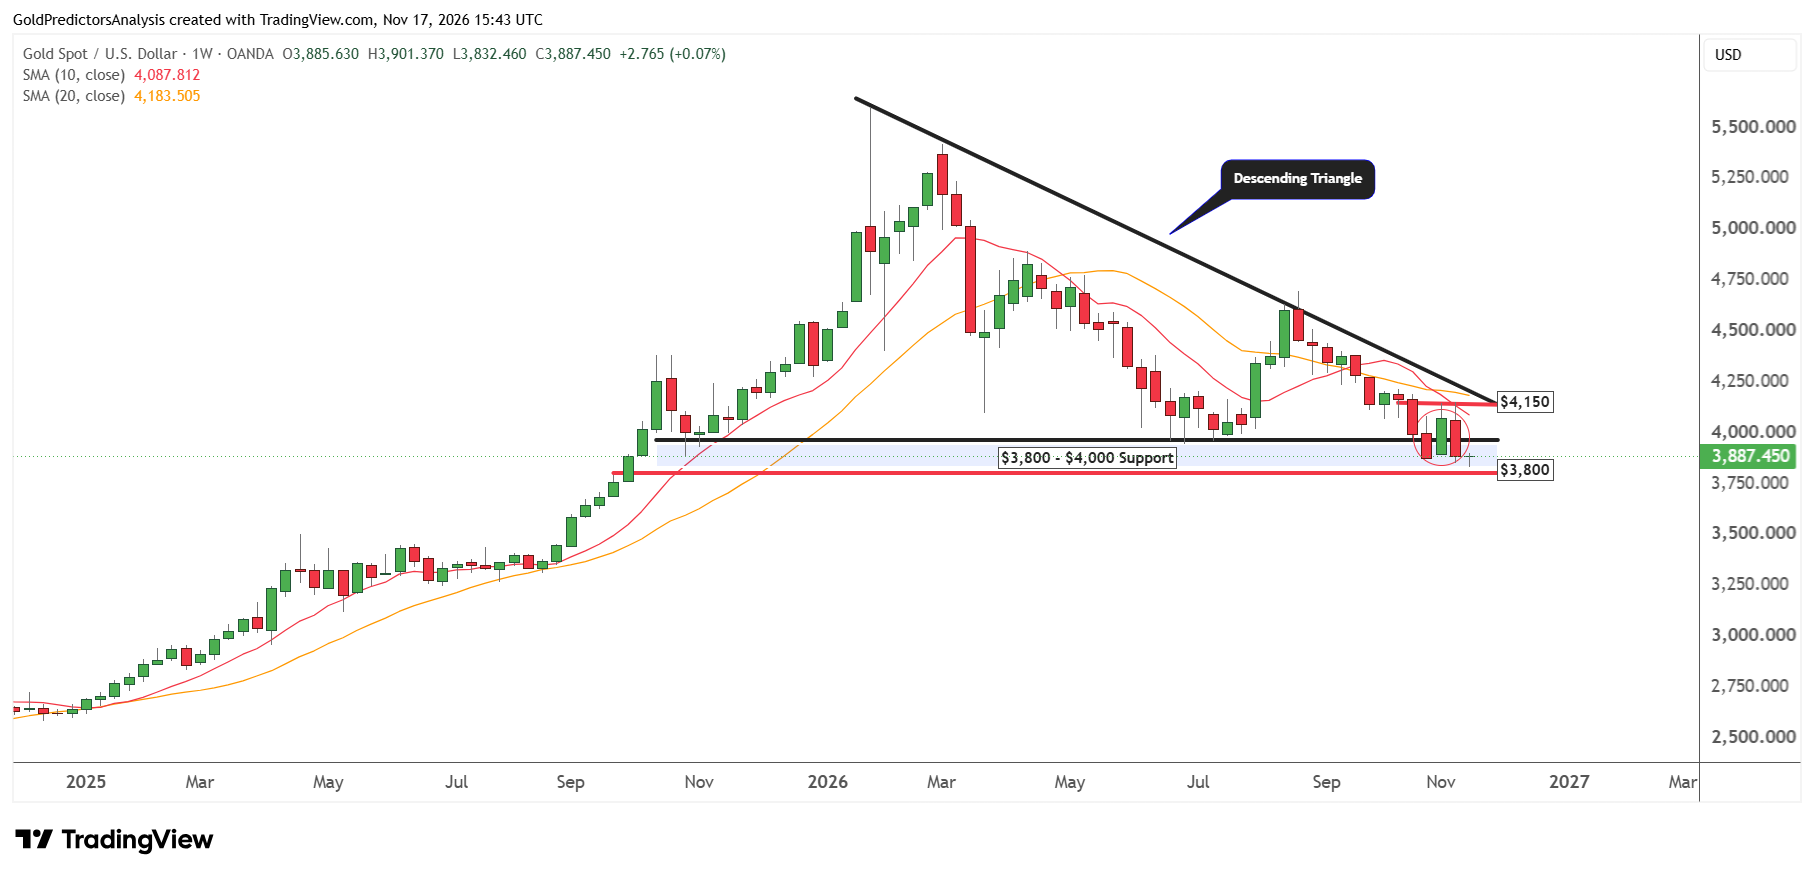
The weekly chart below shows that the price is consolidating at the lower boundary of the descending triangle pattern and remains under pressure. A weekly close above $4,150 may open the way for strong rebound toward $4,250. A break above $4,250 may extend the rally to $4,400-$4,500. However, the weekly close below $3,800 may extend the correction and increase the risk of deeper correction toward $3,500-$3,600.
Long-Term Forecast and Target of $5,000–$5,600
Gold price remains in a structural bull market in the long term despite the short-term correction. The demand for gold remains strong from central banks. The World Gold Council estimates that central banks and other official institutions bought the net 321 tonnes of gold in Q3 which is 42% up from the year earlier.
This compares with the five year quarterly average of 227 tonnes. The central bank of China also added another 25.8 tonnes in October which is the 24th consecutive month of purchases. The sustained buying from central banks supports the case for gold as a reserve asset during the high interest rate environment.
Physically backed gold ETFs also attracted $2.7 billion in October. This is fourth straight month of inflow. The holdings increased to the record 4,275 tonnes. The continued buying from these sources may support the recovery case for gold in the long term.
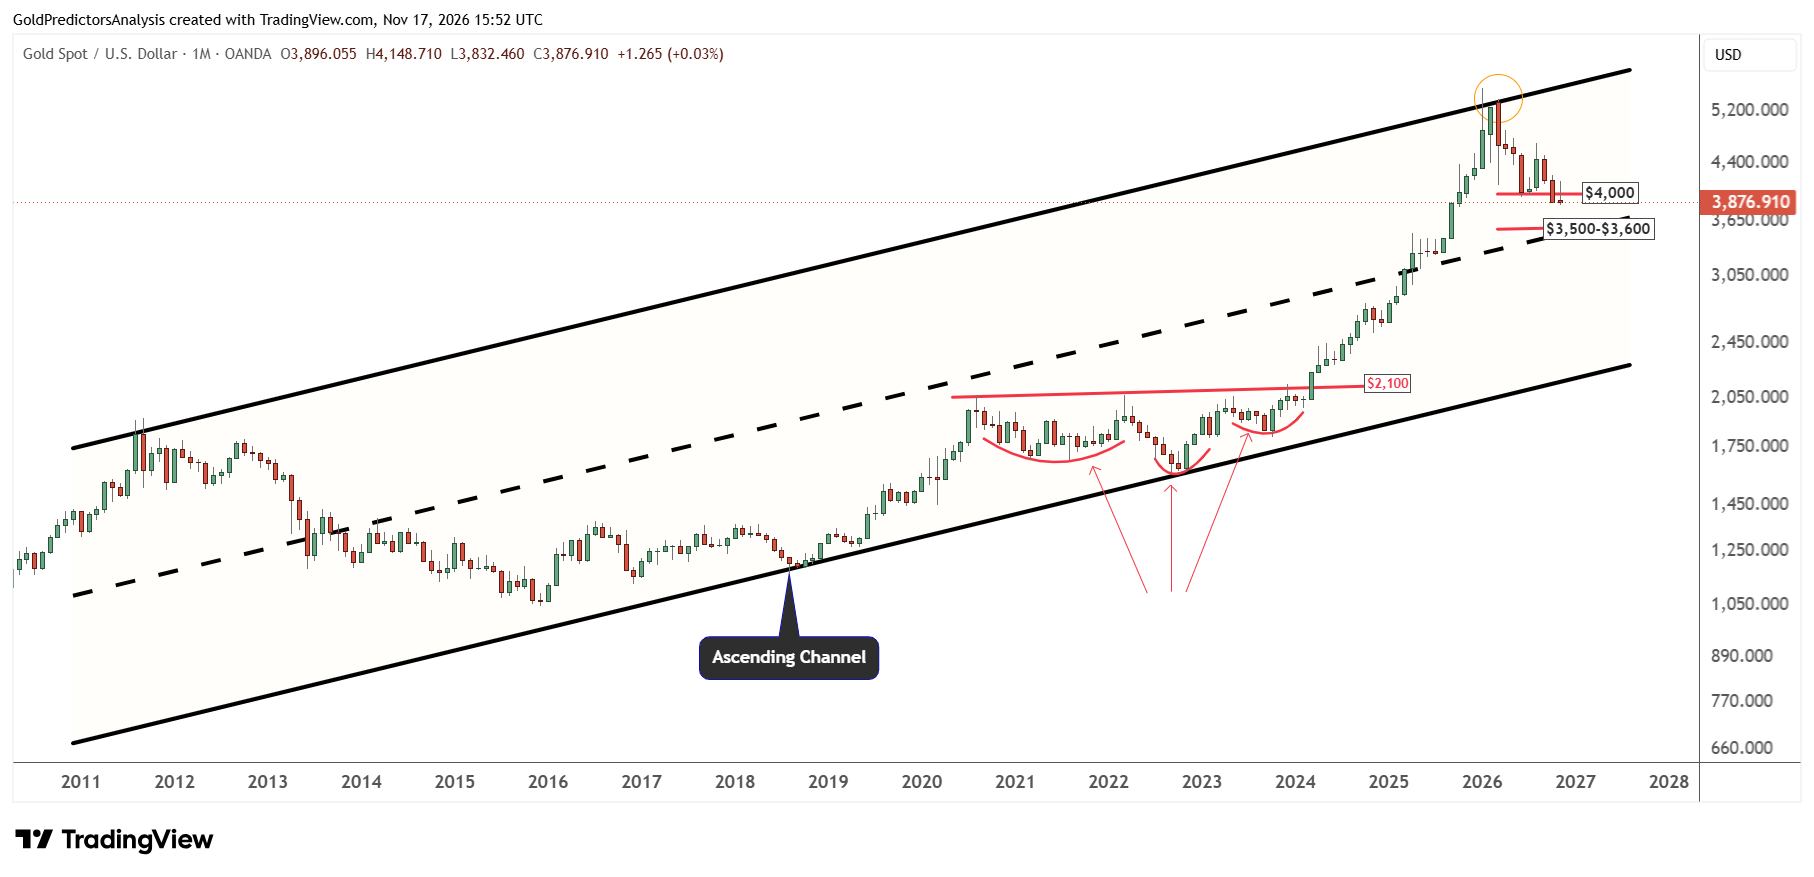
The monthly chart for spot gold shows that the price closed below $4,000 in October for the first time after forming the peak at $5,600. This suggests that price may continue to drop towards the midline of the ascending channel within the range of $3,500 and $3,600.
A confirmed break above $4,500 may suggest that the gold price may continue to rally to $5,000 and then $5,600. The main risk for gold comes from the high real yields. If real yields continue to increase in 2027, the gold price may face deeper correction.
Read more: Strong Dollar Puts Key Support at Risk