


Dollar Breakout Extends Gold’s Decline
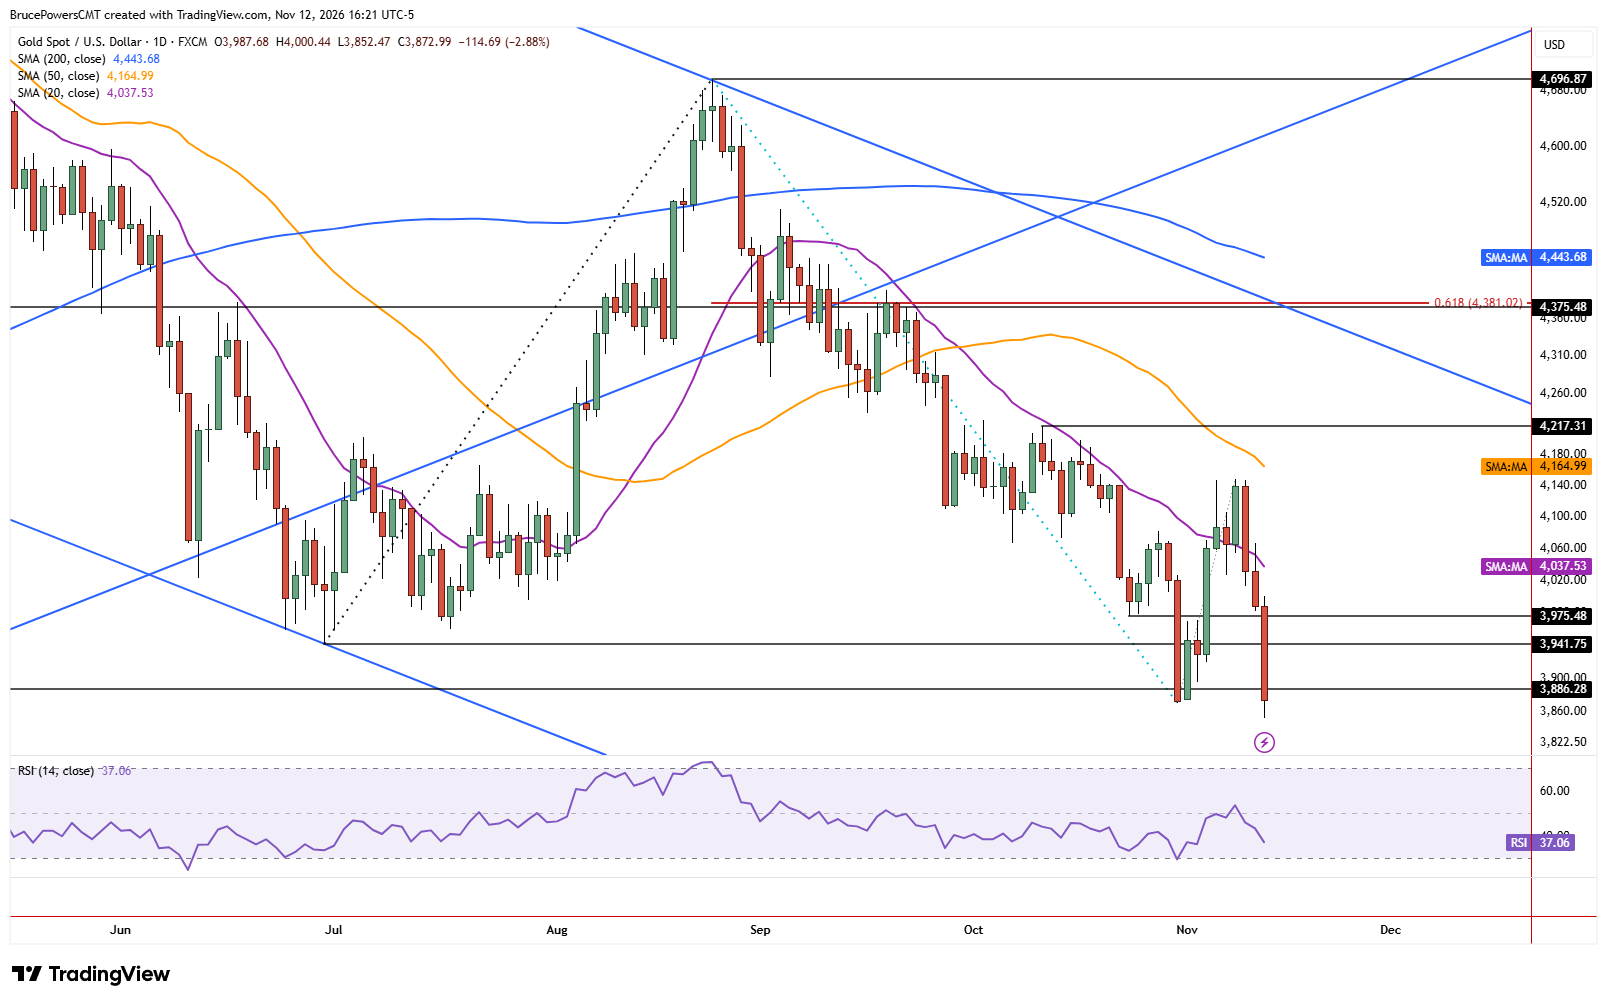
Gold continued lower on Thursday, extending to a new low of $3,851 after triggering a bearish continuation signal below $3,870 from two weeks ago. This correlates with sharp upside breakout of a bullish flag pattern for the U.S. dollar index (DXY), which is making gold more expensive for much of the world.
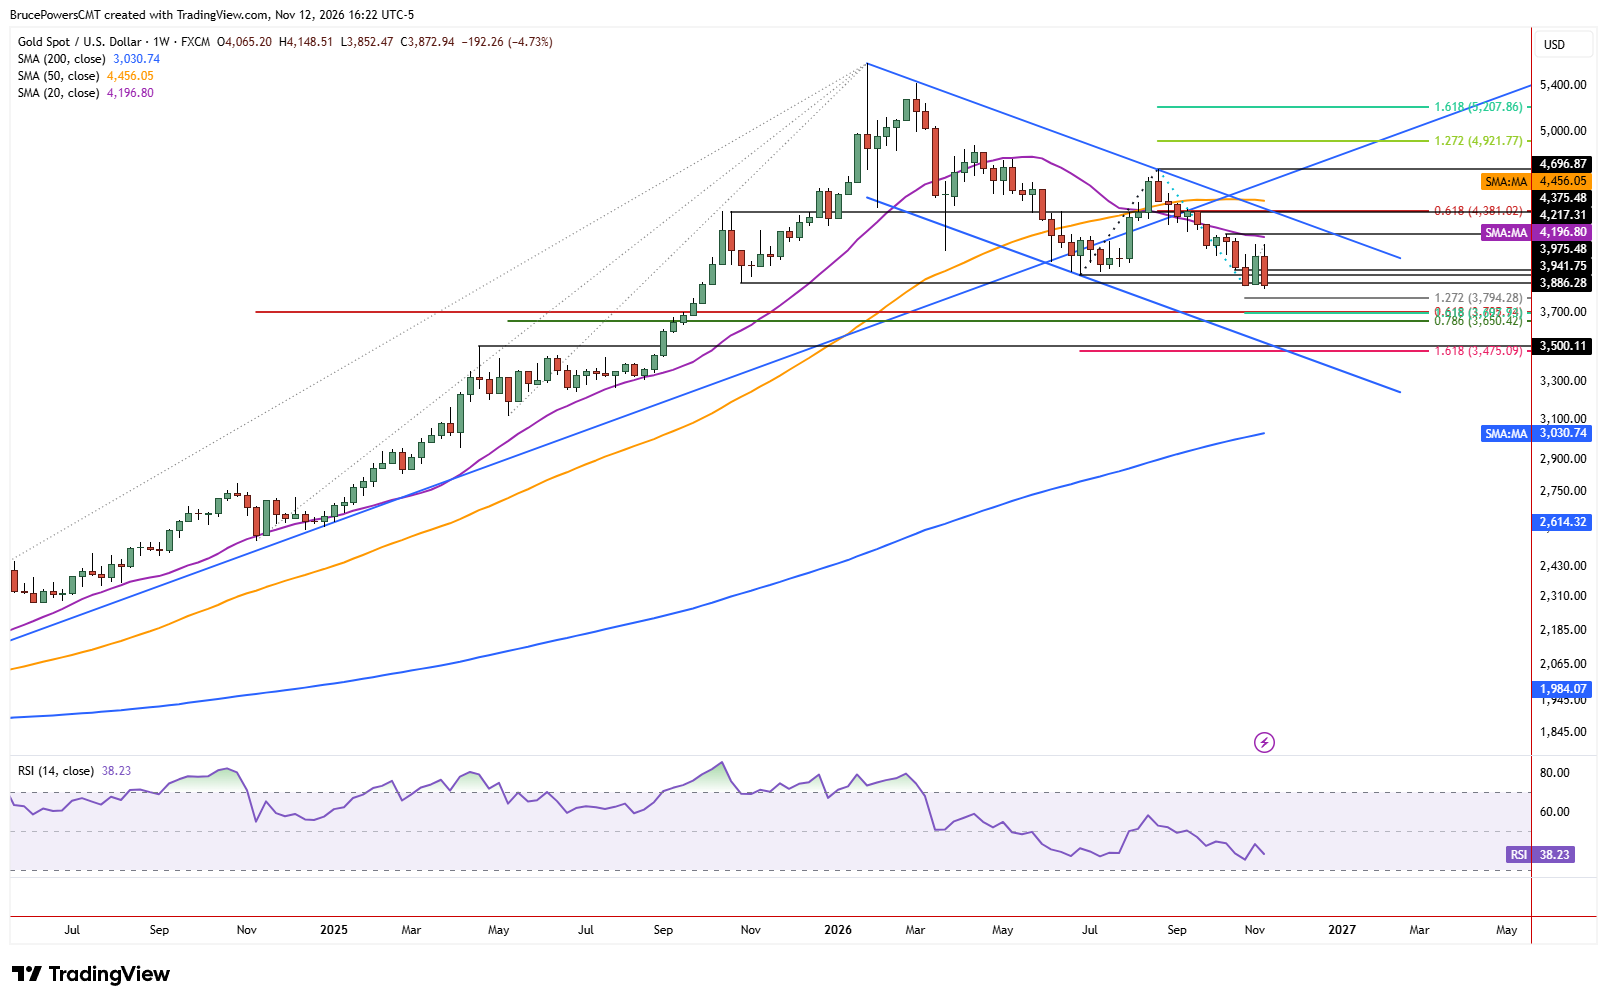
Although it looks like the breakdown below the prior low with a daily close below it, the new bearish signal increases the potential for further declines after the market captured buyers during recent signs of strength. Fibonacci extension targets for the recent rally suggest initial downside targets at $3,794 for the 127.2% extension and $3,698 for the 161.8% extension. Since the initial target is not reinforced by other indicators, the 161.8% level becomes more likely to be reached if sellers maintain control.
Support Zone Between $3,705 and $3,650
The lower level is reinforced by the 61.8% Fibonacci retracement of the prior advance that began from the November 2024 swing low at $3,705. Then, a little lower is the 78.6% Fibonacci retracement for another prior upswing at $3,650. Taken together, these indicators show a support zone from $3,705 to $3,650. In addition, there was a small consolidation range from September 2025 in the same price zone that reinforces it as support. However, the more significant lower target is defined by the prior peak at $3,500 from April 2025.
Weekly Pattern Confirms Seller Control
The weekly chart reinforces the new sell signal, as gold is on track to complete a bearish weekly engulfing pattern if the week closes below last week’s low of $3,775. It adds to the bearish evidence that sellers have regained control and therefore increases the chance for lower targets to be reached unless buyers step in aggressively and provide a sign of strength. That lower target is further reinforced by the lower boundary of the falling trend channel.
If you’d like to know more about how to trade gold and silver, please visit our educational area.