



Spot gold (XAUUSD) continues to climb early Thursday, reaching a two-week high. The main catalysts for the price climb remain the same. Global crude oil prices continue to tumble and the U.S. midterm results are still weighing on Treasury yields and consequently the U.S. Dollar.
At 13:12 GMT, Spot Gold is trading $4120.10, up $59.75 or +1.47%.
The current two-day rise in spot gold marks its sharpest two-day rally since mid-August. Prices are up over $250 this week after the market hit a one-year low at $3870.32 on October 30.
The rally since the Democrats regained control of Congress on Tuesday night has been impressive. This event is likely driving down Treasury yields and the dollar. Both have hit multi-week lows.
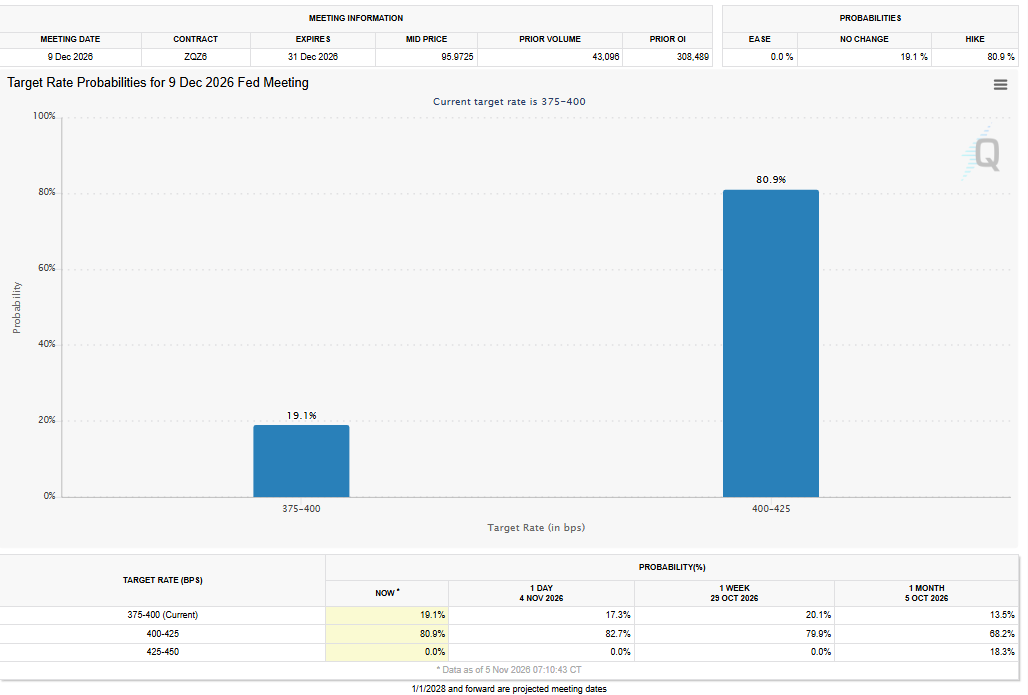
Meanwhile, crude oil’s dive under $100 a barrel is reducing inflation risks and the need for additional rate hikes by the Federal Reserve in December and early 2027. According to the CME’s FedWatch tool, the probability of a rate hike in December is now about 80%. Traders still have to deal with Friday’s Non-Farm Payrolls report.
Most of the current rally is likely short-covering-driven. During a prolonged move down in terms of price and time, the first leg up of a rally is driven by short-covering. Then there is a pullback that sets up the possibility of a potentially bullish secondary higher bottom.
Technically, rejection at the 50-day moving average could trigger the start of the pullback. Fundamentally, it could be the Non-Farm Payrolls report and increased chances of a Fed rate hike in December.
Daily Spot Gold (XAUUSD) Technical Analysis
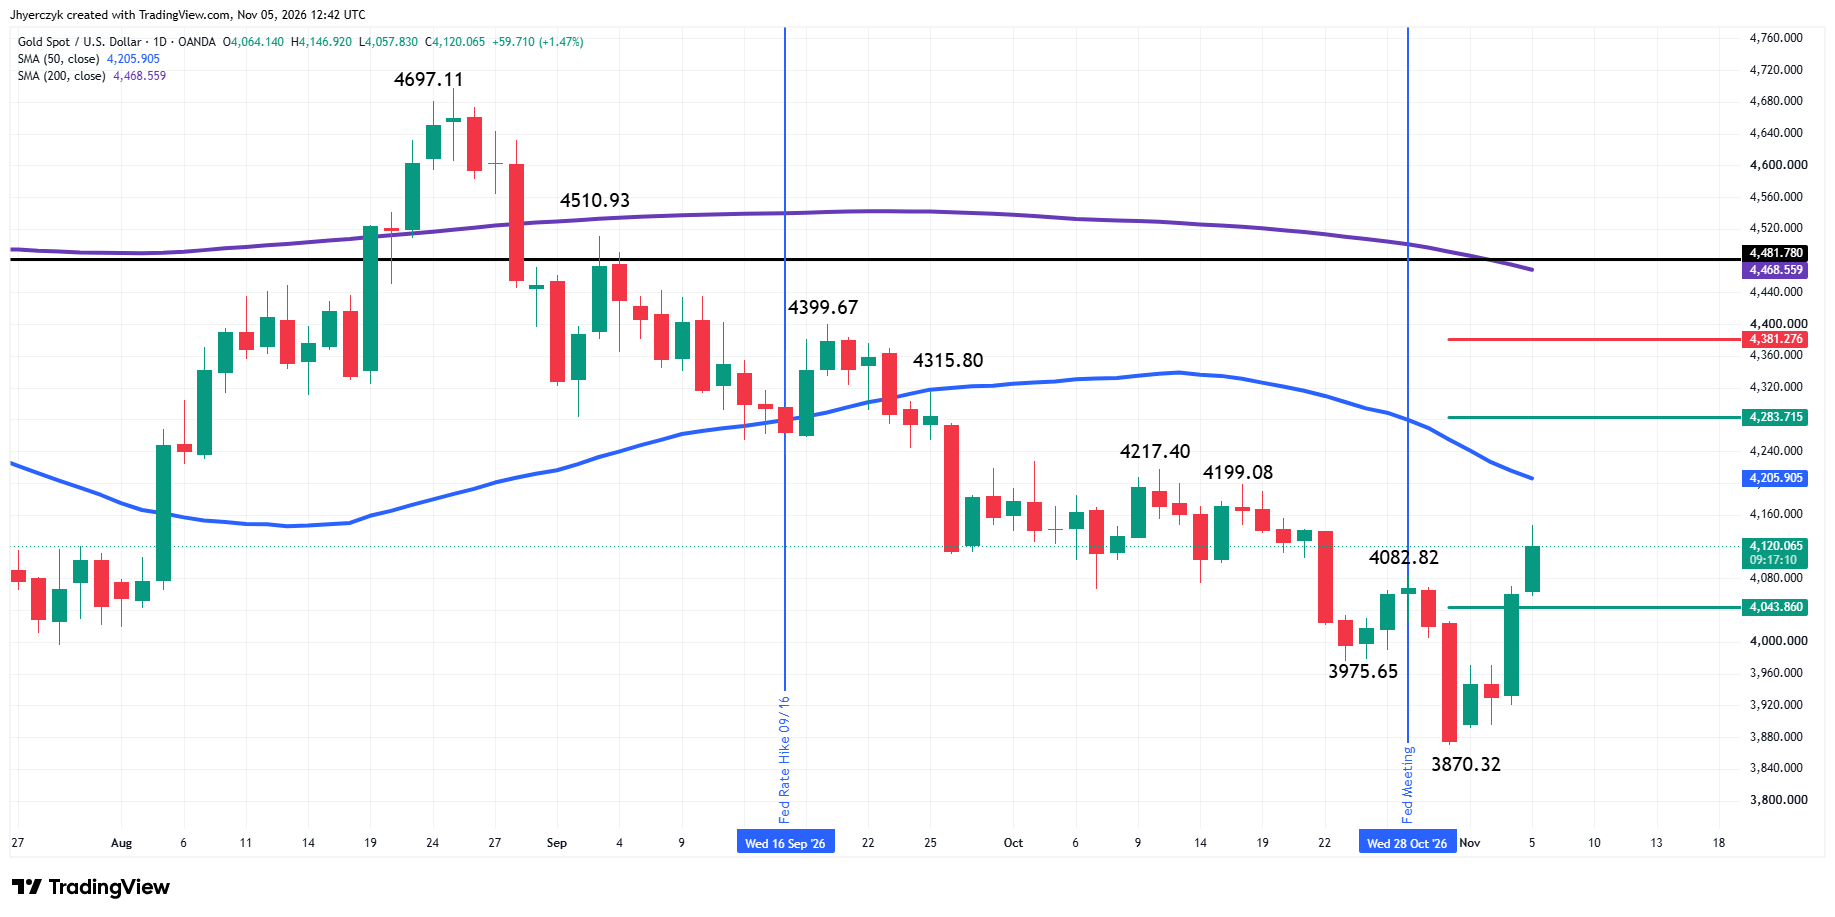
The strong rally in Spot Gold has put the market in a position to challenge the 50-day moving average after two days of surging prices.
The main trend is up according to the daily swing chart. It turned up early Thursday when buyers took out the swing top at $4082.82. New swing chart targets include a pair of October main tops at $4199.08 and $4217.40. A trade through the new main bottom at $3870.32 will change the main trend to down.
The short-term range is $4217.40 to $3870.32. With XAUUSD trading on the strong side of its 50% level at $4043.86, this level becomes new support.
The intermediate range is $4697.11 to $3870.32. Its retracement zone at $4283.72 to $4381.28 is the next major upside target zone.
In addition to swing tops at $4199.08 and $4217.40, gold traders are likely to face some headwinds at the 50-day moving average at $4205.91. This indicator is both potential resistance and a trigger point for an acceleration to the upside.
The 200-day moving average, which is also trending lower at $4468.56, comes in above the long-term retracement zone at $4283.72 to $4381.28. This area is shaping up to be a future major resistance zone.
Gold Price Forecast
Every new Gold analysis as it publishes, today's technical signal and key levels, live price — on one page.
See all Gold forecastsWeekly Spot Gold (XAUUSD) Technical Analysis
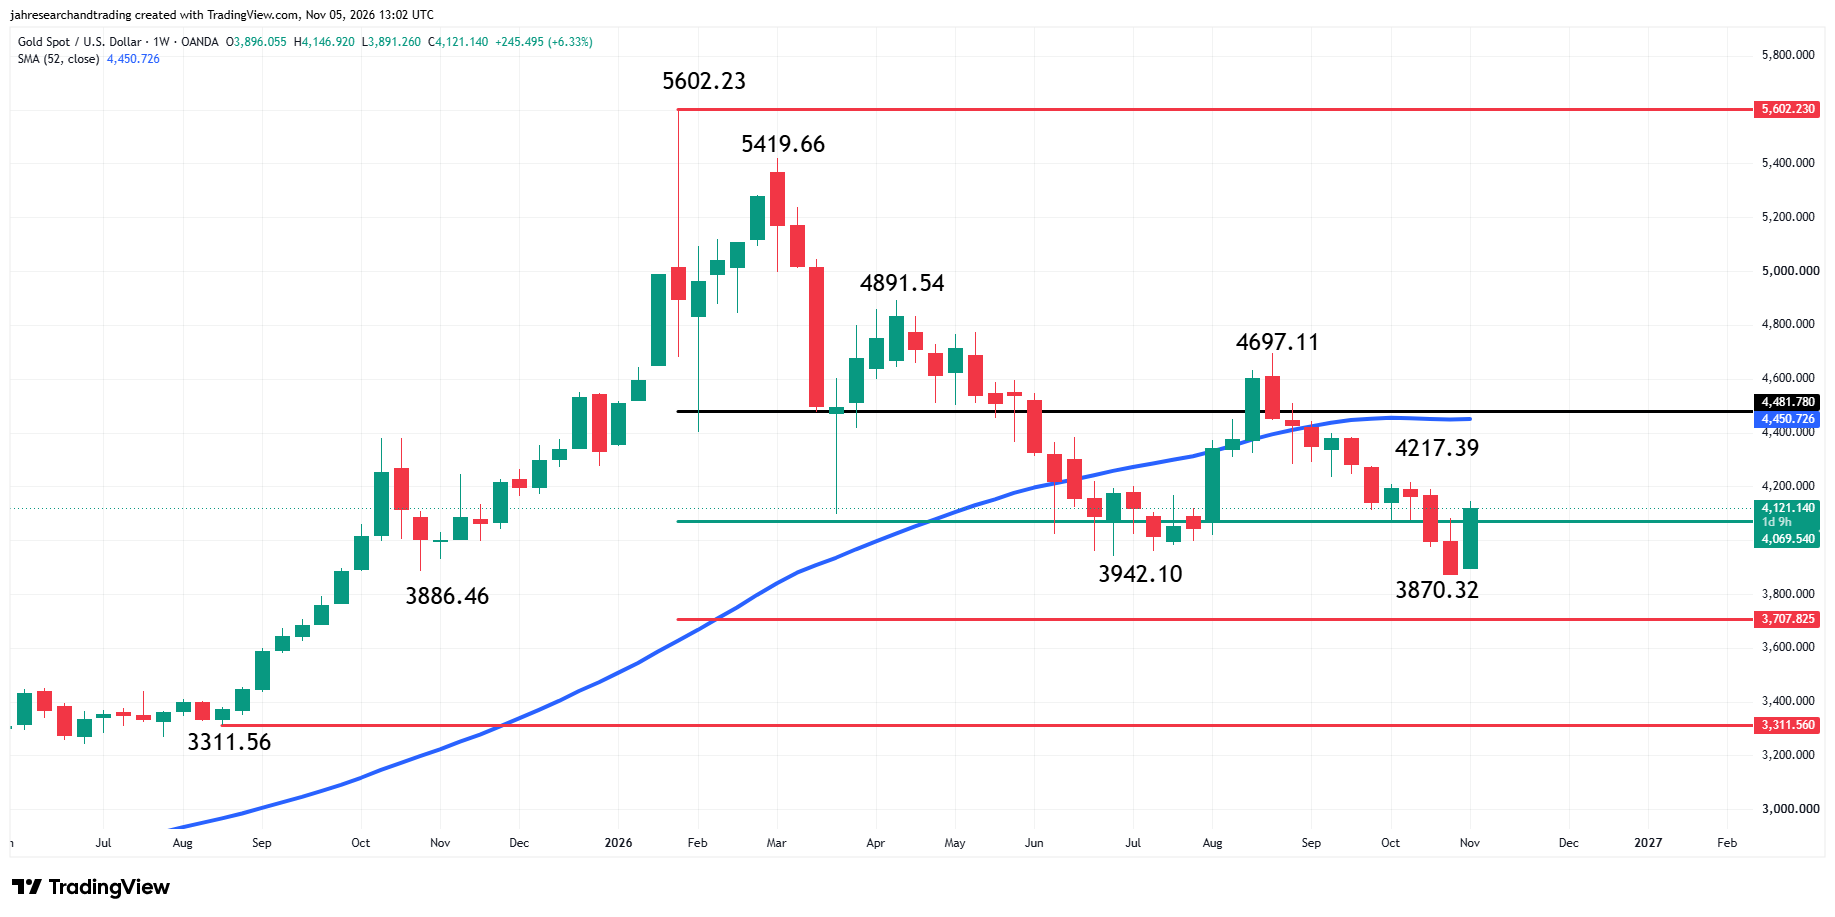
Spot gold is up over 6% on the weekly chart. Buyers came in early Monday before traders were able to take out last week’s low, suggesting they may have been looking for value or reacting to a technically oversold market.
The main trend is down according to the weekly swing chart. The main trend will change to up on a trade through $4697.11. A trade through $3870.32 will signal a resumption of the downtrend.
The minor trend is also down. A trade through $4217.39 will change the minor trend to up. This is likely to shift momentum to the upside.
The main range I am watching was formed by the November 2024 main bottom at $2536.85 and the January 2026 main top at $5602.23. As of early Thursday, gold has successfully tested its retracement zone at $4069.54 to $3707.82.
Not only did it form a new minor bottom at $3870.32 by taking out last week’s high, but it is also trading on the strong side of the 50% level at $4069.54. This puts the market in a position to challenge the key minor top at $4217.39.
Overtaking $4217.39 could create the upside momentum needed to challenge the 52-week moving average at $4450.73. This is followed by $4481.78, which is 20% down from the all-time high at $5602.23, the level that marks the start of the bear market.
What to Watch
Daily Spot Gold (XAUUSD)
My bias flipped to the upside when spot gold changed the main trend to up on the breakout over $4082.82. That’s mostly my short-term view. It’s going to have to overtake the 50-day moving average at $4205.91 in order to reinforce my upside bias.
Crossing the 50-day moving average will not only put XAUUSD in a position to strengthen the swing-chart uptrend, but it could create enough upside momentum to challenge and overtake the retracement zone at $4283.72 to $4381.28. This will put the 200-day moving average at $4468.56 on the radar.
Additionally, overtaking $4481.78 will take spot gold out of its current bear market, but it won’t mean a new bull market has started.
Weekly Spot Gold (XAUUSD)
Recapturing the $4069.54 pivot has shifted my bias to the upside. It will strengthen if buyers can overcome $4217.39.
If you’d like to know more about how to trade gold, please visit our educational area.