



Gold Traders Search for a Bottom
Spot gold is under pressure again early Friday, extending this week’s decline. The selling has traders looking for a place where buyers may step in, but I think it may take more than a test of a previous swing bottom to stop the break.
Looking back at the rally in late 2025 to the record high on January 29, spot gold moved quickly through many of the prices now being tested. Buyers were aggressively taking out offers as the fear of missing out fueled the advance. In my opinion, much of that move was driven by momentum and speculation, with larger bids likely sitting well below the breakout prices.
That matters on the way down. Some of the small one- and two-bar swing bottoms formed during the rally may produce a bounce. However, they don’t necessarily represent areas where buyers spent enough time establishing a base. I wouldn’t assume that each one will provide enough support to turn the market higher.
I think a major bottom is more likely to be formed by an event that changes traders’ outlook, followed by a chart pattern showing that buyers are willing to step in. An event such as next week’s options expiration could produce a temporary bottom, but that doesn’t mean it will end the broader decline. A bigger event like a clear sign that the Fed is done hiking rates may deliver the best bullish signal. However, until that time, we’re likely entering the sell the rally phase, if we’re not already in it.
One place to start looking for longer-term value is $2801.11, approximately 50% of the record high. From there, I would work back up the chart to identify the major support areas that may attract buyers before the market reaches that level. That doesn’t mean gold has to trade at $2801.11. It means I’m keeping the level in view while watching for an event and a pattern that could signal a change in momentum.
Fed’s Role as a Catalyst
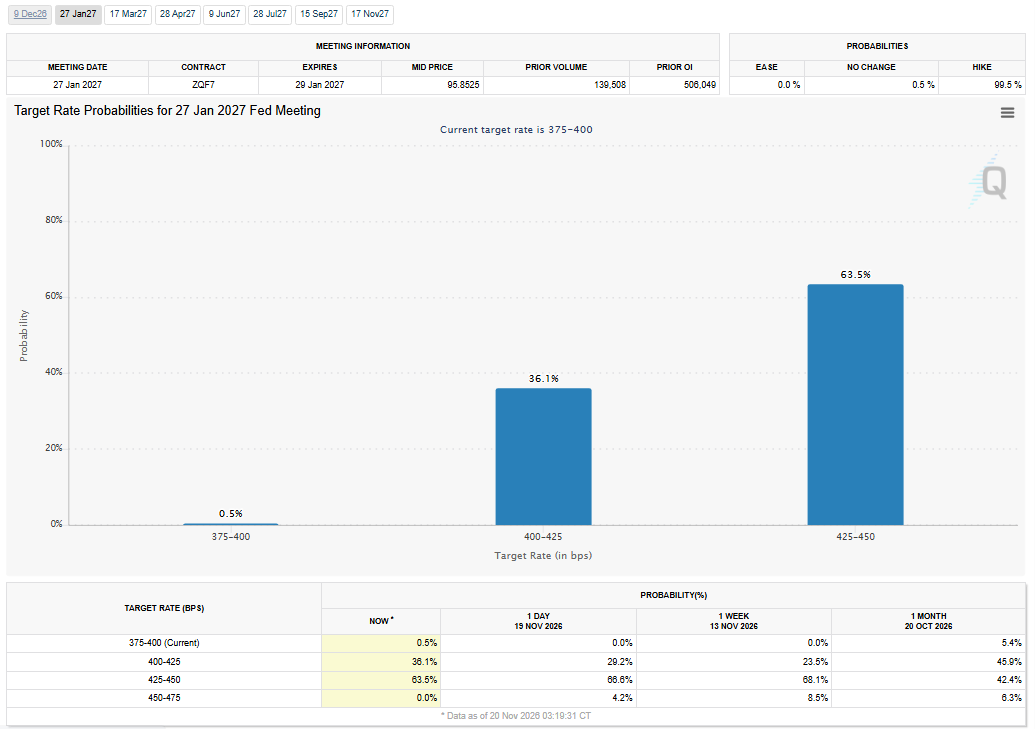
If you look back at 2025, gold started to climb more violently after the September monetary policy meeting. Something at that meeting or in the Fed statement planted the seed for at least two more rate cuts, but speculators carried it further, calling for as many as three into 2026. However, those thoughts came to a screeching halt a day after the January meeting when gold hit its record high at $5602.23. Within three days it had declined 20%. That meant that gold had flipped from bull market to bear market, according to classic technical analysis.
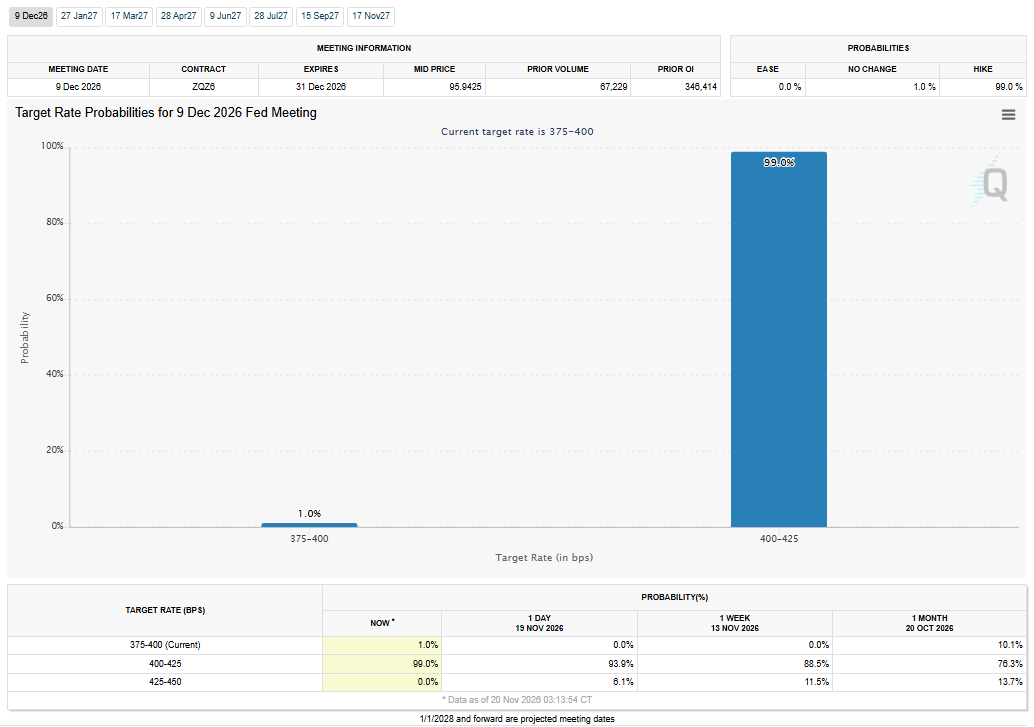
Throughout the year, spot gold zigged and zagged, but the common theme on the charts was lower tops and lower bottoms. The move essentially followed the peeling back of Fed rate cut expectations until August 25 when sellers became convinced the Fed was going to raise rates in September, and they did. The Fed passed in October, but that wasn’t enough to fuel a rally. It basically slowed the selling.
The selling pressure picked up again in early November with the higher-than-expected CPI report. This followed the bull trap set by traders that drove prices to $4148.71 on November 9. Now the market is in a freefall and there appears to be nothing to stop the selling except for a series of minor bottoms from 2025.
Gold Price Forecast
Every new Gold analysis as it publishes, today's technical signal and key levels, live price — on one page.
See all Gold forecastsIn my opinion, the market will continue to weaken until it hits a price area that had been visited and supported by large buyers in the past. Minor bottoms formed on the way up are not going to be strong enough to stop the price slide.
Daily Spot Gold (XAUUSD) Technical Analysis
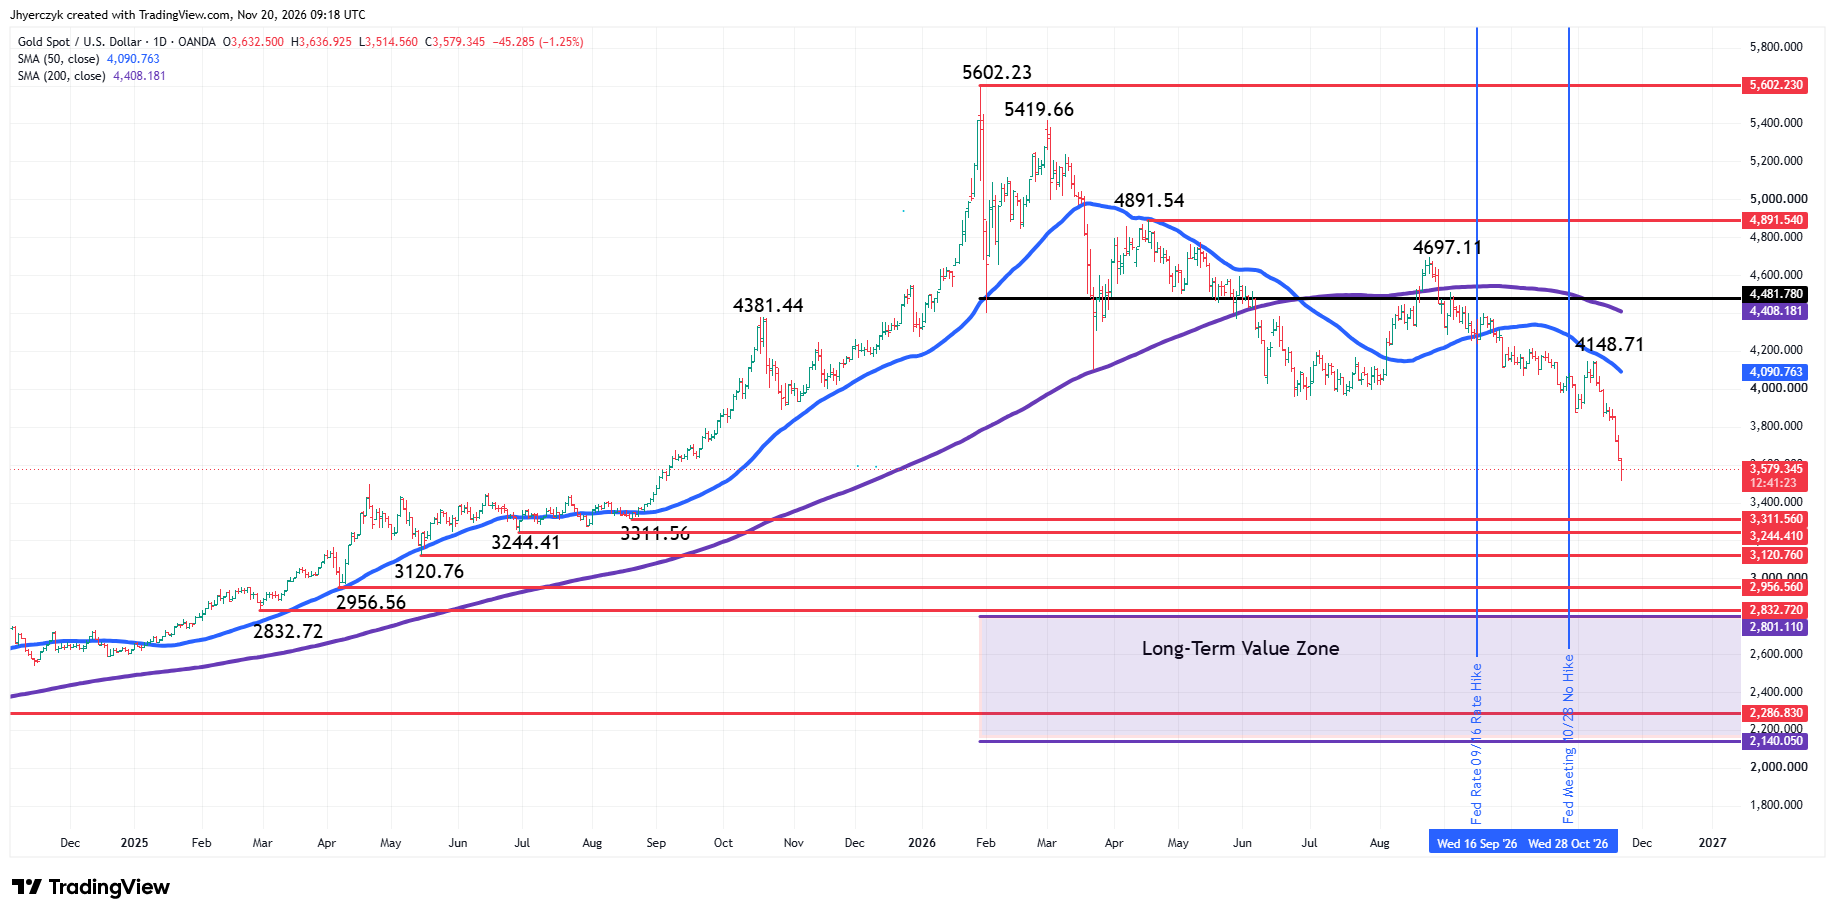
Spot gold is sharply lower early Friday, continuing the current steep sell-off that was set in motion on Thursday, November 12, when sellers took out the Friday, October 30 swing bottom at $3870.32.
The next downside targets are a series of main bottoms from 2025, ranging from $3311.56 on August 20 to $2832.72 on February 28. Any one of these levels could be targeted on this current retreat, but the strongest are the better constructed swing bottoms at $3120.76, $2956.56 and $2832.72.
The market is currently trading inside the major upswing in 2025 from $3311.56 to $4381.44. As you can see from the chart, there were few swings inside this rally and the ones produced were one- and two-day moves.
This tells me that traders weren’t passively bidding at that time. They were aggressively taking out offers. This often indicates that there wasn’t a major buyer in there because they aren’t known to chase markets higher, since they usually have the size to stop a decline. What we’re likely looking at when analyzing that area is a lot of aggressive speculative buying, which is one reason why the market is currently slicing through this area.
The value areas, or places that may have had buyers with size, are more likely to attract new money, which is why I think the selling volatility may begin to slow inside $3311.56 to $2832.72. To put it another way, in this range, more serious buyers are likely to show up.
What to Watch
At the start of today’s session, my bias is to the downside with $3311.56 my first key target. Given the prolonged move down in terms of price and time, I am fully aware that the market is inside the window of time for a daily closing price reversal bottom. It could be dramatic, too. If I see that pattern form on the daily chart, then my bias will weaken. If the chart pattern is confirmed, I may change my outlook to bullish to take advantage of a possible counter-trend rally.
If you’d like to know more about how to trade gold, please visit our educational area.