


Gold Pauses Before Inflation Test as Central Banks Keep Buying
Gold eased on Tuesday as investors took profits after a 1% rise on Monday, ahead of US consumer inflation data due later in the day, Reuters reported. Spot gold was down 0.6% at $4,114.48 by 04:30 GMT, while central bank buying continues to support the longer-term picture.
Gold: Oil Relief Meets Fed Pressure
Monday’s gain came as lower crude prices eased inflation fears and a softer dollar made bullion cheaper for buyers holding other currencies, Reuters said. Heraeus said Brent fell nearly 9% in one session last week on hopes that a Democrat-controlled Congress would help end the Iran war.
The Fed remains the main obstacle. US employers added 165,000 jobs in October, according to the BLS, far above the 65,000 economists expected. Unemployment fell to 4.1% and average hourly earnings rose 0.4%. Traders now see an 84% chance of a December rate hike, Reuters reported. Gold pays no interest, so higher rates raise the cost of holding it. Richmond Fed President Tom Barkin said on Monday the Fed should move “with care” and that he has no base case for December. After today’s CPI report, producer prices follow on Friday.
Official Buying Accelerates
China’s central bank added about 25.8 tonnes of gold to its reserves in October, official data showed, extending its buying streak to 24 months. Central banks and other official institutions bought 321 tonnes in the third quarter, 42% more than a year earlier, the World Gold Council’s Gold Demand Trends report shows. Heraeus noted that was well above the five-year quarterly average of 227 tonnes, and that purchases in the first nine months reached 675 tonnes, 6% ahead of the same period in 2025.
That buying did not stop gold from falling more than 15% from its late-August high, though. In my view, official demand sets a floor over months, not days, while rate expectations still drive the daily moves.
Gold Price Forecast
Every new Gold analysis as it publishes, today's technical signal and key levels, live price — on one page.
See all Gold forecastsSilver: Recovery Faces Headwinds
Silver outpaced gold on Monday and was down 0.5% at $53.14 on Tuesday, Reuters reported. Heraeus said silver fell below $50 to a 2026 low just under $49 before rebounding above $52. Even so, the metal remains well below its June and July range, and the rebound “has so far recovered only a small part of the preceding decline,” Heraeus said.
Gold Technical Analysis: XAU/USD Holds $4,088 as $4,147 Caps the Rally
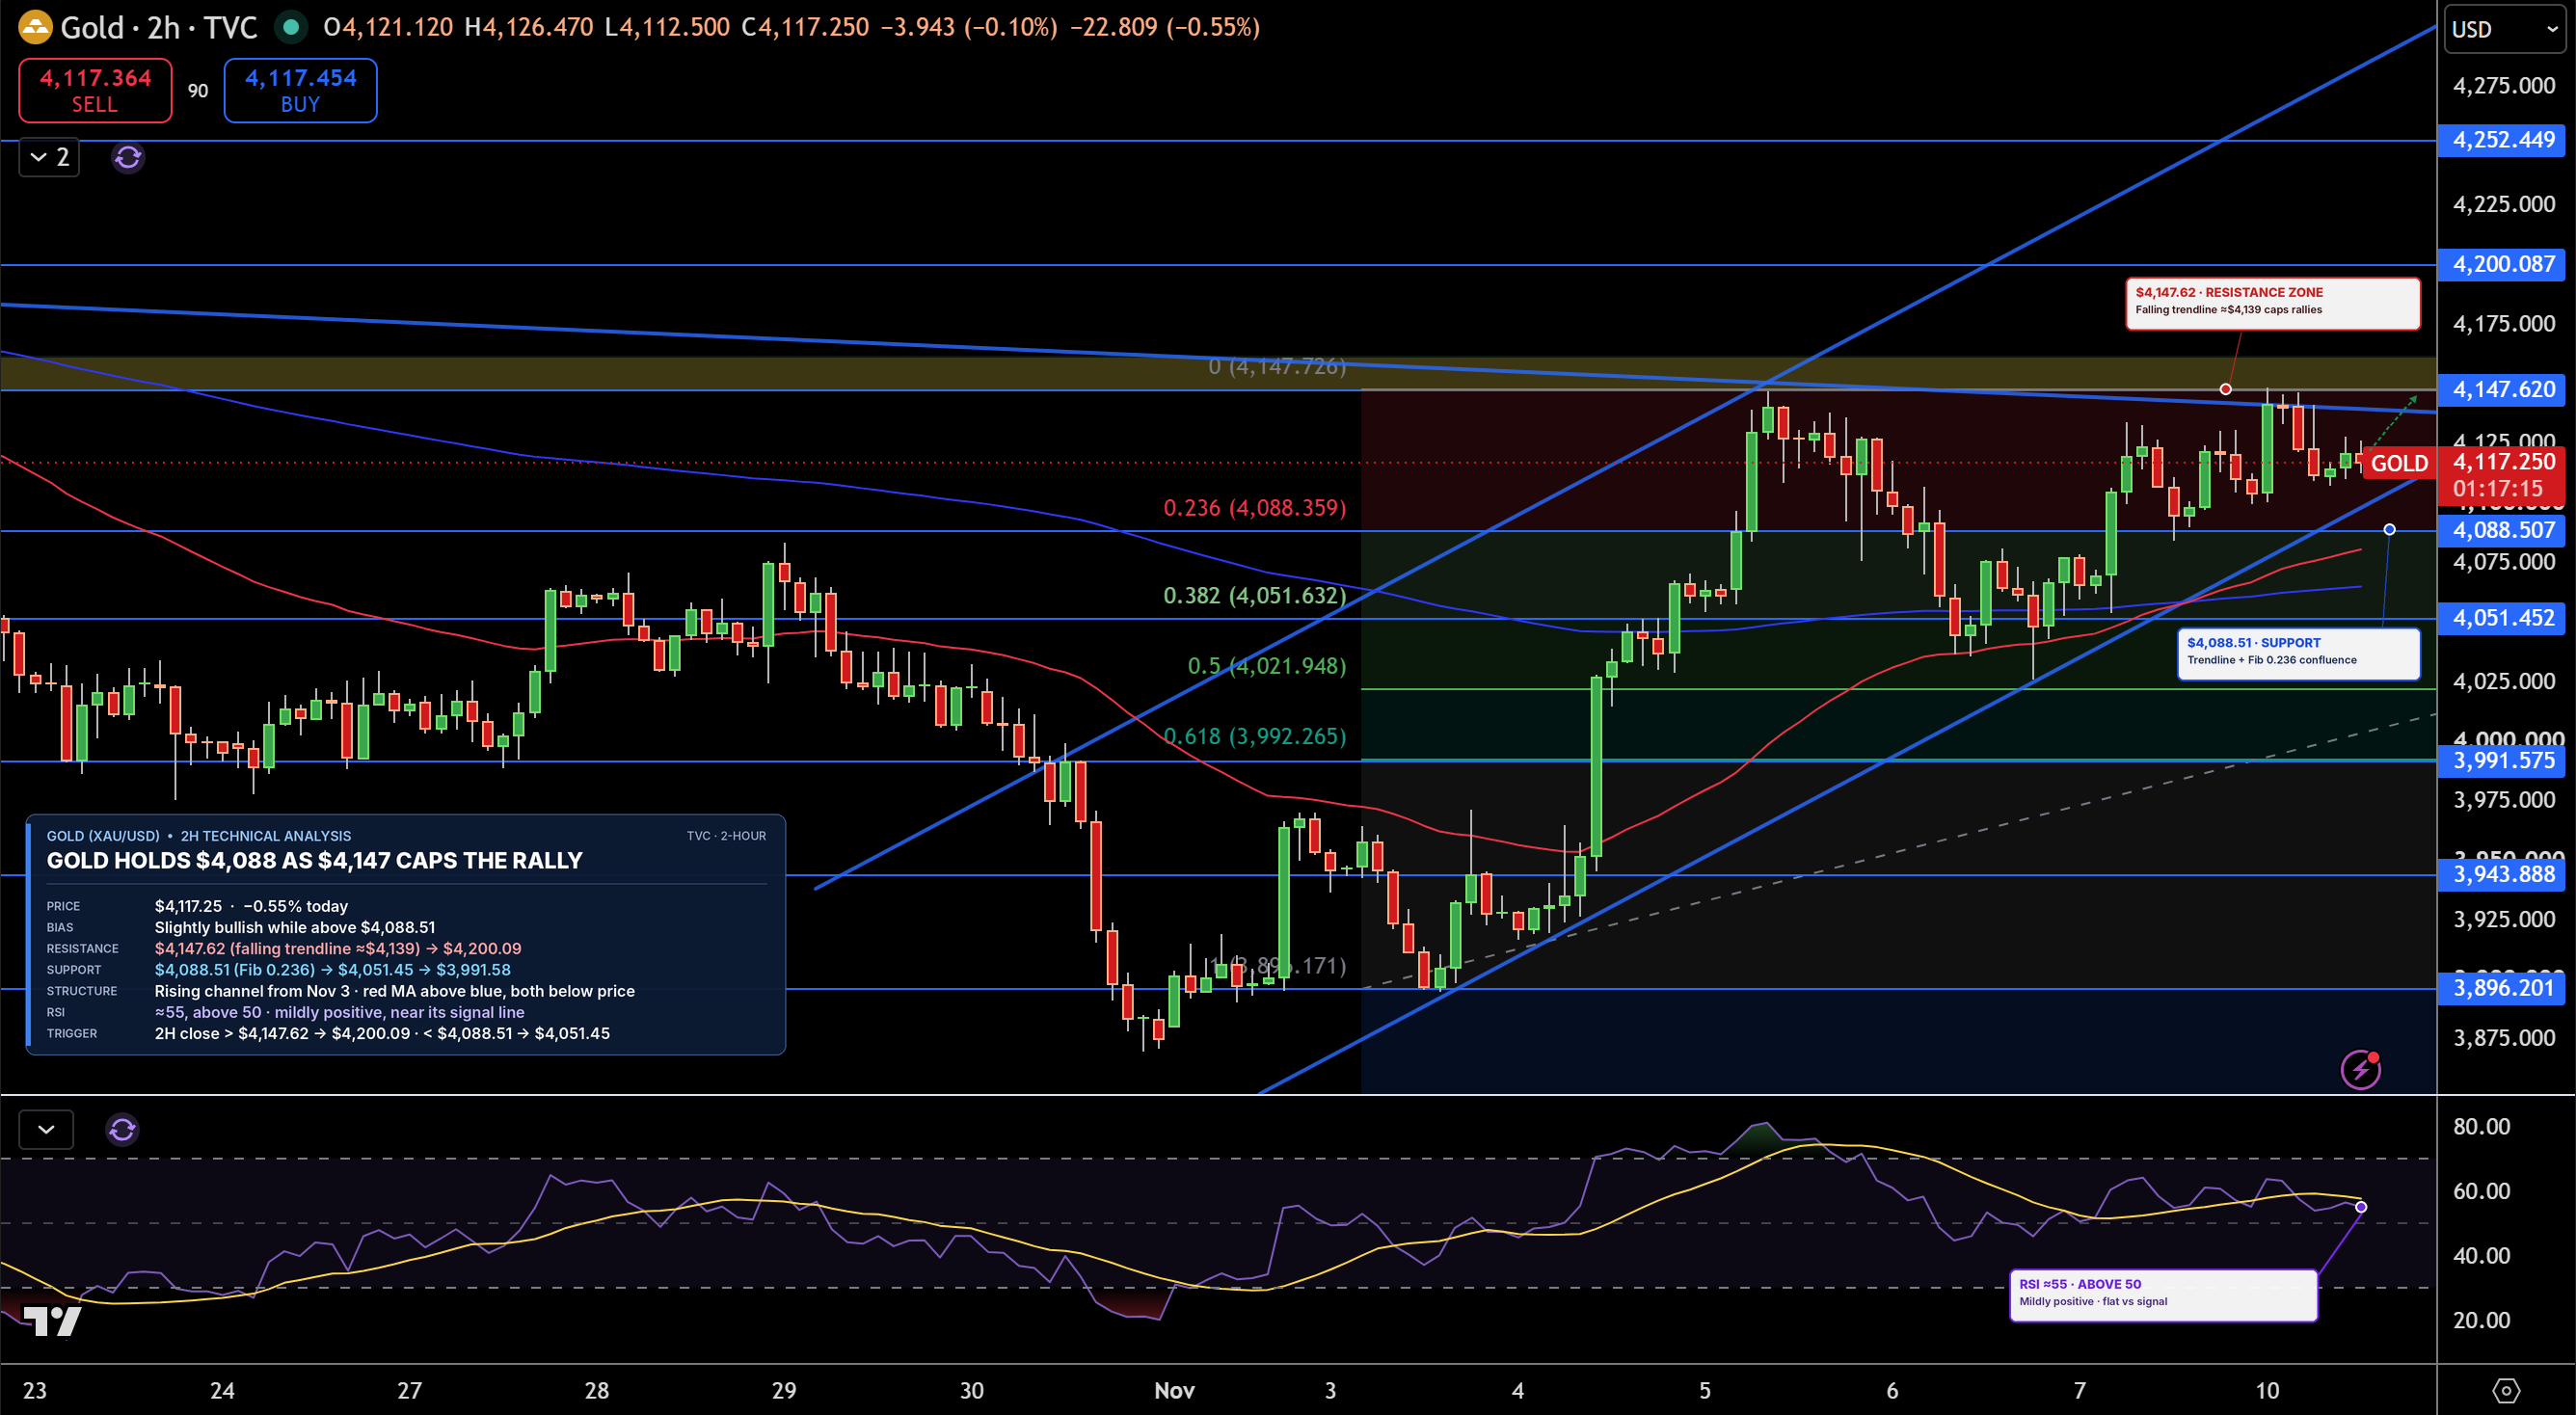
Gold is trading near $4,117 on the 2-hour chart. Prices are climbing along a rising trendline, a line connecting higher lows since November 3, but a longer falling trendline has stopped every rally near the $4,147 zone. Both moving averages, which track average prices over time, are below price, and the faster one has crossed above the slower one.
Resistance, where sellers may return, is $4,147, then $4,200. Support, where buyers may step in, is $4,088, then $4,051. RSI, a 0 to 100 gauge of buying and selling strength, is near 55, mildly positive. I lean slightly bullish while gold holds $4,088. A close above $4,147 would break the falling trendline and open $4,200, while a drop below $4,088 would point to $4,051.
Silver Technical Analysis: XAG/USD Rejected at $53.42 Trendline as $51.27 Comes Into Focus
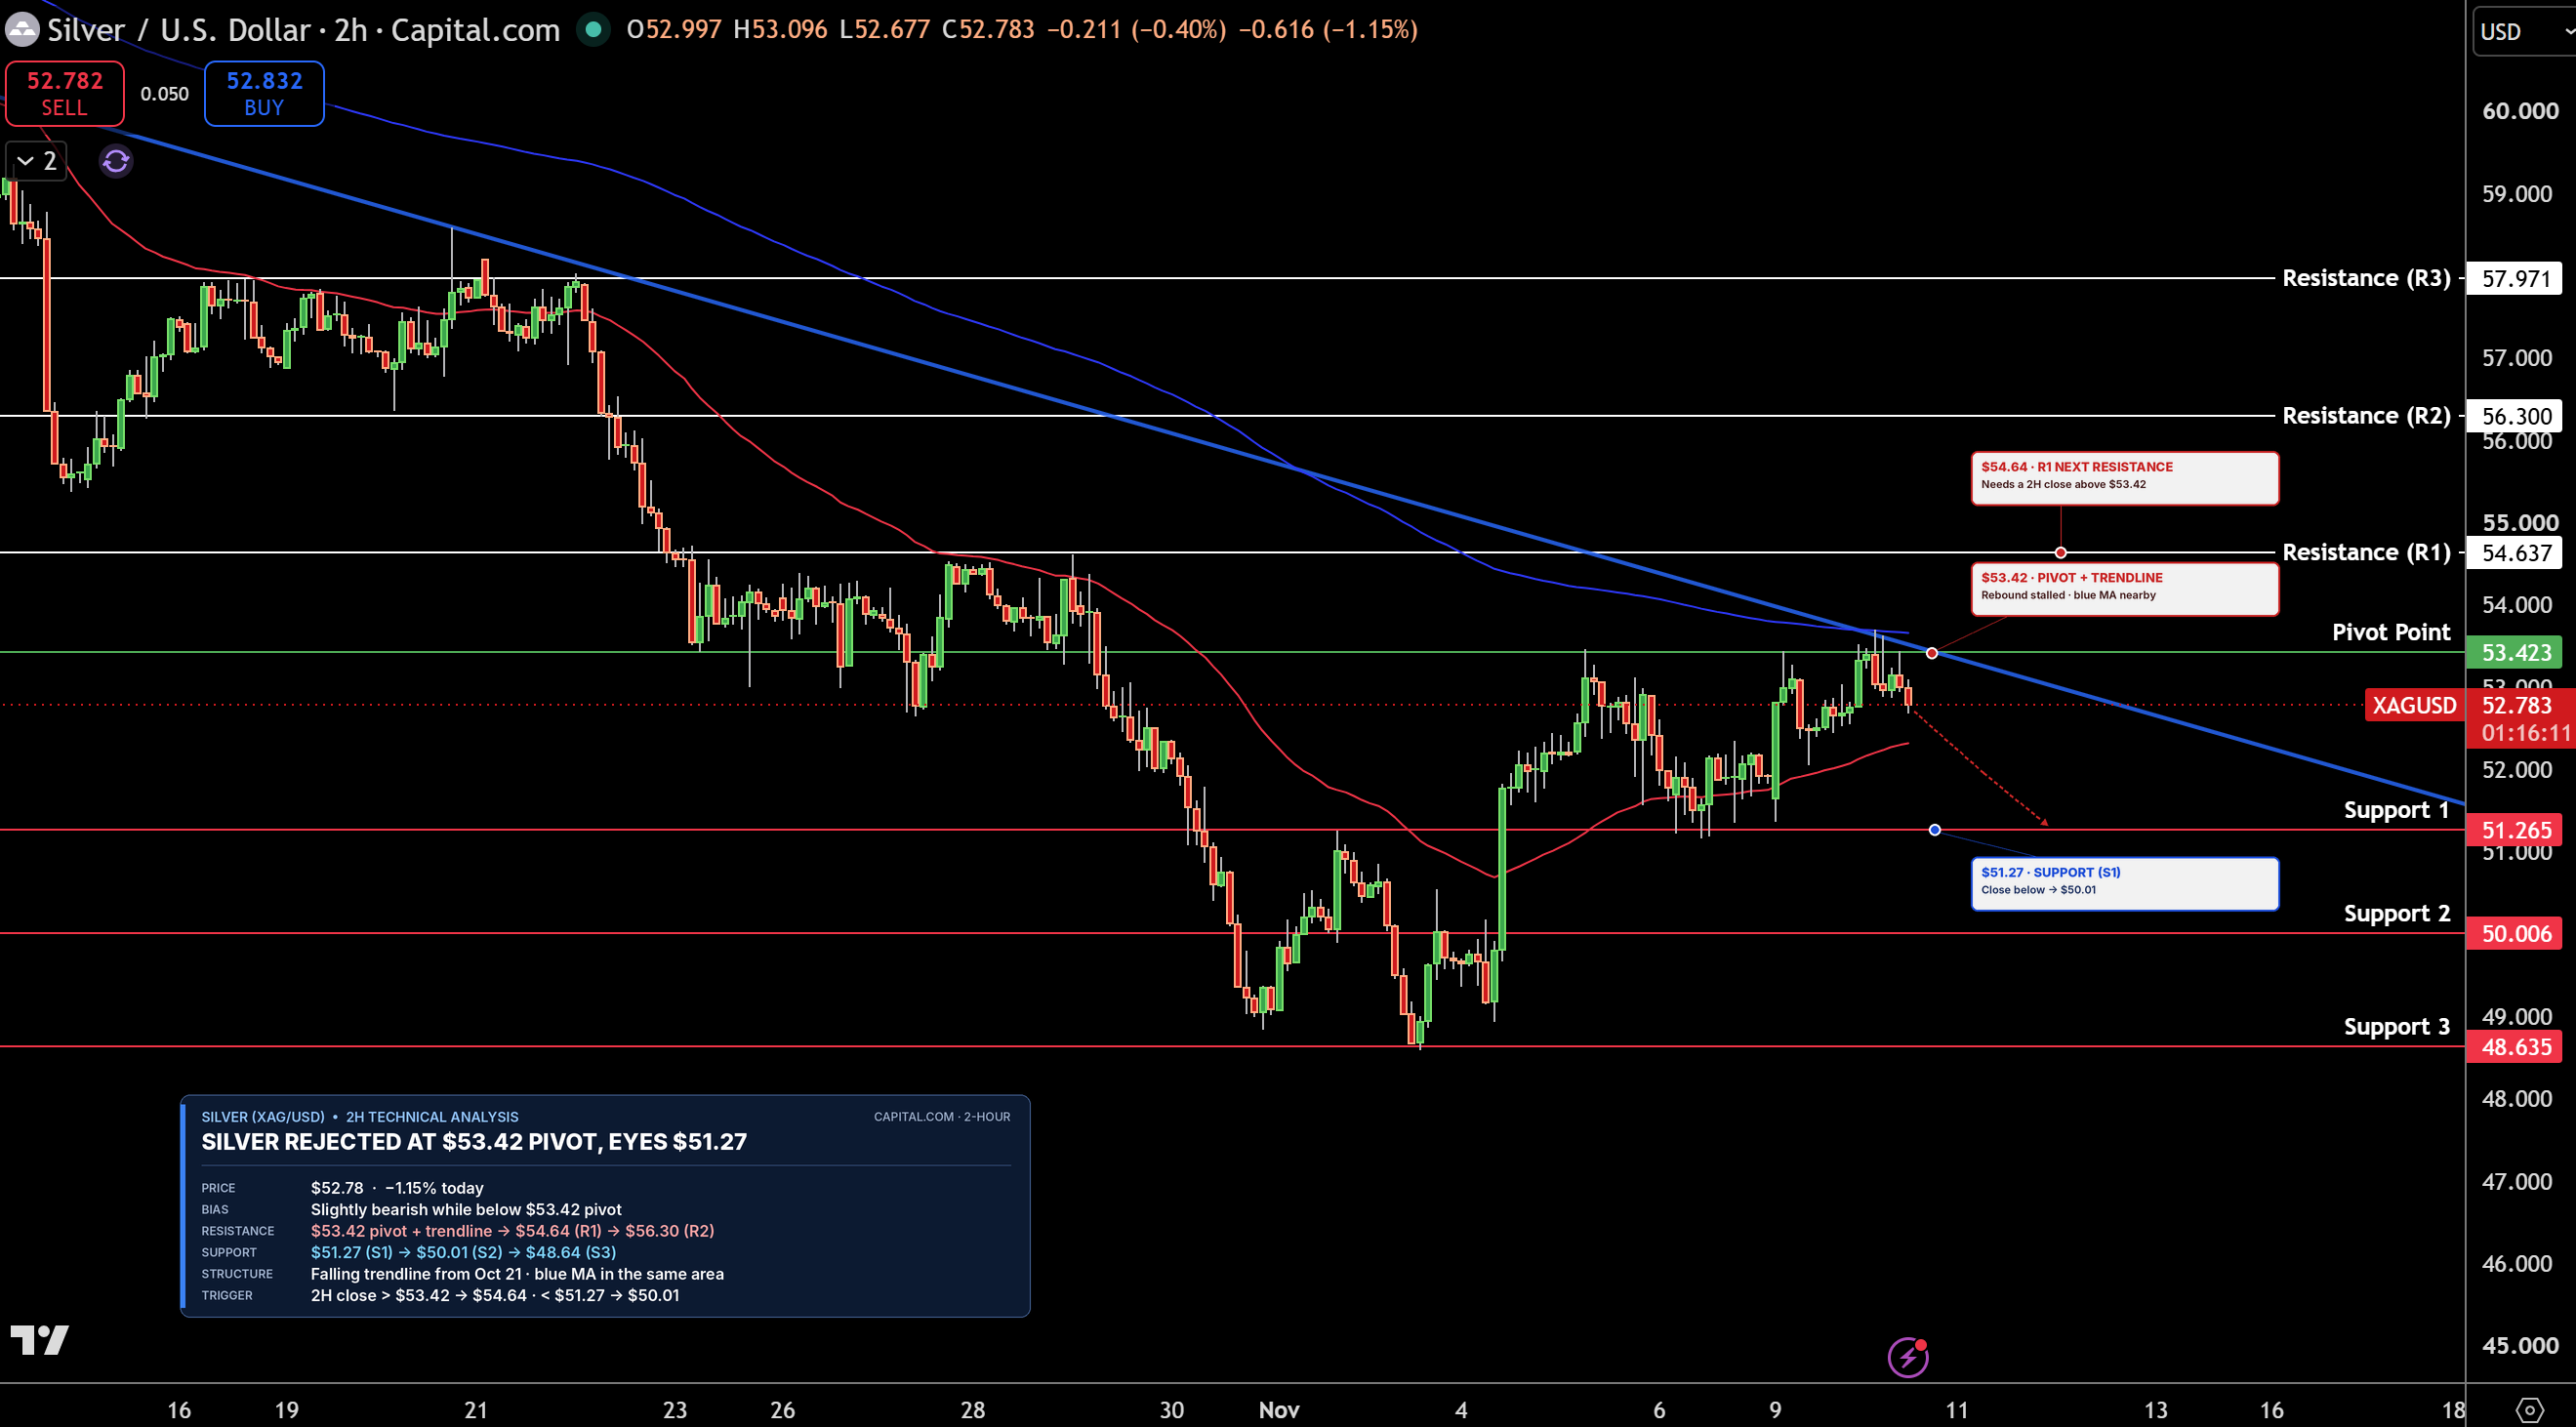
Silver is trading near $52.78 on the 2-hour chart. The rebound stalled at $53.42, the pivot point, a level calculated from the previous period’s high, low and close that traders use to judge direction. That level also lines up with the falling trendline from October 21 and the slower moving average.
Support is $51.27, then $50.01. Resistance is $53.42, then $54.64. Three barriers meeting at one level make $53.42 the line that matters, and the bias is a slight bearish lean while silver stays below it. A close above $53.42 would confirm a trendline break and open $54.64, while a drop below $51.27 would point to $50.01.