



Oil edged higher on Friday after Houthi missile attacks on Riyadh revived supply concerns, but both benchmarks were set to fall for the third week in a row, Reuters reported. Brent traded near $92.22 at 0118 GMT, while the more active January WTI contract traded near $82.64. The December WTI contract expires on Friday.
Brent: Riyadh Attacks Revive Supply Worries
“Concerns over Middle Eastern crude oil supplies have resurfaced due to attacks on Riyadh by the Houthis, prompting buying,” said Satoru Yoshida, an analyst at Rakuten Securities. He added that expectations OPEC+ will keep its coordinated production cuts at its meeting later this month are also lending support. OPEC+ ministers will hold a series of meetings on November 29 to decide their 2027 output policy. Separately, Iran’s Revolutionary Guards Navy said in a statement carried by state media on Thursday that two oil tankers hit naval mines in the Strait of Hormuz.
Still, crude shipments through Hormuz have returned to roughly pre-war levels, feeding expectations of a supply surplus, Reuters said. The leaders of the US, China and Russia met in Shenzhen on Thursday, and their joint declaration said they planned to increase refined petroleum production and supply, Deseret News reported. The declaration did not mention Iran or Ukraine. In a separate meeting with Xi, Trump said the two countries shared an interest in keeping oil flowing through Hormuz. In my view, the November 29 OPEC+ meeting is now the bigger test for Brent, since the Hormuz flows have already eased the supply side.
WTI: Russian Supply Under Strain
Russian crude output could fall again as Ukrainian attacks on refineries and export infrastructure intensify, analysts and traders told Reuters. Ukrainian drone attacks have already cut Russian refineries’ combined crude processing by 45% since late October, Reuters reported on Wednesday.
In the US, the EIA’s Weekly Petroleum Status Report on Wednesday showed crude stocks rose by 3.4mn barrels, while gasoline stocks jumped 5.2mn barrels. A build means more crude came in than was used that week. For more on WTI, see FXEmpire’s WTI crude oil forecasts.
Natural Gas Price Forecast
Every new Natural Gas analysis as it publishes, today's technical signal and key levels, live price — on one page.
See all Natural Gas forecastsNatural Gas: Smaller Build, Same Surplus
US natural gas storage rose by 20bn cubic feet (Bcf) in the week ended November 13, the EIA’s storage report showed, below NGI’s 24 Bcf estimate but above the five-year average build of 15 Bcf. That left inventories 80 Bcf above the five-year average and 66 Bcf below year-ago levels, NGI reported.
Natural gas futures still retreated on Thursday, giving back Wednesday’s sharp gains, as comfortable inventories and uncertainty over heating demand heading into Thanksgiving outweighed the smaller build, NGI said.
Brent Technical Analysis: Oil Holds $91.87 Pivot as Triangle Breakout Nears
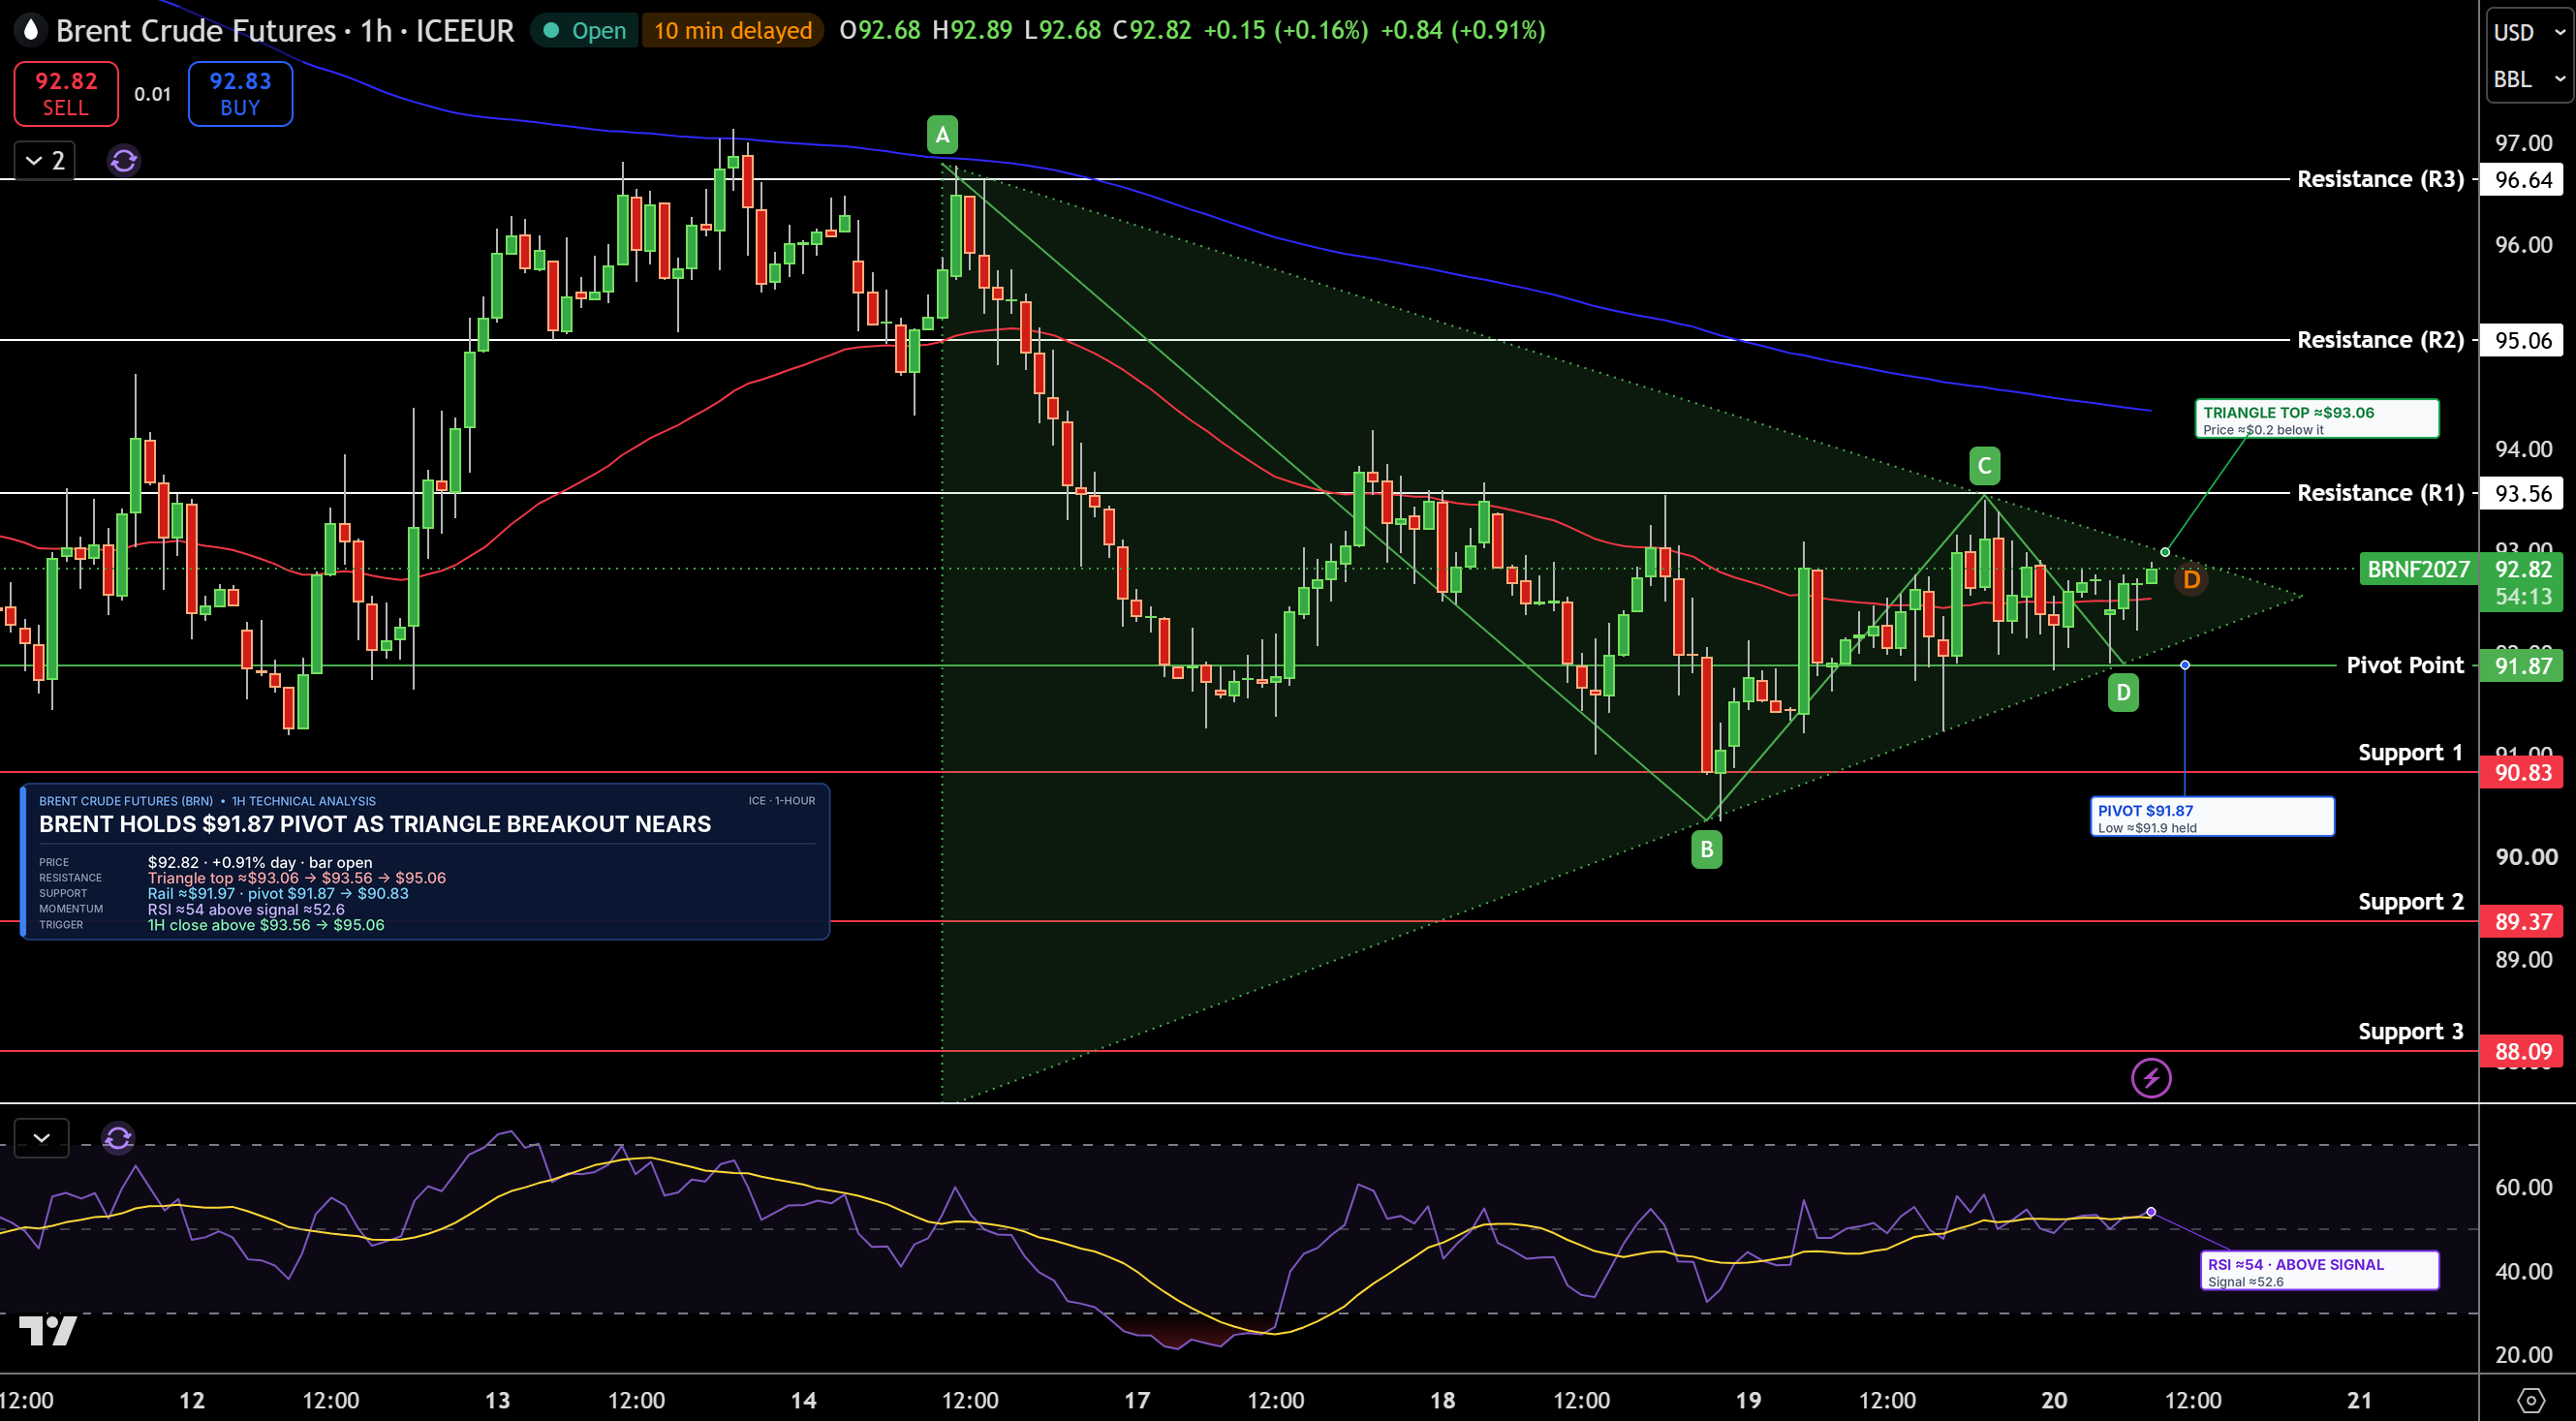
January Brent futures are trading near $92.82 on the 1-hour chart. Brent is trading inside a triangle, a pattern where price swings get smaller before a bigger move. Buyers defended $91.87, the pivot point, a level calculated from the previous period’s high, low and close that traders use to judge direction, and prices are now pressing against the top of the triangle.
A close above $93.56, the first resistance, where sellers may return, would confirm a breakout and open the way for $95.06. On the downside, $91.87 is the support to watch, where buyers may step in, and a drop below it would point to $90.83. RSI, a 0 to 100 gauge of buying and selling strength, is near 54 and above its signal line, a slower average of RSI, so momentum favors buyers slightly. I see a slight bullish lean while Brent holds $91.87.
Natural Gas Technical Analysis: NG Holds $3.23 Pivot After $3.39 Rejection
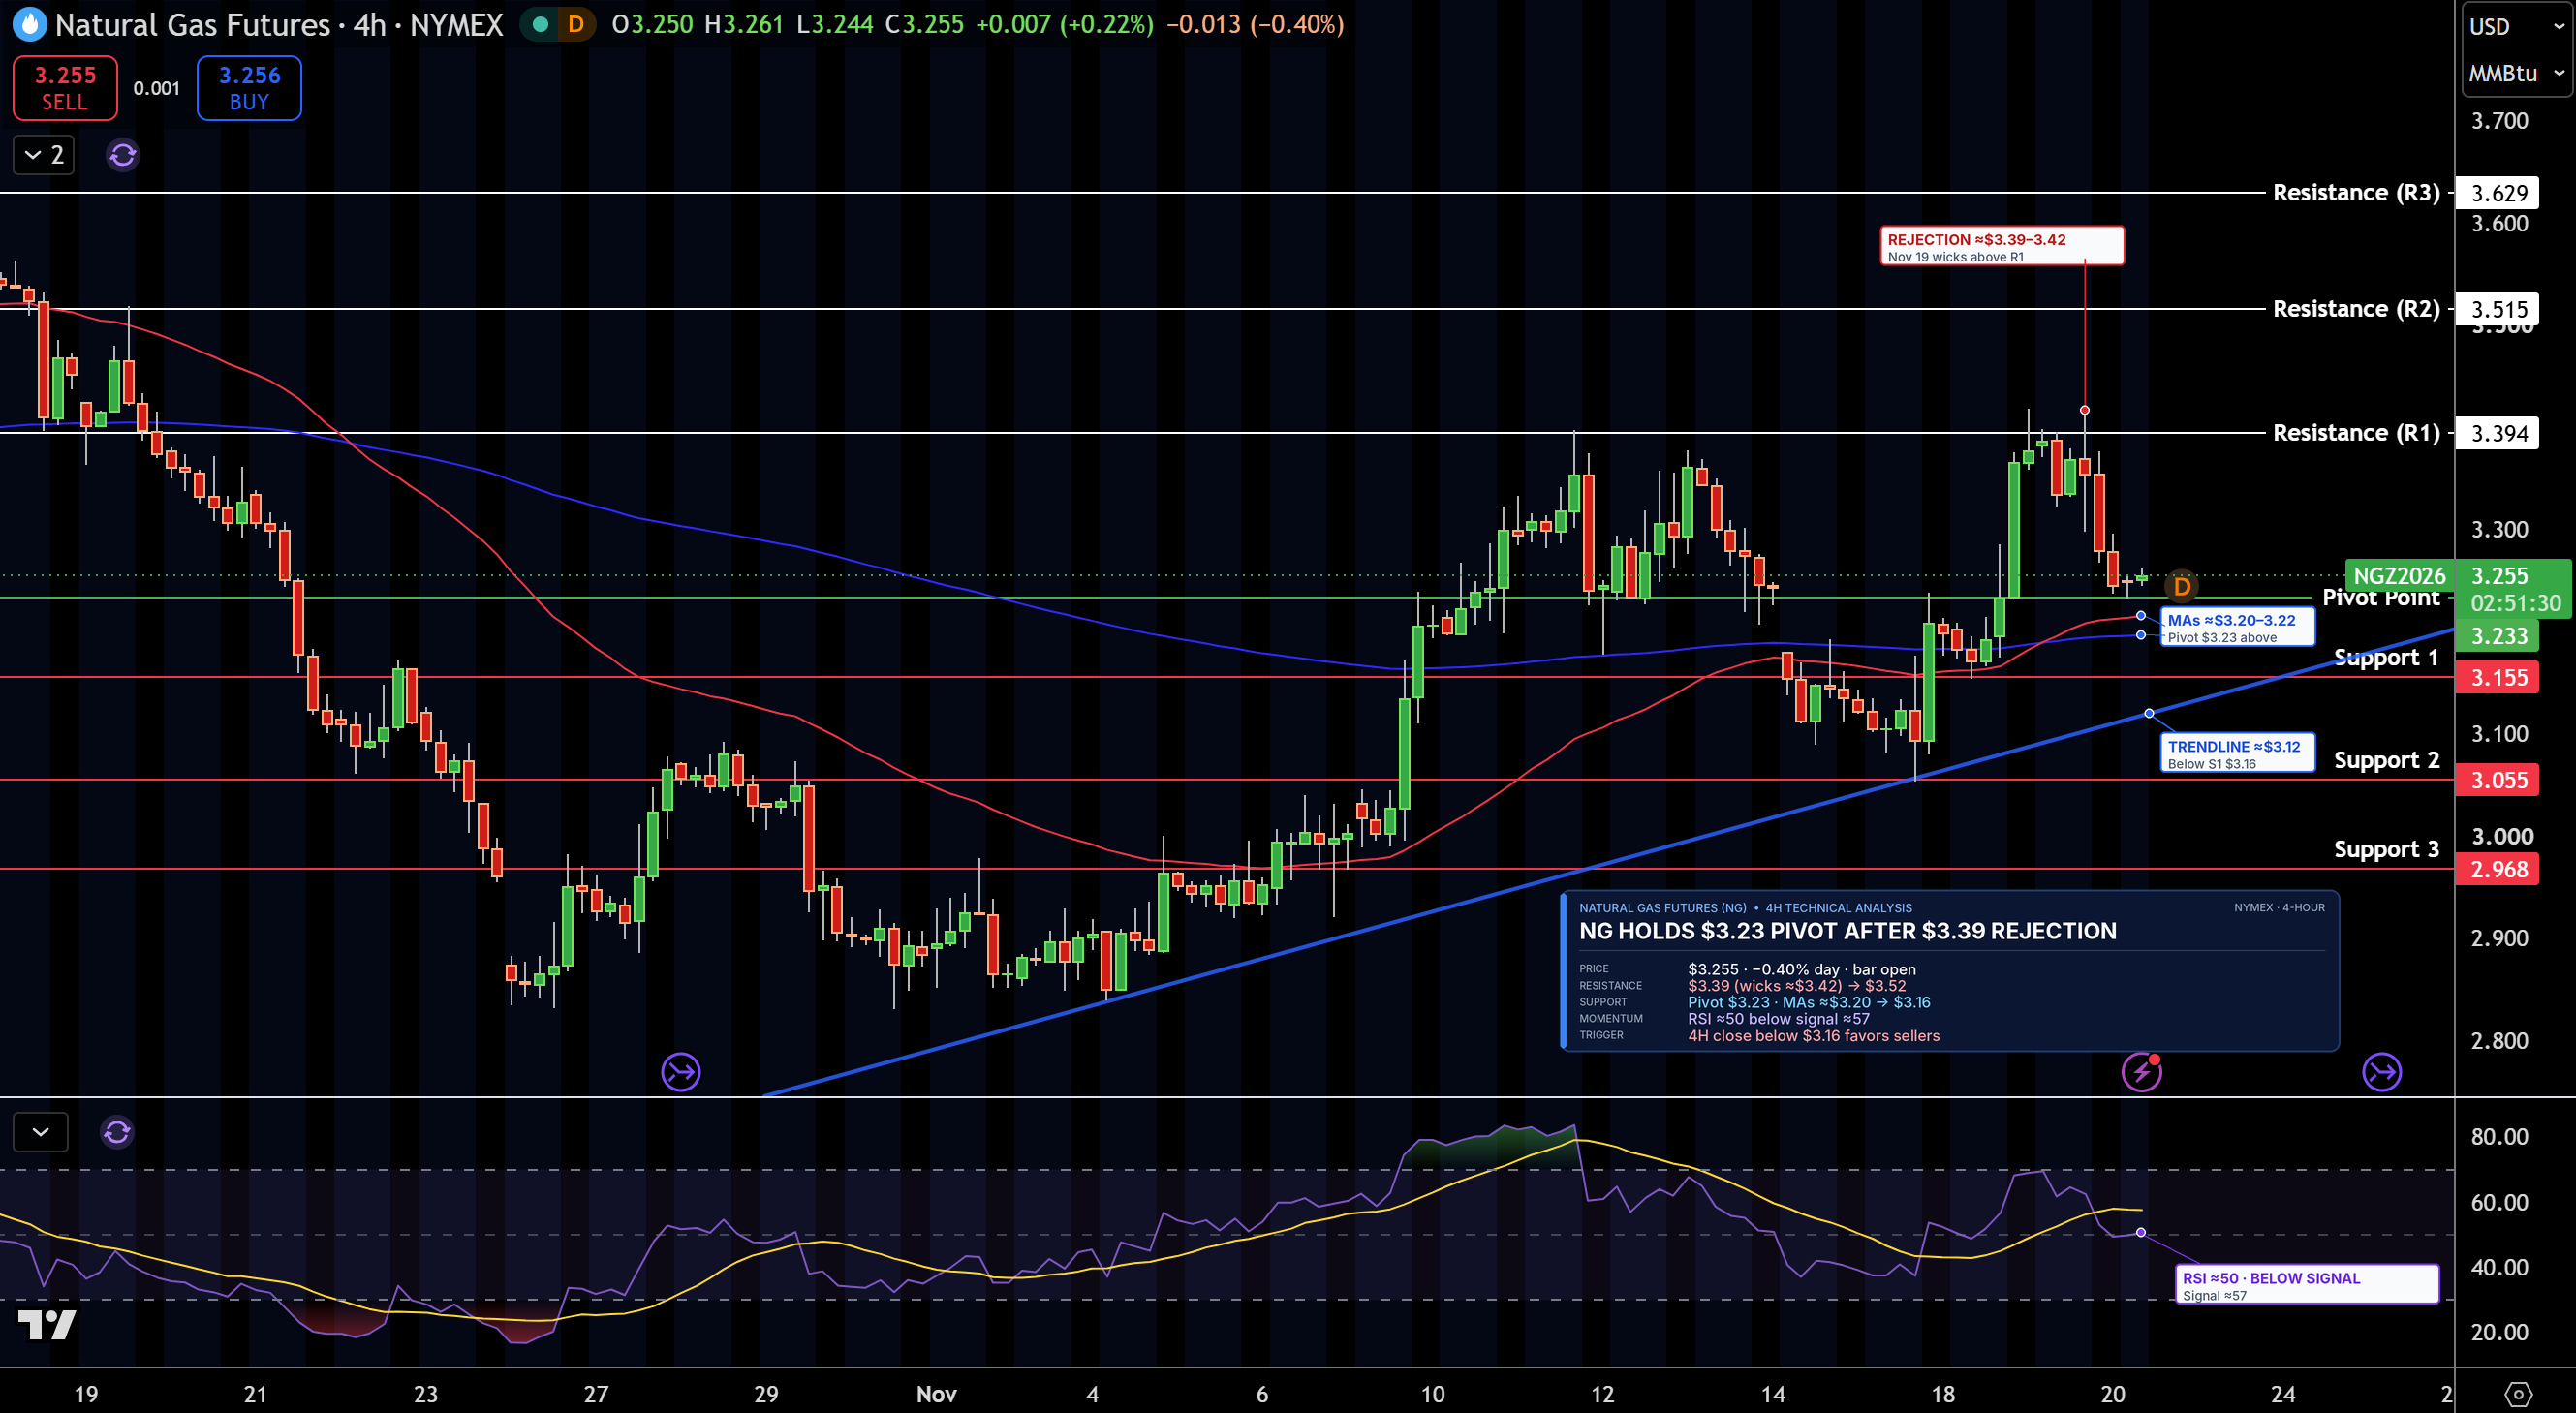
December natural gas futures are trading near $3.26/MMBtu, or per million British thermal units, on the 4-hour chart. Sellers turned prices back near $3.39 for the third time this month, and buyers are now defending the $3.23 pivot. Both moving averages, which track average prices over time, sit just below price, along with a rising trendline, a line connecting higher lows since early November.
For now gas is stuck between $3.23 and $3.39, and RSI has cooled to about 50 and is below its signal line, which fits that sideways picture. I stay neutral inside that range. A close above $3.39 would open the way for $3.52. A drop below $3.23 would expose $3.16, and a close below $3.16 would favor sellers.
WTI Technical Analysis: Oil Tests Falling Trendline Below $83.69 Pivot
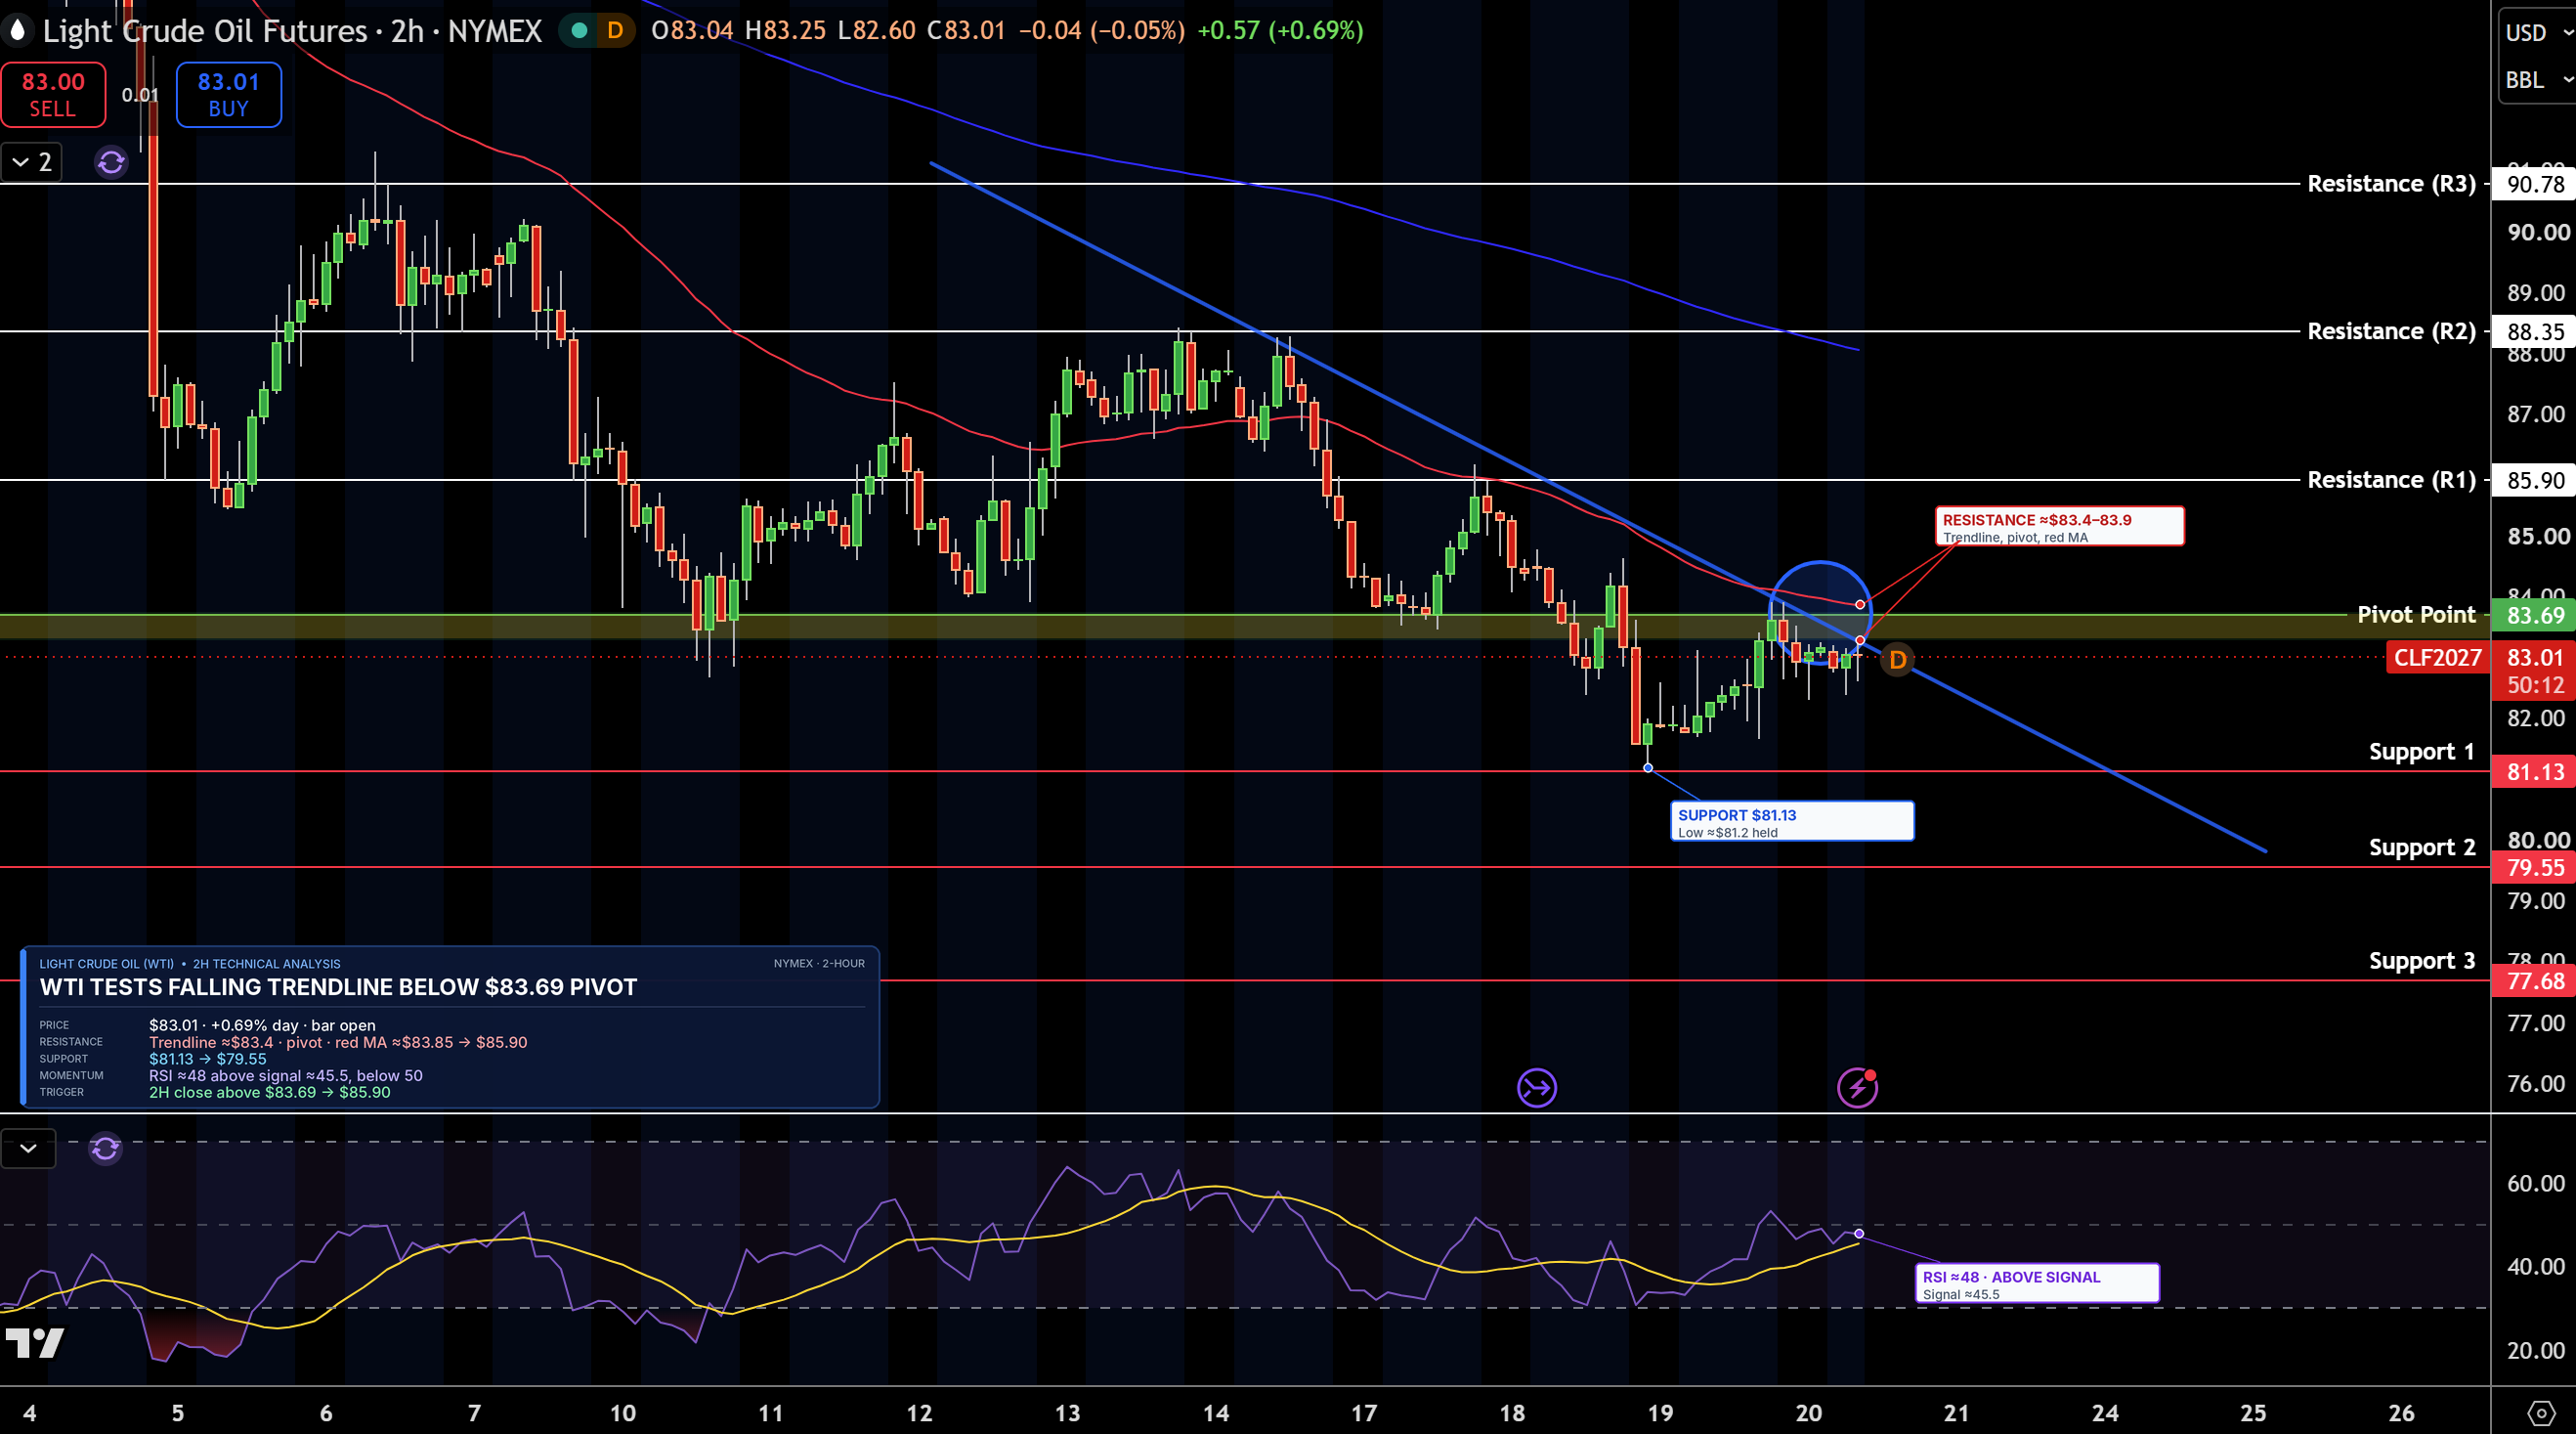
January WTI futures are trading near $83.01 on the 2-hour chart. Buyers stepped in above $81.13, and prices are now testing a falling trendline that connects lower highs since November 12. That trendline lines up with the $83.69 pivot and the faster moving average.
WTI needs to clear $83.69, where the pivot and the trendline meet, to confirm a breakout. That would open the way for $85.90. If buyers fail there, $81.13 is the support to watch, and a drop below it would point to $79.55. RSI is near 48 and above its signal line, so selling is easing, but WTI keeps a slight bearish lean while it stays below $83.69.