


U.S. natural gas kicks off Thursday with a more precise question than whether winter will be cold: How fast does the storage cushion erode when LNG demand remains strong but weather shifts from one forecast run to the next? That will be the question. This is the key to separating a brief move in gas futures from a fundamental change in the balance.
Storage Is Still Dated
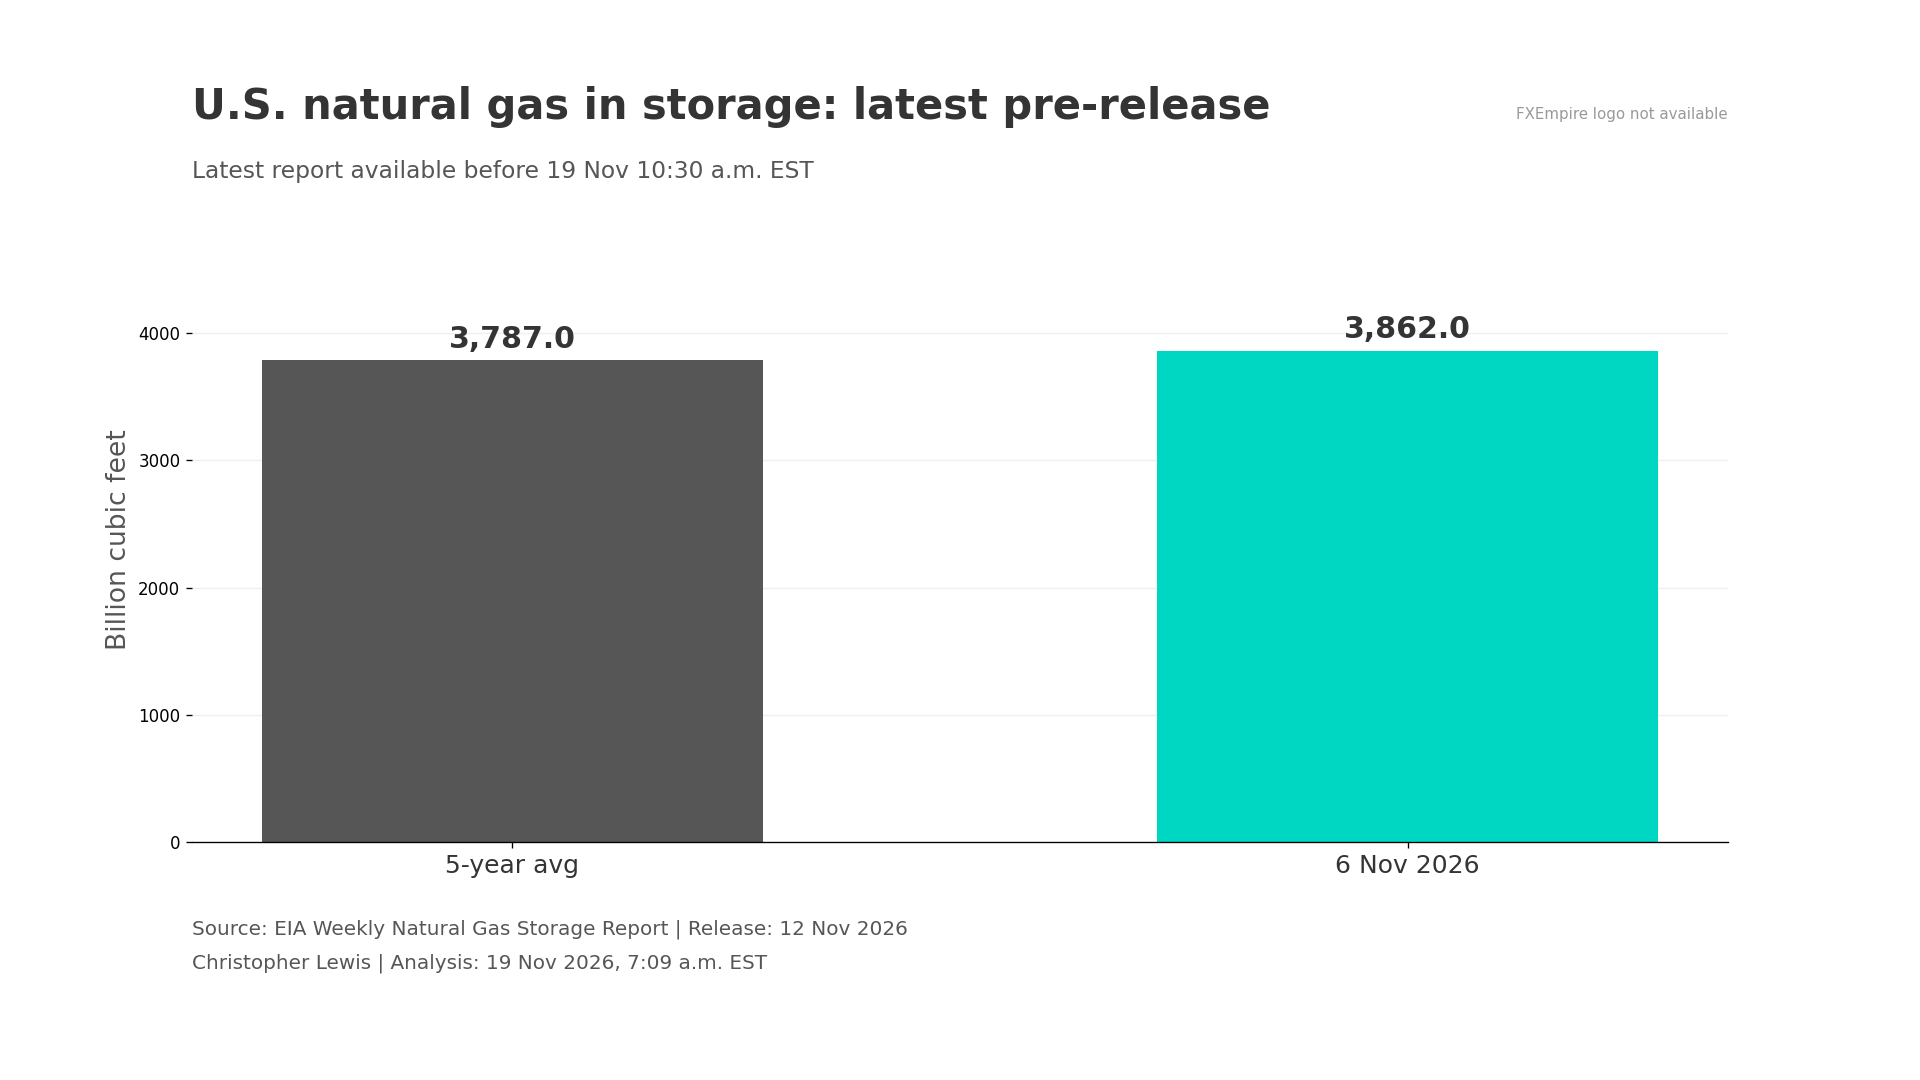
The latest report released last week, covering the end of November 6, put Lower 48 working gas in underground storage at 3,862 billion cubic feet after a 61 billion cubic feet injection. Inventories were 75 billion cubic feet above the 5-year average, but 92 billion cubic feet below the year-earlier reading. Those comparisons tell different stories. Relative to a normal season, the country had a modest cushion. Relative to the unusually high stock level of last year, the balance is a bit tighter.
The next report comes out later today at 10:30 a.m. and is going to give us more information. But as things stand right now, the details that we have are a week old.
Regional Storage
The regional detail made the situation more interesting. In the November 6 report, South Central storage was 1,235 billion cubic feet, slightly below its 5-year regional average of 1,239 billion cubic feet. East Region storage was 938 billion cubic feet against a 5-year average of 910 billion cubic feet, while the Midwest held 1,129 billion cubic feet compared with 1,102 billion cubic feet normally.
Natural gas cannot be treated as one perfectly interchangeable national inventory. Pipeline capacity, regional delivery needs, and the location of storage fields can determine where a price squeeze develops, even when the U.S. total itself looks completely comfortable.
Natural Gas Price Forecast
Every new Natural Gas analysis as it publishes, today's technical signal and key levels, live price — on one page.
See all Natural Gas forecastsLonger-Term Perspective
The EIA offered a useful longer-term perspective on November 18. It said that the Lower 48 ended the traditional injection season at 3,810 billion cubic feet, nearly 2% above the 5-year average. That outcome did not mean injections were unusually strong during the summer. The agency explained that the season began with inventories already 63 billion cubic feet above the 5-year norm, and that injections over the season were actually 2 billion cubic feet below the seasonal average.
In other words, the starting cushion helped compensate for changing weather and increased gas demand from export sales. This will matter for judging whether, in November, an isolated week of colder conditions could bring a larger withdrawal without establishing a lasting shortage. Conversely, several successive colder forecast updates across major consuming regions could meaningfully change end-of-winter inventories and expectations of what that could do to price.
The market has already shown sensitivity to revisions. Reuters reporting summarized on November 18 described U.S. gas futures retreating toward 1-week lows as forecasts turned milder and expected heating demand weakened. Separately, The Wall Street Journal reported later that same day that gas futures regained ground when weather model updates leaned colder, with industry estimates placing LNG feed gas close to 21 billion cubic feet per day.
Exports Warrant Separate Analysis Beyond Weather
LNG terminals convert domestic pipeline gas into overseas sales, providing an important non-weather outlet for American production. A strong feed gas estimate raises the amount that must be covered by domestic production or storage, but it is not the same as measured LNG exports loaded into ships. Maintenance outages, terminal utilization, and pipeline constraints can create temporary differences.
The EIA’s November 18 analysis said dry gas production during the refill season was 3% higher than the comparable period last year, citing S&P Global Energy. Yet most of the increased demand came from LNG export terminals.
Short-Term Energy Outlook Report
The agency’s November Short-Term Energy Outlook projects 1,900 billion cubic feet of total withdrawals during the November-through-March heating season. The EIA November STEO outlook also projects inventories ending March 2027 at 4% above that season’s 5-year average, partly based on expectations for a relatively mild winter and greater production. This is a model forecast with a cutoff, not necessarily a weather guarantee, so obviously it is just part of the background.
The storage release, when it arrives later today, will give us an opportunity to measure the change against the prior week and as a seasonally appropriate benchmark, and examine where the withdrawals or injections have occurred. The colder or warmer forecast trend persisting would be a major input to pricing as well.
Bouncing from Support
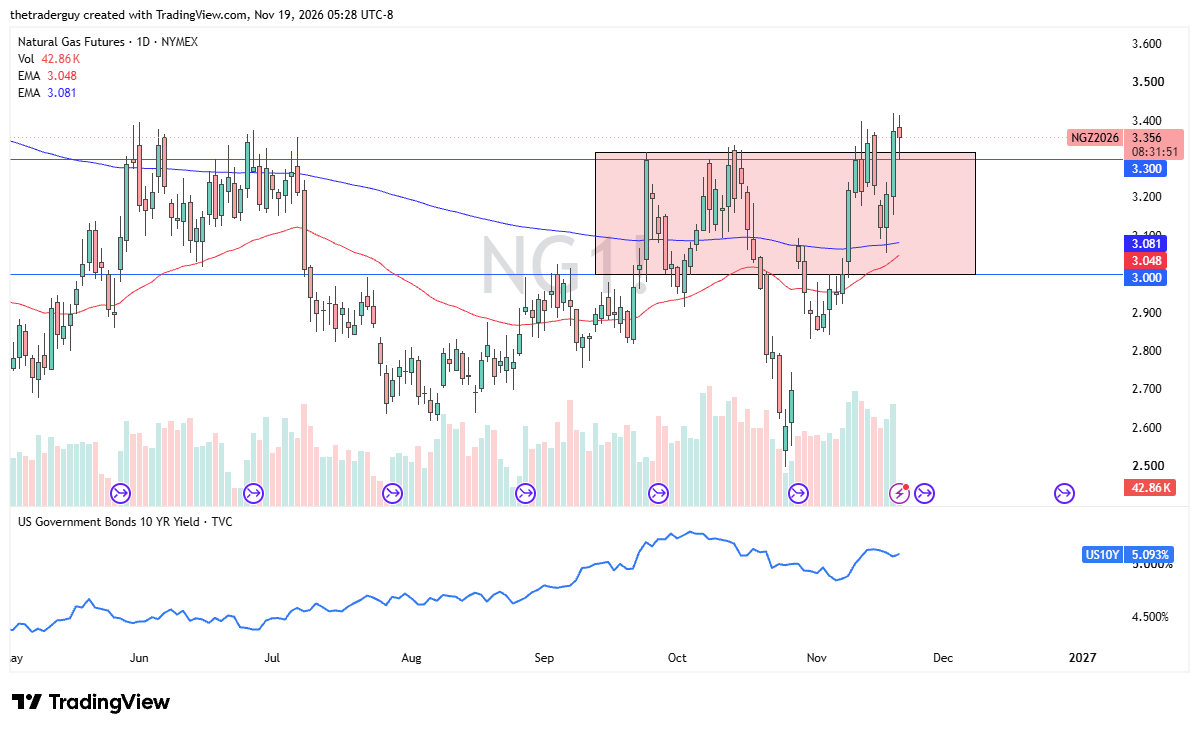
Currently on the charts, the market has pulled back to test the crucial $3.30 level and has found it supportive. By doing so, it looks like the market is trying to break out to the upside, but with that release coming, one would have to be very cautious.
I do not sell natural gas this time of year, and I recognize that we probably have a situation where bad news could offer a little bit of value for those who are patient enough.
If you’d like to know more about how to trade natural gas, please visit our educational area.