Natural gas markets initially went sideways on Friday, but once the Americans came on board, absolutely collapsed. Most of the recent bullish pressure has
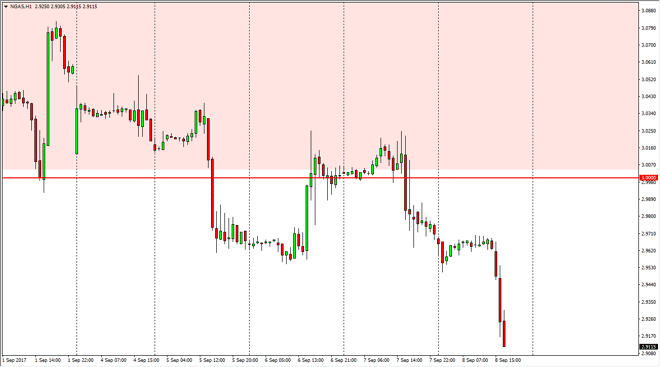
Natural gas markets initially went sideways on Friday, but once the Americans came on board, absolutely collapsed. Most of the recent bullish pressure has been due to traders anticipating a disruption of natural gas distribution, due to the hurricanes. However, that now appears to be very unlikely, and as a result the bearish pressure has returned. I believe that the $2.87 level will be targeted next, and that rallies will be selling opportunities. There is even more support near the $2.85 level underneath, which makes even more sense as a target. The $3 level continues to be massively resistive.
Chris is a proprietary trader with more than 20 years of experience across various markets, including currencies, indices and commodities. As a senior analyst at FXEmpire since the website’s early days, he offers readers advanced market perspectives to navigate today’s financial landscape with confidence.