



The copper (XCU) price dropped by 2.68% on Thursday and remains under bearish pressure. The uranium and lithium miners also remain under bearish pressure and move towards the key support zone. Despite this weakness, the copper price still holds ground above key support levels, while the uranium and lithium markets do not show any signs of recovery in the short term. I think that the next move in these metals will depend on whether prices hold the upcoming support areas. This article presents the latest fundamental drivers and technical levels to understand the next move in copper, uranium and lithium prices.
Copper, Uranium and Lithium Fundamentals: Supply and Demand Risks
The copper price faces pressure as the increase in inventories and weak sentiment from investors ease the concerns about supply. Copper stocks reached 272,950 tonnes in London Metal Exchange warehouses on 22 October. This is the highest level since July.
A global sell-off in technology also increased pressure on industrial metals due to the outlook for the AI spending. But much of the available metal remains concentrated in the US and leaves the supply uneven across regions.
Teck also reported strike notice at Highland Valley Copper on 21 October. Their workers could begin strike action from October 24. In my view, the risk of disruption could limit the losses in copper if the negotiations fail.
The nuclear regulator of France opened consultation to allow EDF reactors to operate beyond 60 years. The draft assessment found no obstacle without the possible remedy but substantial technical work and individual safety reviews remain necessary. The long reactor lives would preserve the demand in the future for uranium fuel.
Westinghouse also announced roughly $1 billion nuclear fuel factory on 21 October, which may begin operations in 2030. This investment may support the existing reactors and nuclear expansion in the future. I think that these developments may strengthen the broader outlook for demand.
The lithium market remains under bearish pressure due to the increase in Chinese production and weak battery orders. The battery grade lithium carbonate averaged around 99,350 yuan per tonne, which is down 2.7% over the week.
The weekly output increased as more shipments of spodumene reached the Chinese ports. At the same time, battery material and cell producers reduced demand due to the reduction in orders. In my view, lithium prices require strong battery orders and slow growth in supply to produce a sustainable recovery.
Copper Price Forecast
Every new Copper analysis as it publishes, today's technical signal and key levels, live price — on one page.
See all Copper forecastsCopper Price Forecast: $6.35 Support at Risk After Wedge Breakdown
The daily chart for copper shows that the price broke below $6.60 on Thursday. After the breakdown, the price marked a low at $6.43 in early Asian trading on Friday. The price is slightly rebounding on Friday but remains under bearish pressure.
The immediate support lies at the $6.35 level seen by the black horizontal line in the chart below. A break below $6.35 will likely push the price towards the 200-day SMA at the $6.27 level.
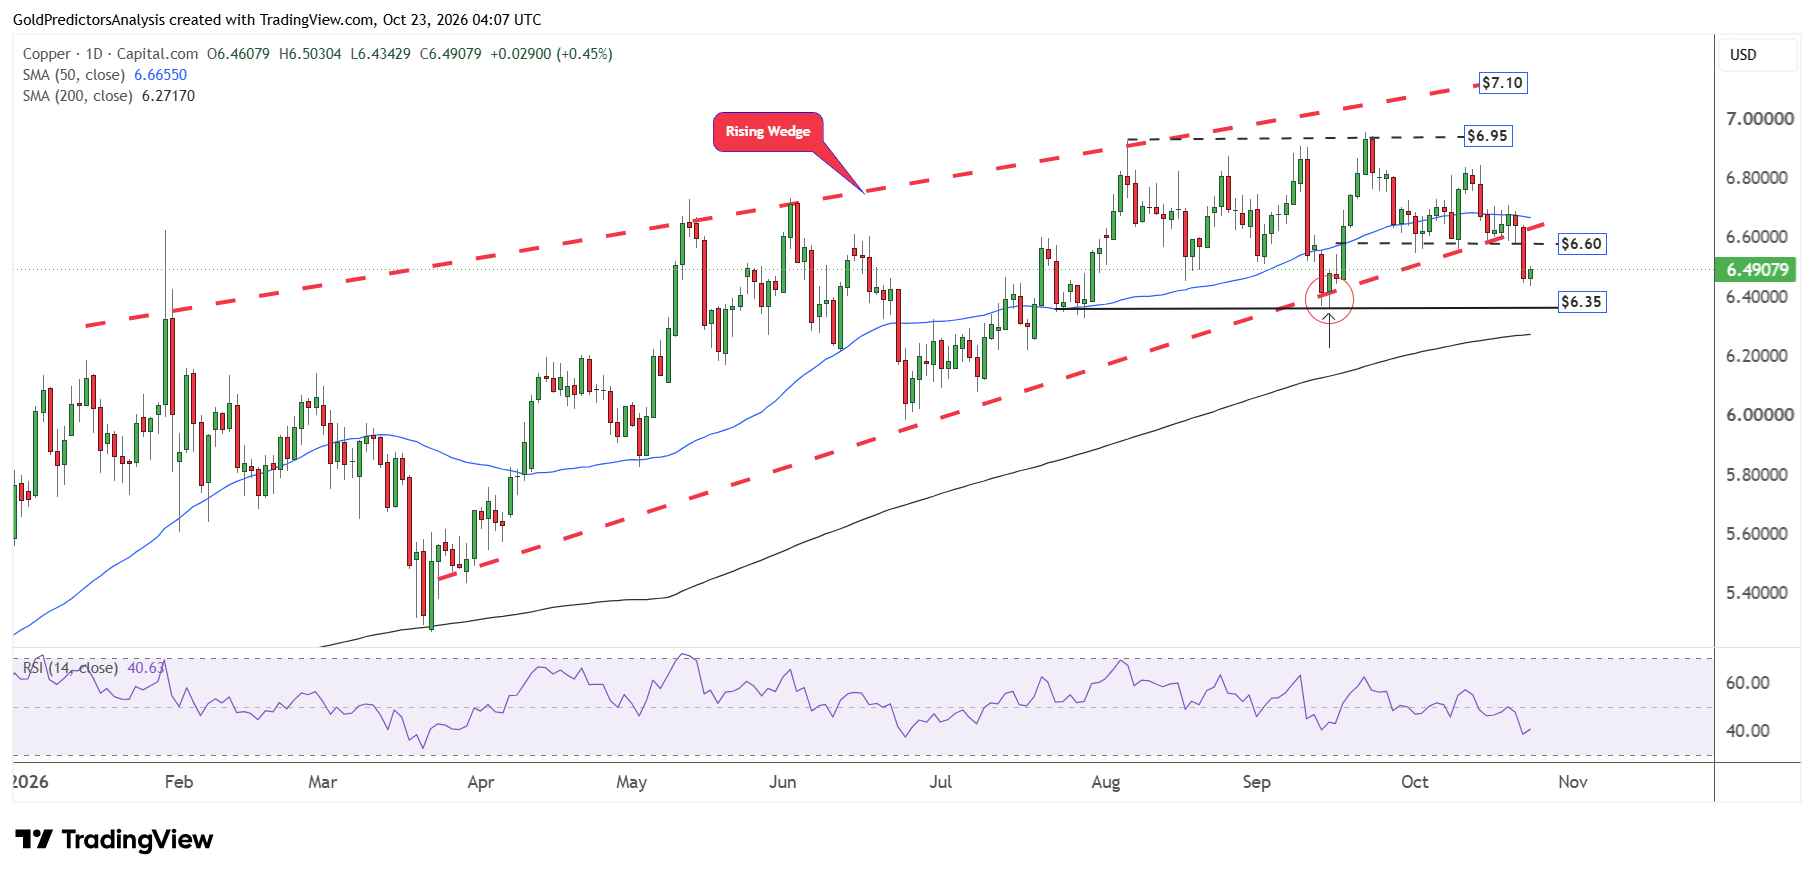
The RSI remains below the midline which suggests a negative trend in the short term. Moreover, the price has already broken the rising wedge pattern that is stretched from the March 2026 lows. This breakdown suggests that prices may face more selling pressure in the near term.
Despite the selling pressure, the overall price structure still remains bullish as long as the price remains above 200-day SMA. But the price needs to break the $6.95 area to open the way for further upside.
The negative pressure in the copper market is also observed in the Sprott Copper Miners ETF. The ETF has remained under consolidation between $31 and $45 since the peak of January 2026. Since the ETF has hit the key resistance in the $45 to $47 region, the price is now correcting back towards the lower support range at the $31 level.
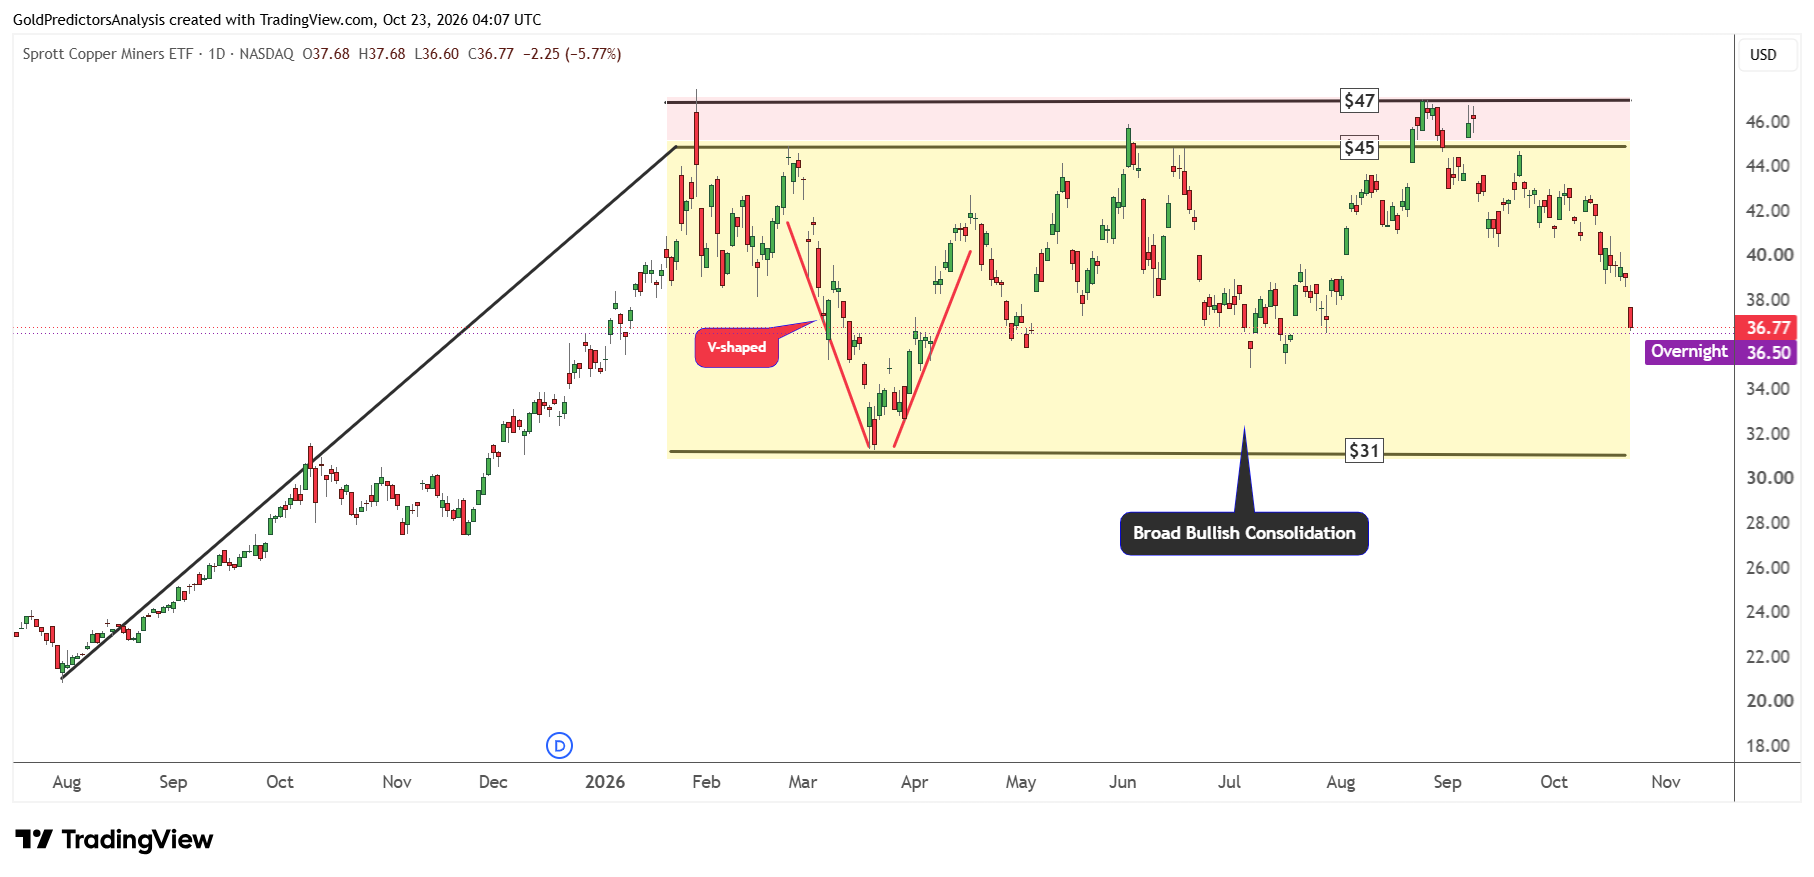
A break below $31 will suggest bearish pressure and push the price towards $25. But a break above $47 will open the way for a strong rally in copper miners.
Uranium Forecast: ETF Breakdowns Put Key Support in Focus
Uranium ETFs Slide Towards Key Support
The uranium market remains under bearish pressure as seen in the chart below. The chart shows that the Global X Uranium ETF broke the triangle pattern last week and lost 8.92%. The ETF follows the negative momentum of last week and continues to drop towards the next support area that lies near $30.
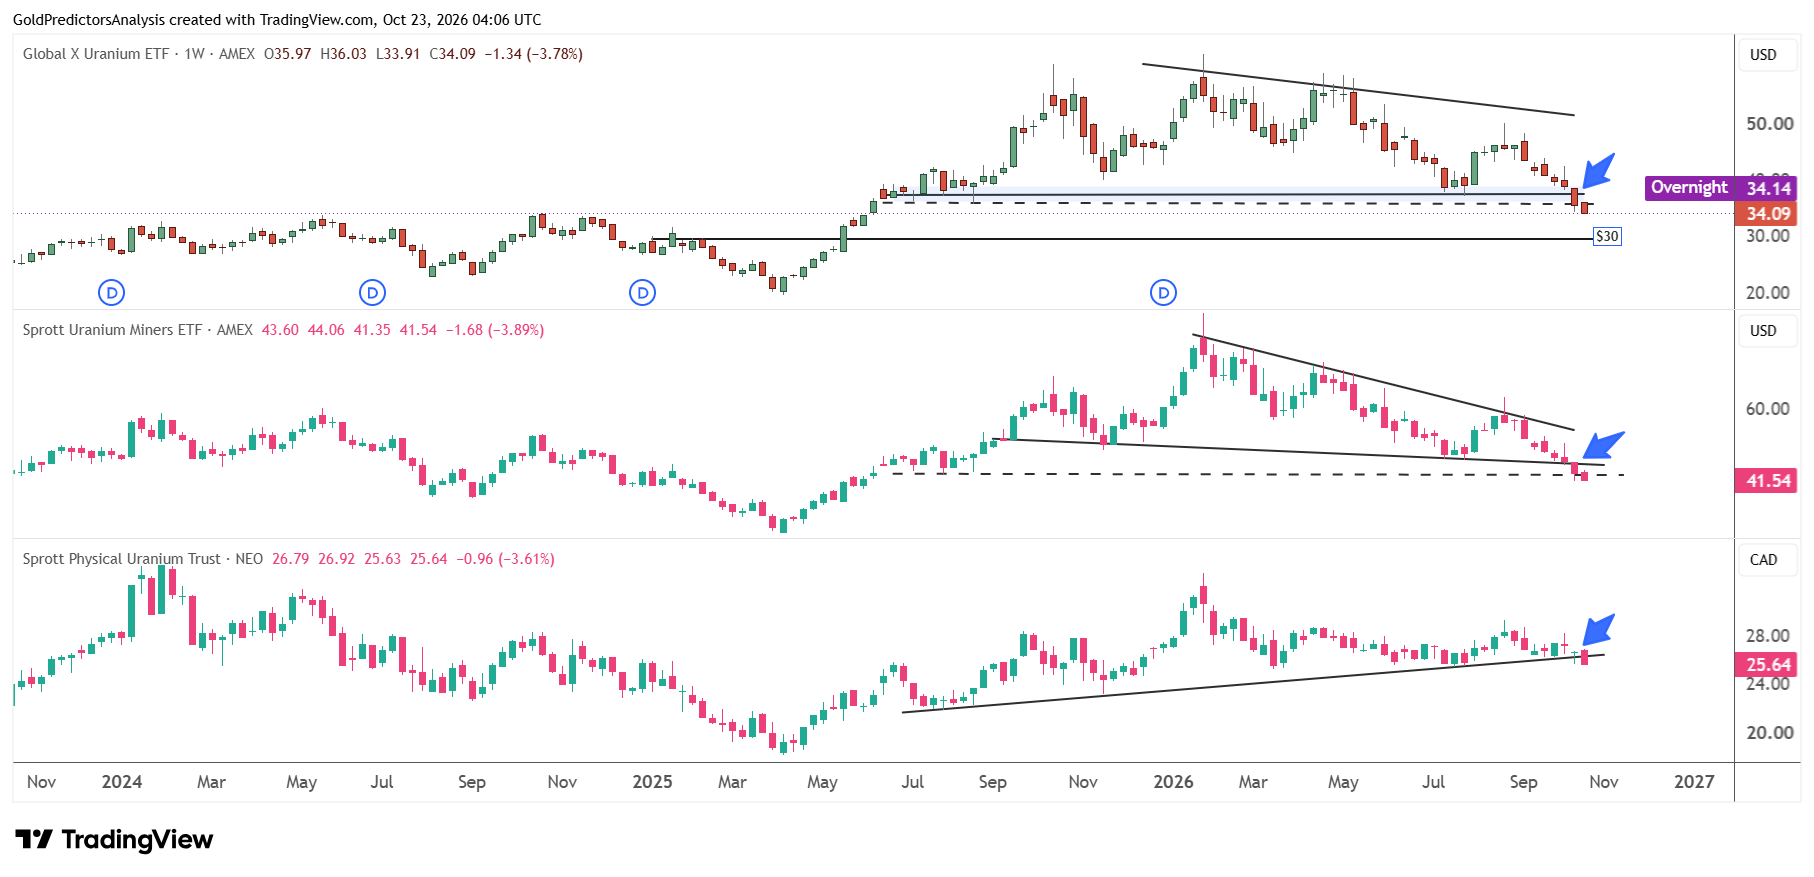
Moreover, the Sprott Uranium Miners ETF also broke the triangle support at $43 and continues to drop toward immediate support at $37. A break below $37 will open the way for a further drop towards $28.5.
On the other hand, a recovery above $46 will open the way for a rally towards the resistance of the triangle at $53. The Sprott Physical Uranium Trust also broke the primary trend and moved below $26. The immediate support in the trust remains at $23.30 but a recovery above $27 will likely open the way for another rally towards $28.70.
Uranium Equity Basket Nears a Possible Turning Point
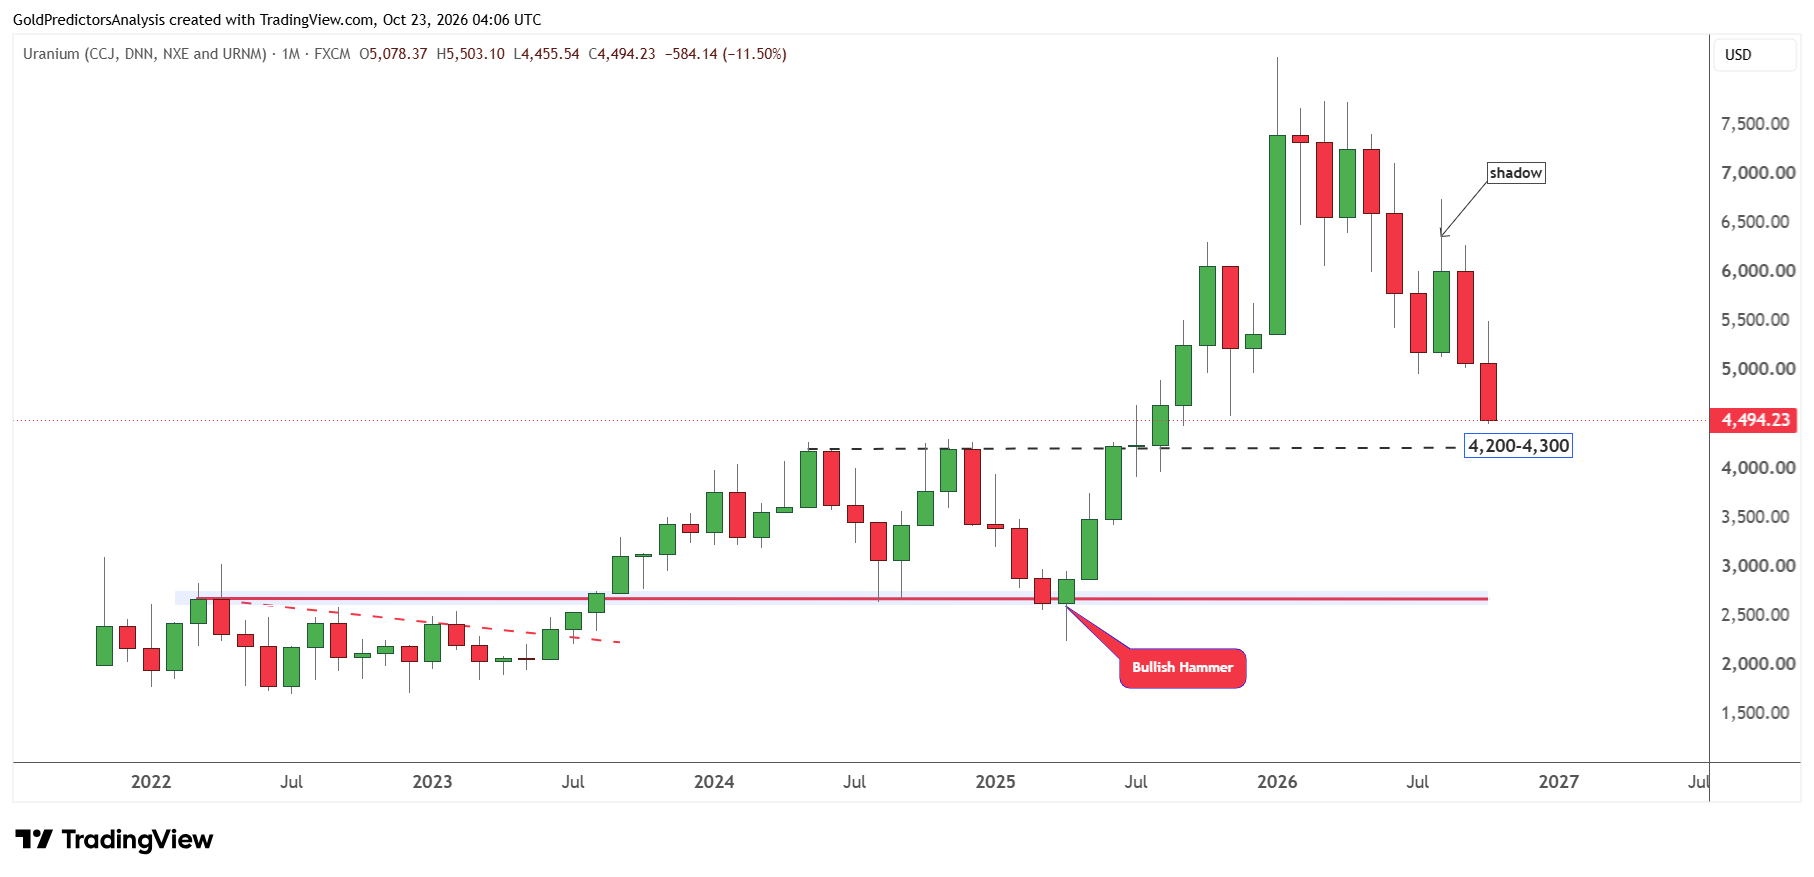
The bearish pressure in the uranium market is also observed using the uranium equity basket. The uranium equity basket has continued to drop in September and October and remains under bearish pressure to reach the lower boundary of support at the 4,300 to 4,400 level.
This support level is defined by the descending channel pattern. A break below 4,300 will open the way for a further drop towards the 4200 level. But a recovery above 4,800 will indicate further upside towards the 5,600 level.
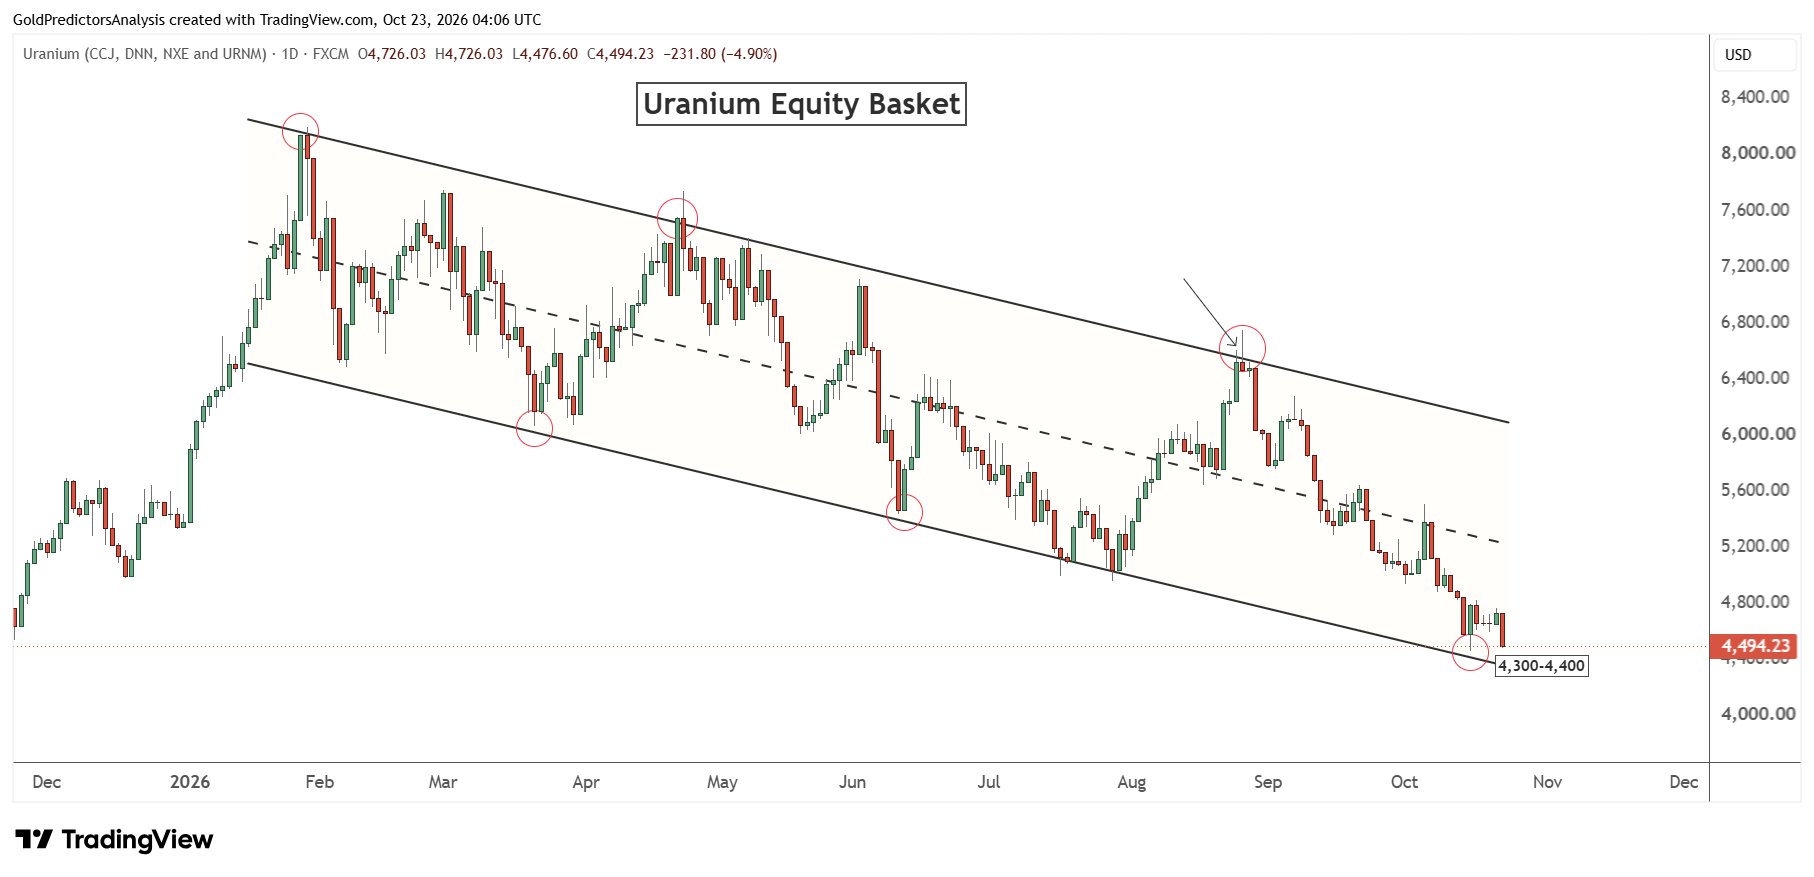
The long-term outlook for the Uranium Equity Basket also shows that the basket is now approaching the key support zone between 4200 and 4300. A test of this support may introduce a strong rebound back towards the 5,600 level. The emergence of a bullish hammer candle in April 2025 and then the strong rally to mark a high in January 2026 suggests that this correction towards the 4200 to 4300 might be considered a pivot on a long-term basis.
Lithium Forecast: ETF Support Breaks Signal Further Downside
The lithium market also remains under bearish pressure as seen in the chart below. Sprott Lithium Miners ETF has broken the support zone of $9 and $7.50. The break below $7.50 suggests further drop towards $6.50 in the near term.
But a recovery above $9 can negate the bearish pressure and push prices towards $11. The Global X Lithium and Battery Tech ETF has also formed the head and shoulders pattern. The ETF has broken the neckline of this pattern at $66 which suggests further downside.
The break below $66 suggests that the price may move towards the $54 and $50 areas. A recovery above $66 may ease the bearish pressure in the short term and push the ETF higher to the $75 level.
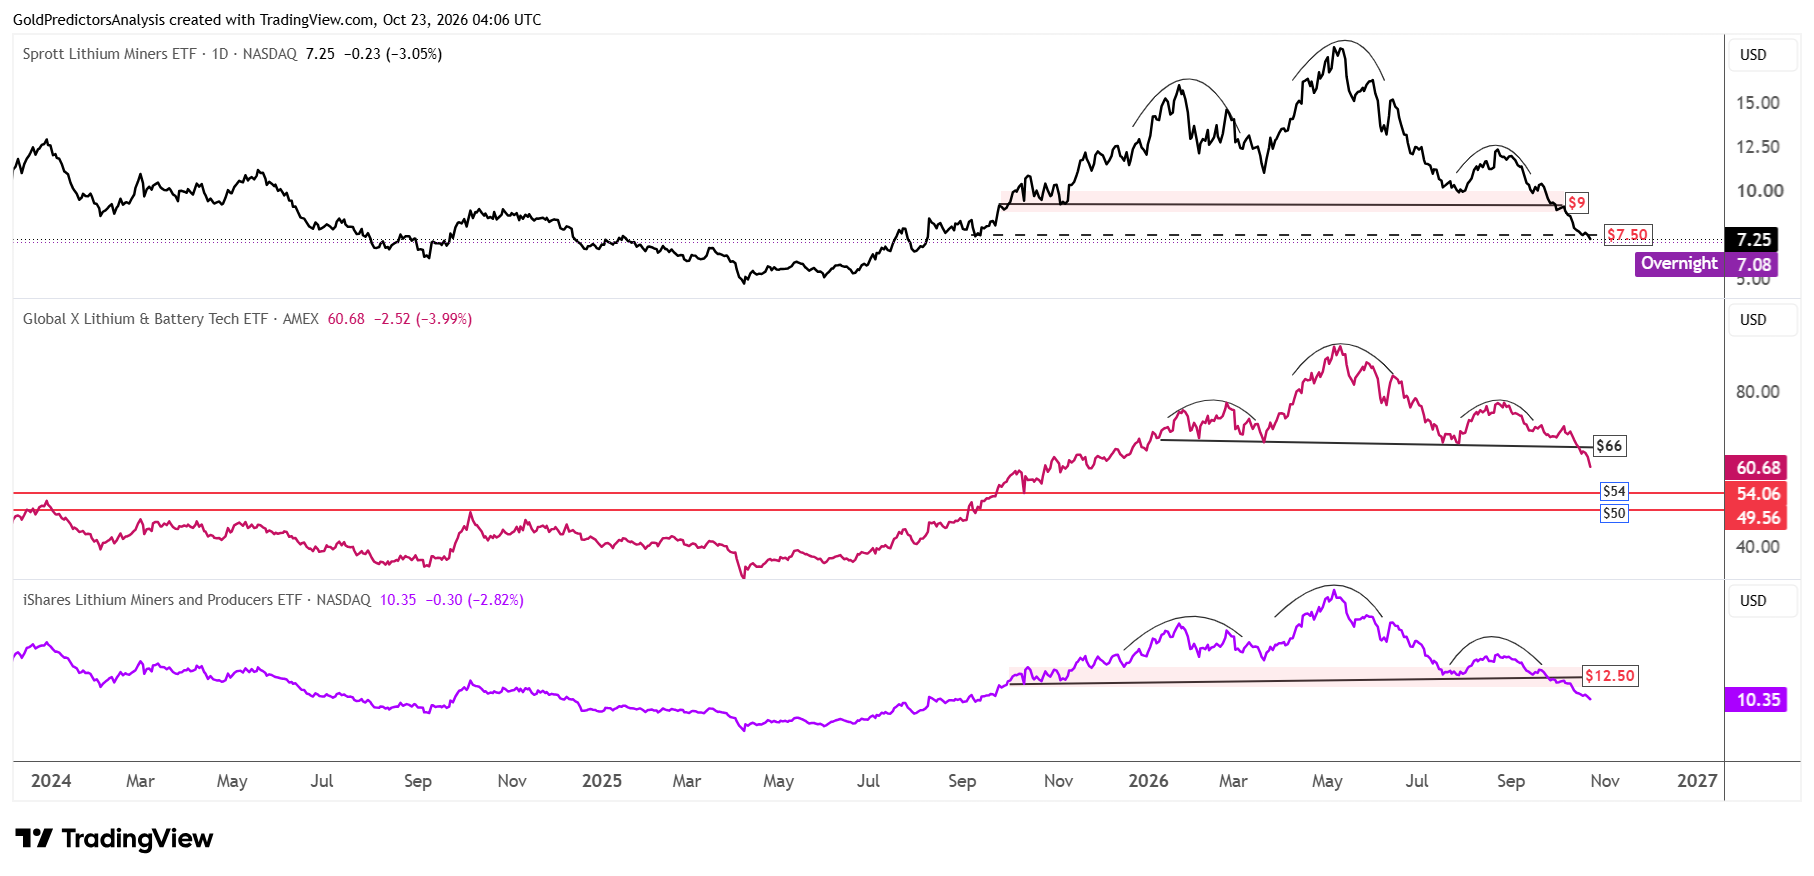
The iShares Lithium Miners and Producers ETF has also broken the key level of $12.50 and remains under bearish pressure. The key support in this ETF lies near $8.70 level. But a break above $12.50 may ease bearish pressure and push it higher.
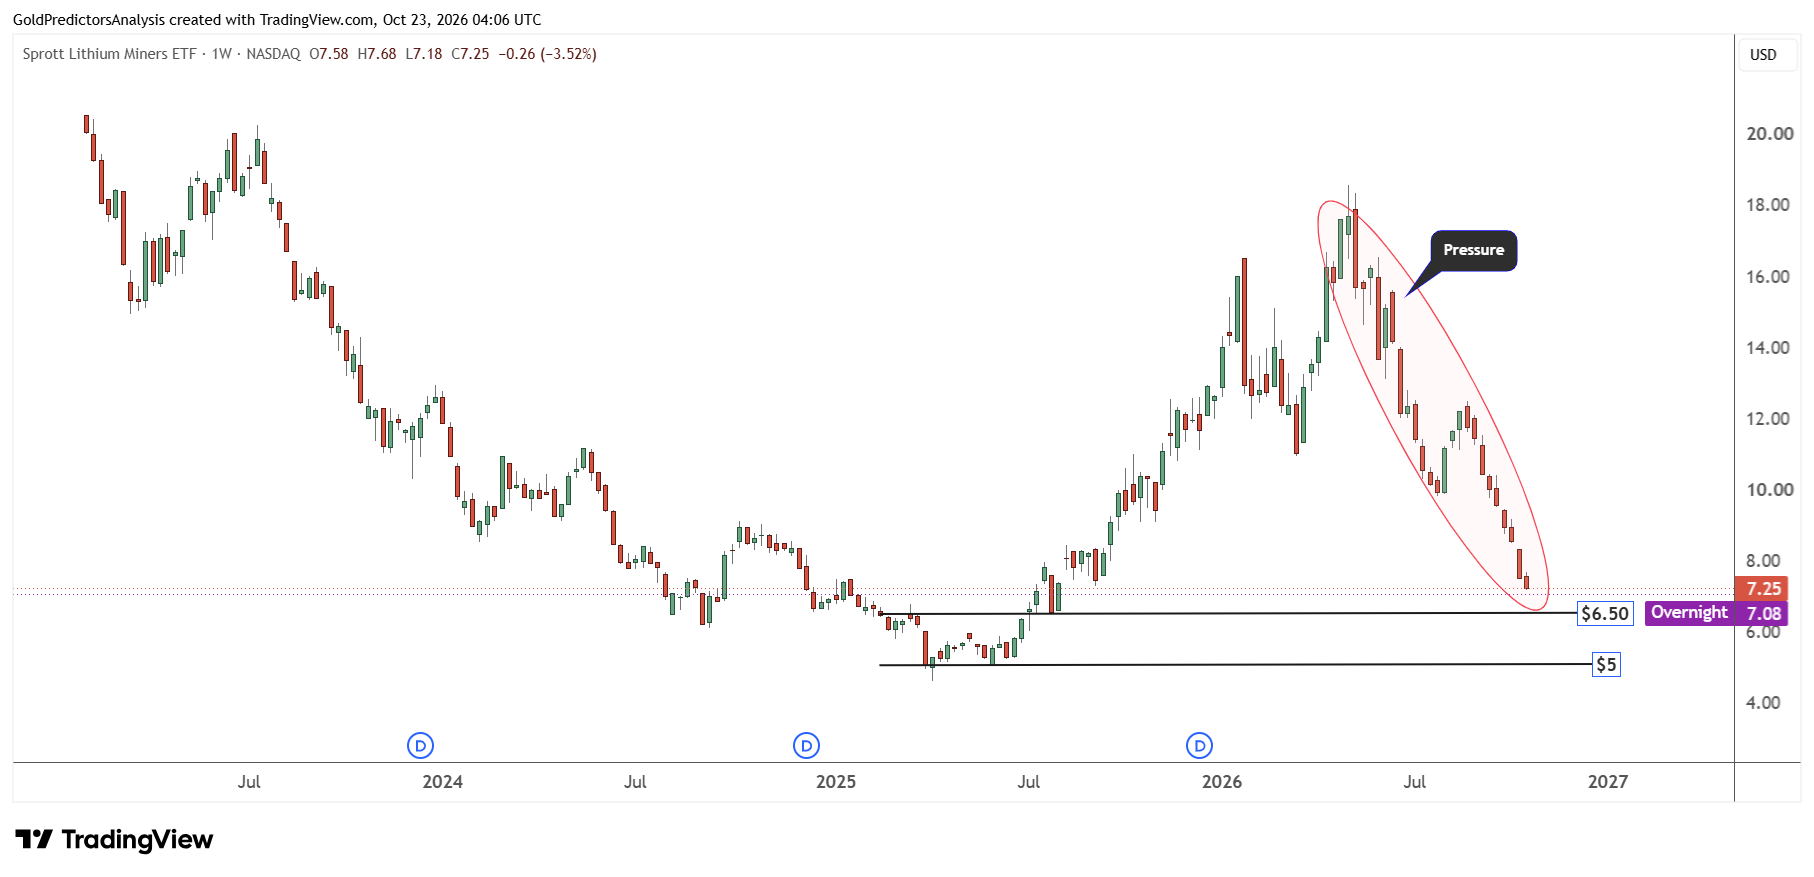
The chart below shows that Sprott Lithium Miners ETF has been consistently dropping since the peak of May 2026. The ETF has produced negative weekly candles for the past nine weeks. The immediate support remains at $6.50. A break below this level may push the ETF to $5. This suggests that the lithium market may see further downside in near term.
What to Watch Next
Copper price broke the rising wedge pattern and comes under bearish pressure in the short term. The immediate support level is at $6.35. A break below this level may push the price near the 200-day SMA at $6.27. A break below these levels would indicate that the price may continue to drop towards the $6 area. The market will also watch for LME inventories and negotiations at Highland Valley Copper. The increase in stocks could limit the recovery in copper, but a strike could renew the concerns about supply.
The broader outlook for copper still depends on whether copper can hold the 200-day SMA. The market also needs to break above $6.95 to indicate further upside in copper.
For uranium, the Sprott Uranium Miners ETF will watch for $37 support and the uranium equity basket will watch for 4,200-4,300. A break below these levels will likely offer further downside in the uranium market. But a rebound from these levels will ease the selling pressure. The nuclear investments also support the demand for fuel in the future, but the benefits will take some time to develop. The lithium prices also require strong battery orders and slow growth in supply to improve the outlook.
Read more: Fed Hike Risks Cloud Recovery in Copper, Uranium and Lithium