


GBP/USD was 1.3220 on the Bank of England’s 4pm rate on 12 October, and the 30-year point on the Bank’s fitted gilt curve was 6.01% on 9 October. Every sterling note I read blamed both figures on the Budget. The Bank’s own curves show gilts pricing little extra UK risk into the 28 October Budget. The pound’s fall since 10 September came during a dollar rally that hit the euro harder, and futures already hold a bearish view on sterling. I expect GBP/USD near 1.3222 on 29 October, with the risk skewed lower. My target is one pip above the forward, and I’d put the Budget risk in the tails and in futures more than in gilt spreads.
News
GBP/USD was 1.3446 on 17 July on the Bank of England’s 4pm rate, the last rate before the change of prime minister, rose to 1.3531 by 10 September and was 1.3220 on Monday 12 October. In between, the long end crossed 6%. On the Bank’s fitted zero coupon curve the 30-year point reached 5.99% on 2 September and closed above 6% for the first time on 10 September. The 30-year point was 6.01% on 9 October, and the Bank’s curve has carried a 30-year point only since 2016. A letter from the Chancellor to the Treasury Committee on 31 July set the Budget for 28 October, the day the Fed announces its decision at 2pm Washington time, after the London 4pm rate.
Context
Sterling’s bears have a real case. On 8 October Ebury’s Matthew Ryan wrote that risks to the pound ahead of the Budget are skewed to the downside, citing estimates that higher gilt yields have cut the Chancellor’s headroom from £23.6 billion at the Spring Statement to as little as £8.5 billion. John Healey became Chancellor on 20 July, when Andy Burnham became prime minister, and a thin buffer under a new government can lift the gilt premium. I couldn’t verify those headroom estimates, so I measured the rates instead.
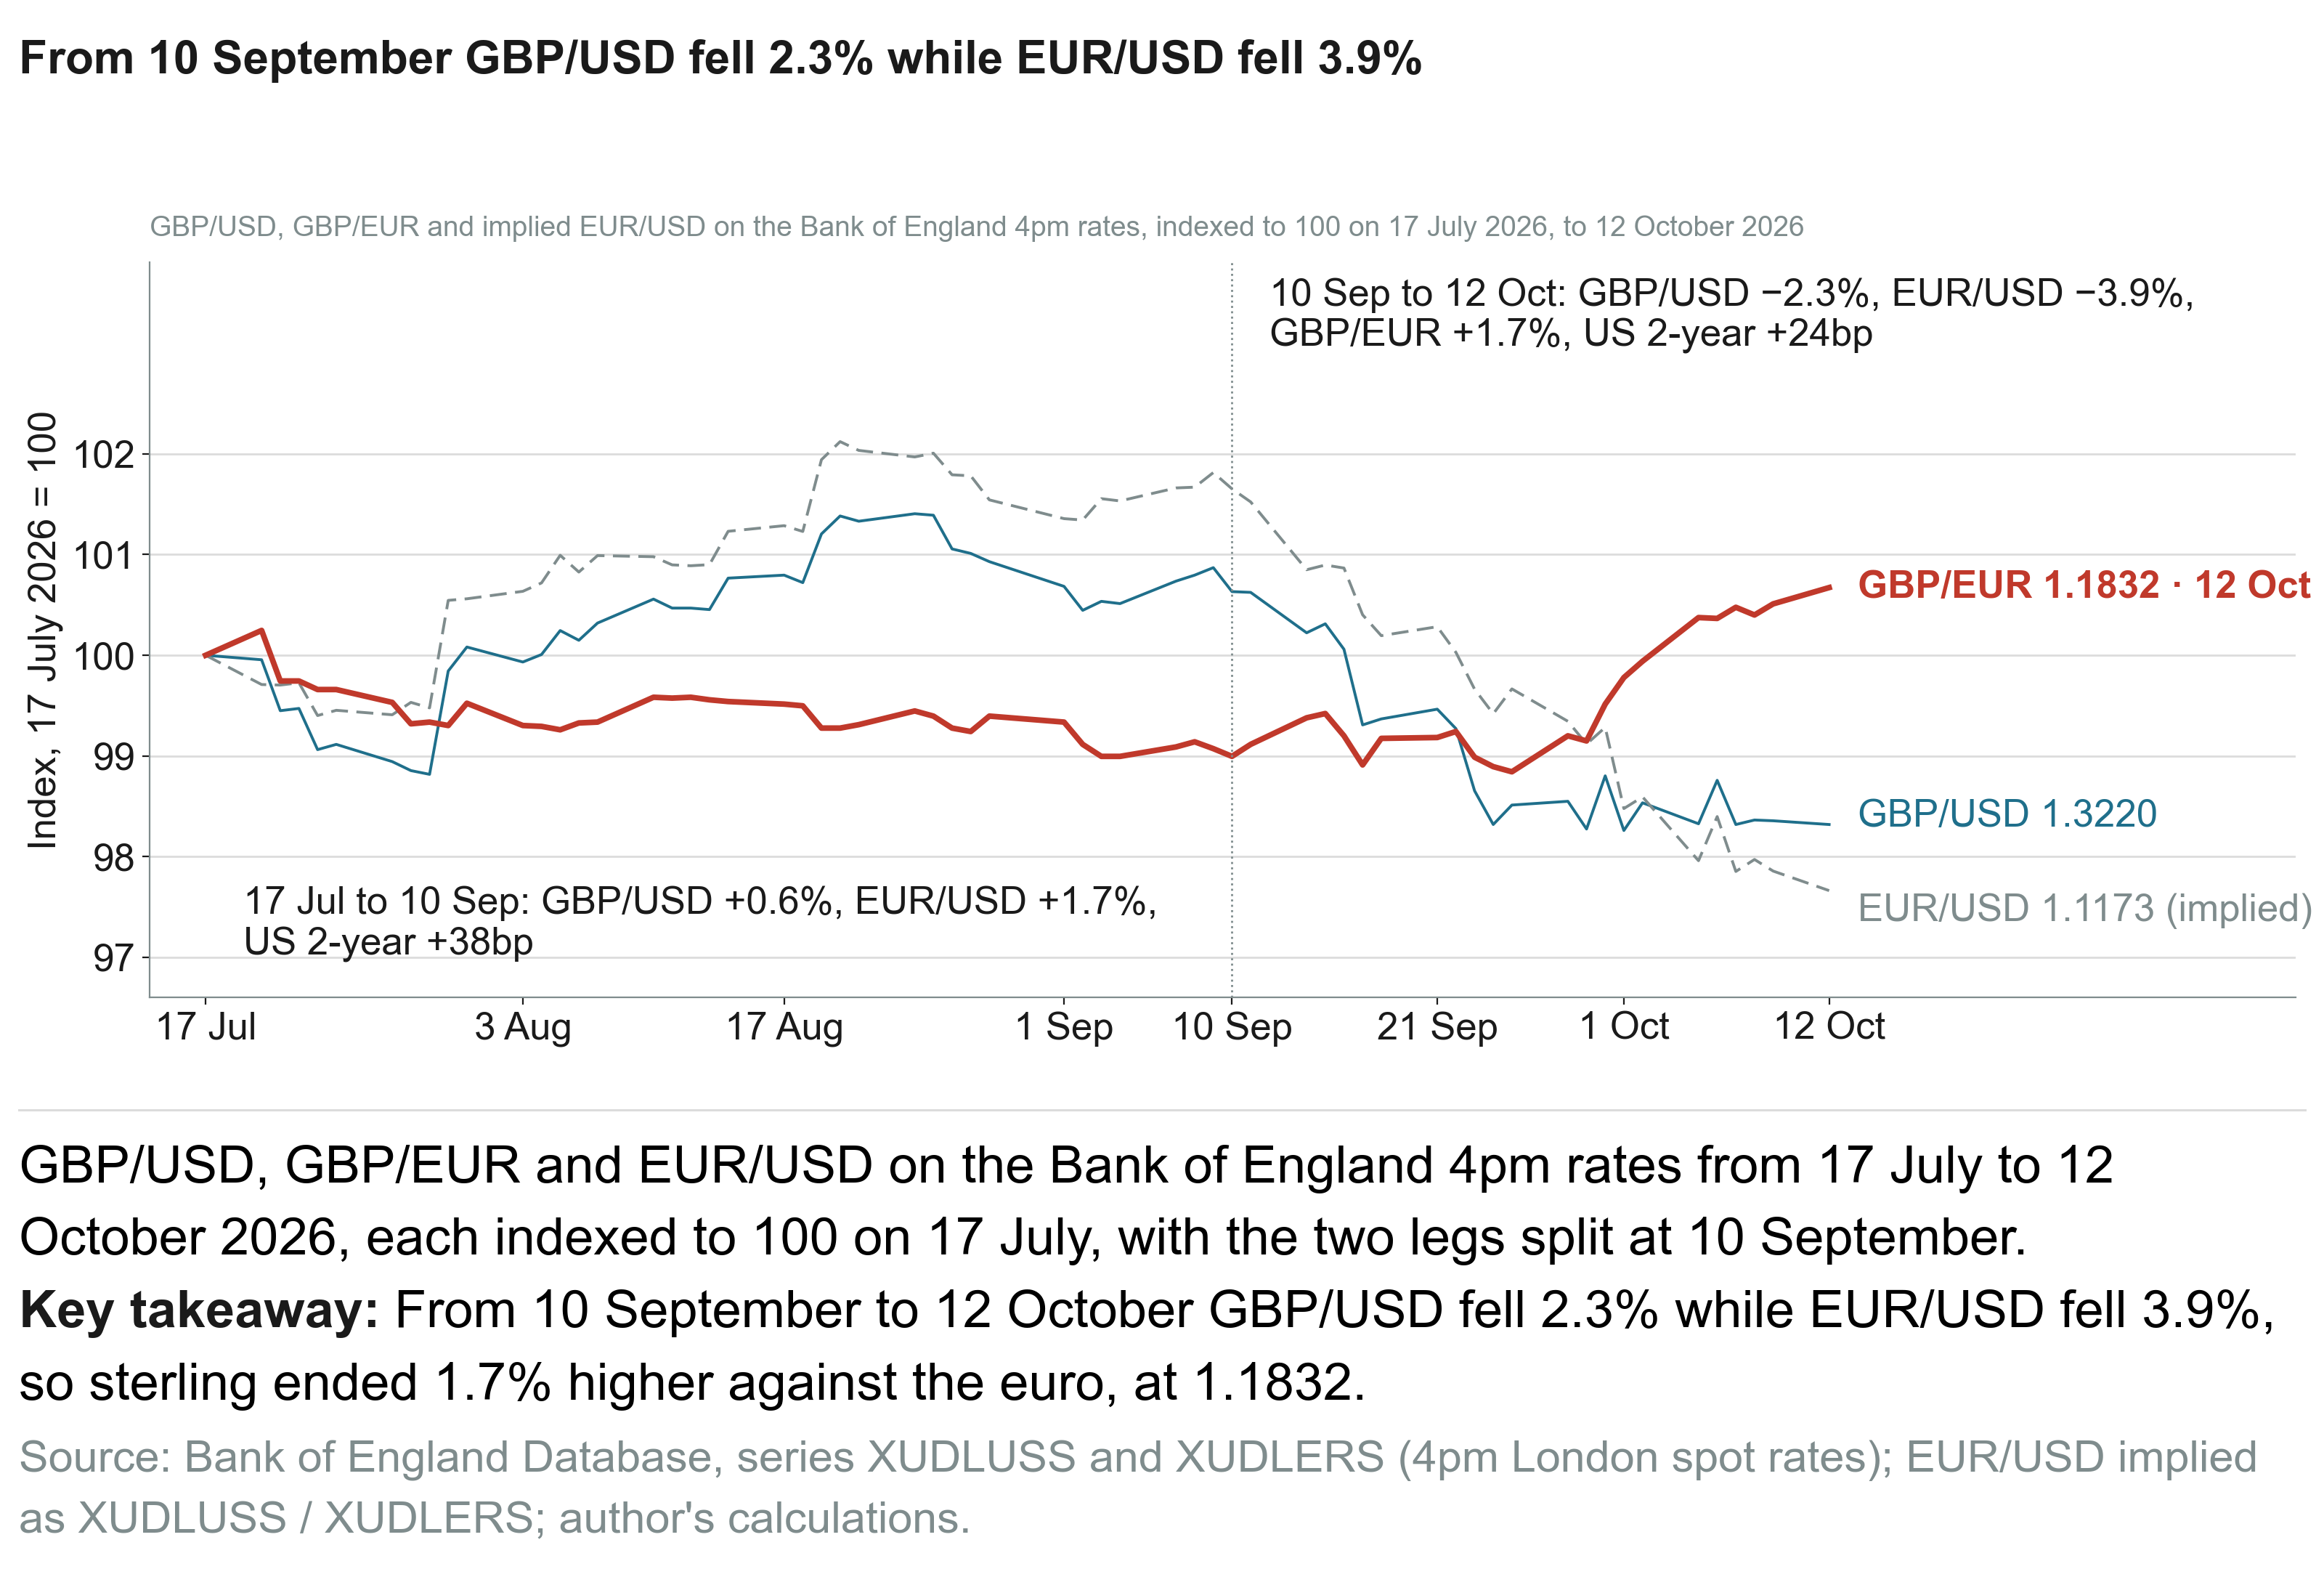
Short rates have moved the dollar’s way. From 17 July to 9 October the Treasury 2-year rose 62 basis points on its daily par curve, to 4.80%, with the Fed raising its range to 3.75% to 4.00% on 16 September along the way. The Bank of England’s 2-year gilt rate rose 45 basis points. Bank Rate hasn’t moved from 3.75% all year. The Bank’s 1-year OIS rate was 4.38% on 9 October, so the market expects UK hikes as well. Two inflation reports come before the Budget: US September CPI from the BLS on 14 October and the UK figure from the ONS on 21 October. The Bank of England’s next decision follows on 5 November. Sterling was 1.1832 euros on 12 October, its highest since June 2025, while the pound fell against the dollar.
GBP/USD Price Forecast
Every new GBP/USD analysis as it publishes, today's technical signal and key levels, live price — on one page.
See all GBP/USD forecastsFinancial Analysis
What the gilt market prices
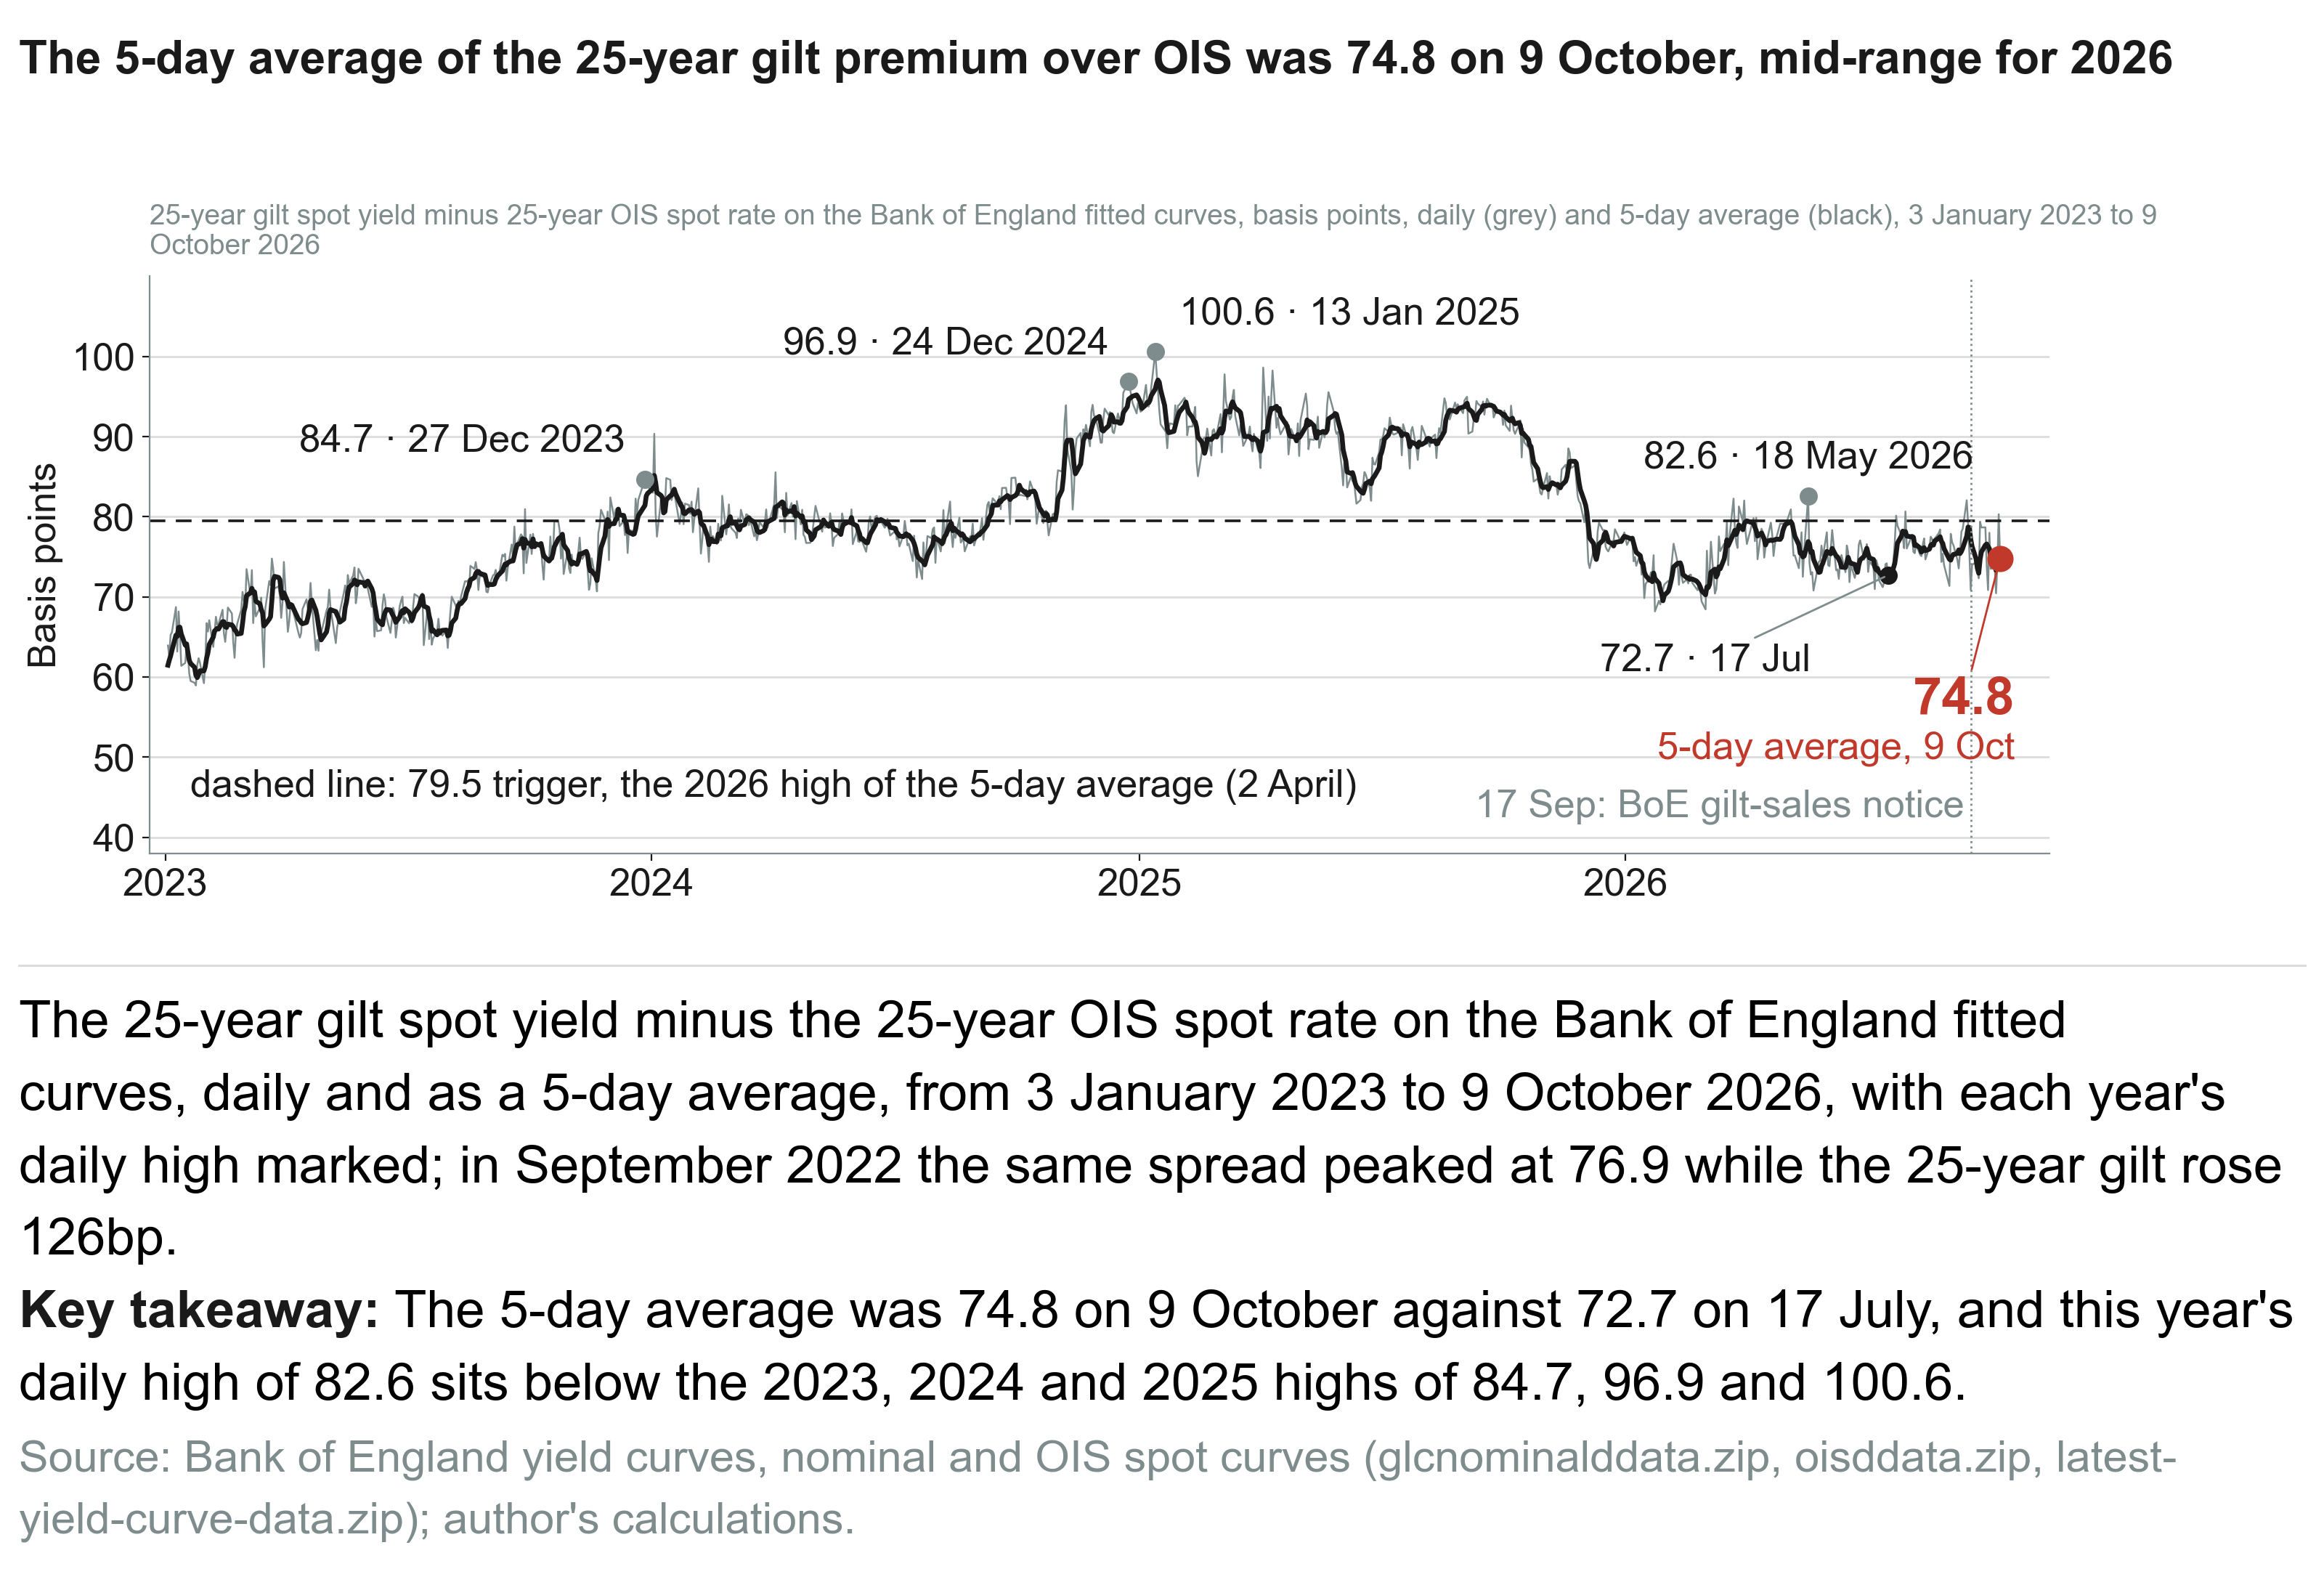
A UK premium in gilts would show up as extra yield over the Bank of England’s own OIS curve, the swap rate that tracks expected Bank Rate. If gilts priced the Budget, I would expect that gap to be near its highs, and the Bank’s curves put it below them. On 9 October the 25-year point yielded 75.1 basis points over OIS, a day after it jumped to 80.3, and its 5-day average was 74.8, against 72.7 on 17 July, which leaves it in the middle of this year’s range. The 5-day average was 77.6 on 14 September. Three days later the Bank’s market notice on gilt sales announced sales of £20 billion a year, would hold the £120 billion of longest dated gilts to maturity, and suspended its own gilt auctions until it publishes the details by April 2027. This year’s daily high, 82.6 basis points on 18 May, was lower than each of the last three years’ highs: 84.7 in 2023, 96.9 in 2024 and 100.6 in January 2025. The 20-year spread shows the same pattern. At 10 years the spread is the exception, with a 5-day average of 50.4 that is higher than 73% of this year’s readings.
The gauge has a blind spot, and I have to name it. Because the gauge subtracts the OIS curve, a premium that lifts swaps along with gilts barely registers: from 21 to 27 September 2022 the 25-year gilt rose 126 basis points and the 25-year OIS rate rose 109 basis points, so the spread peaked at only 76.9 basis points. Since 17 September the Bank’s hold on its longest gilts also tends to narrow the spread. The climb past 6% came mostly from abroad and from the Bank’s rate path. From 17 July to 9 October the Treasury 30-year yield rose 54 basis points and the Bank’s 2-year gilt rate rose 45, while the Bank’s own 30-year point rose 23, so long gilts lagged long Treasuries.
What moves sterling
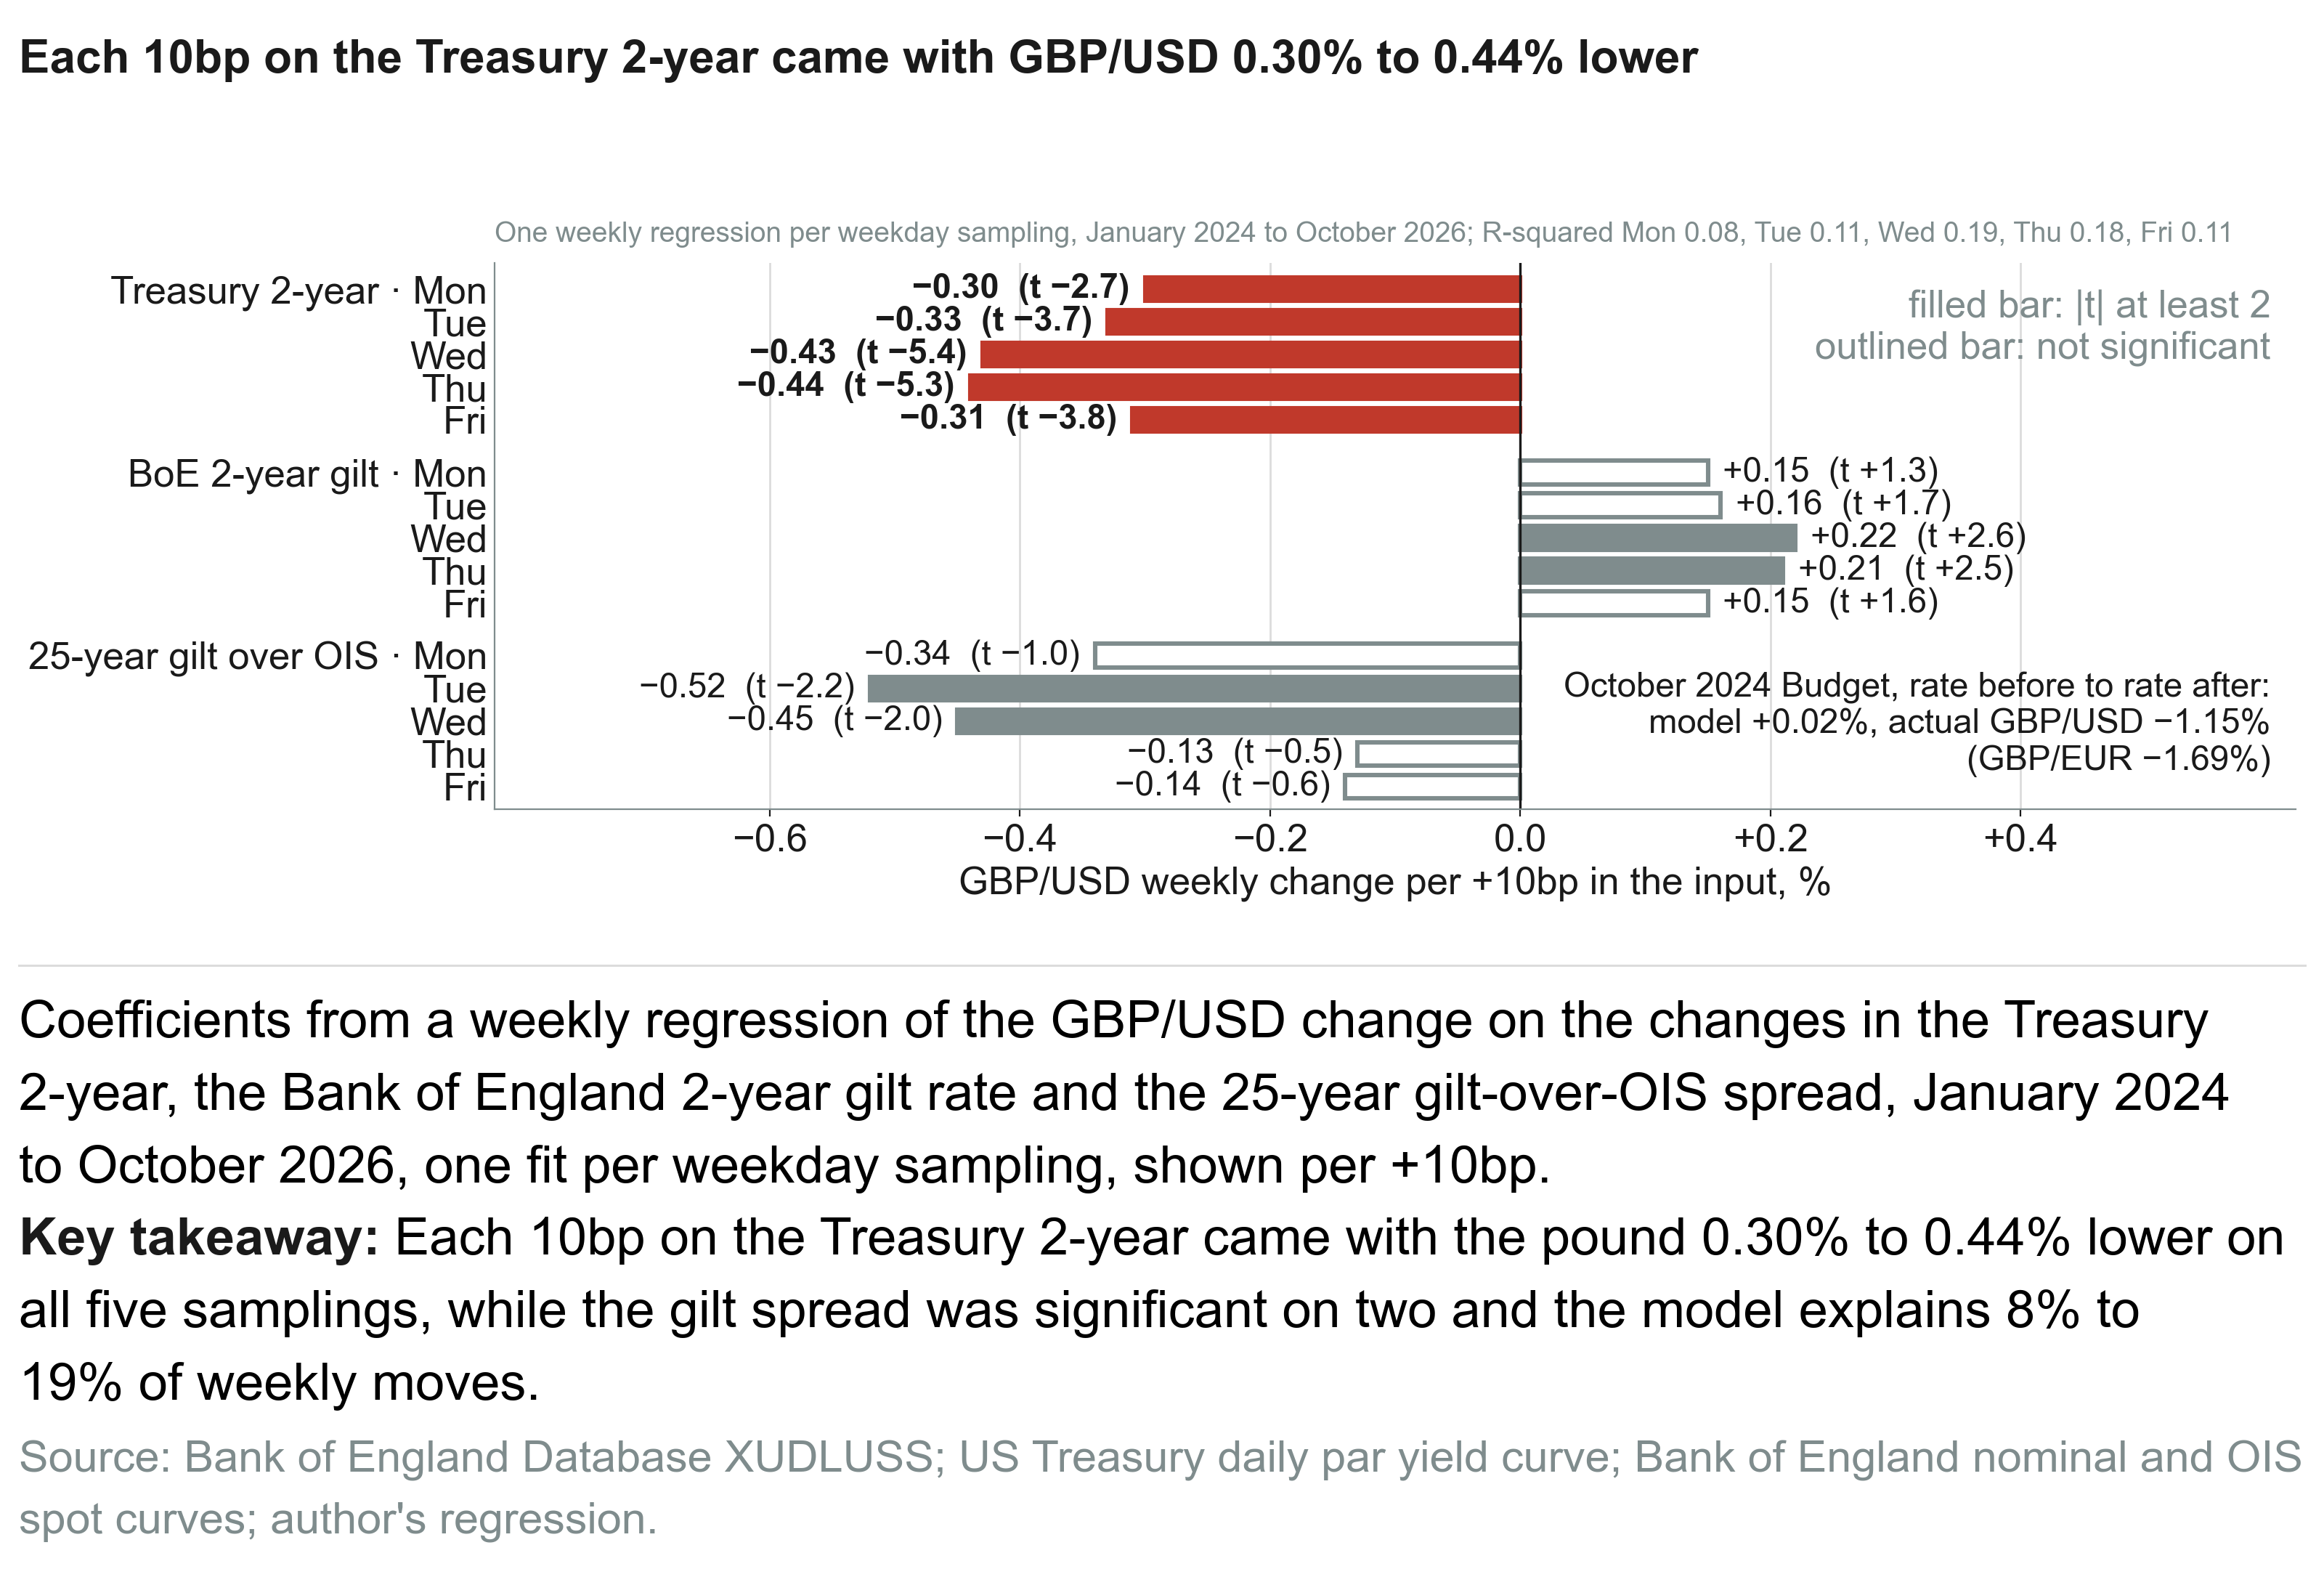
Investors who fear a government’s finances sell its bonds and its currency together, so a wider gilt premium should come with a weaker pound. I tested that. I regressed GBP/USD’s weekly change on the Treasury 2-year, the Bank’s 2-year gilt rate and that 25-year spread, from January 2024 to October 2026, once for each weekday sampling. Each 10 basis points on the Treasury 2-year came with the pound 0.30% to 0.44% lower, significant on all five samplings. Each 10 on the Bank’s 2-year came with it 0.15% to 0.22% higher, and each 10 on the gilt spread with it 0.13% to 0.52% lower, significant on two. That model explains 8% to 19% of weekly moves.
Two legs since July show the dollar side at work. From 17 July to 10 September the Treasury 2-year rose 38 basis points and GBP/USD rose 0.6%. After 10 September the pair turned. The Treasury 2-year rose another 24 basis points, and GBP/USD went from 1.3531 down to 1.3220 by 12 October, a 2.3% fall by my arithmetic. Over the same weeks the euro lost 3.9% against the dollar and sterling gained 1.7% against the euro, so the move was a dollar rally. My model misses Budget days as well. In October 2024 it called the Budget flat, and the pound fell 1.1% against the dollar and 1.7% against the euro from the rate before it to the rate after.
The crowd and past Budgets
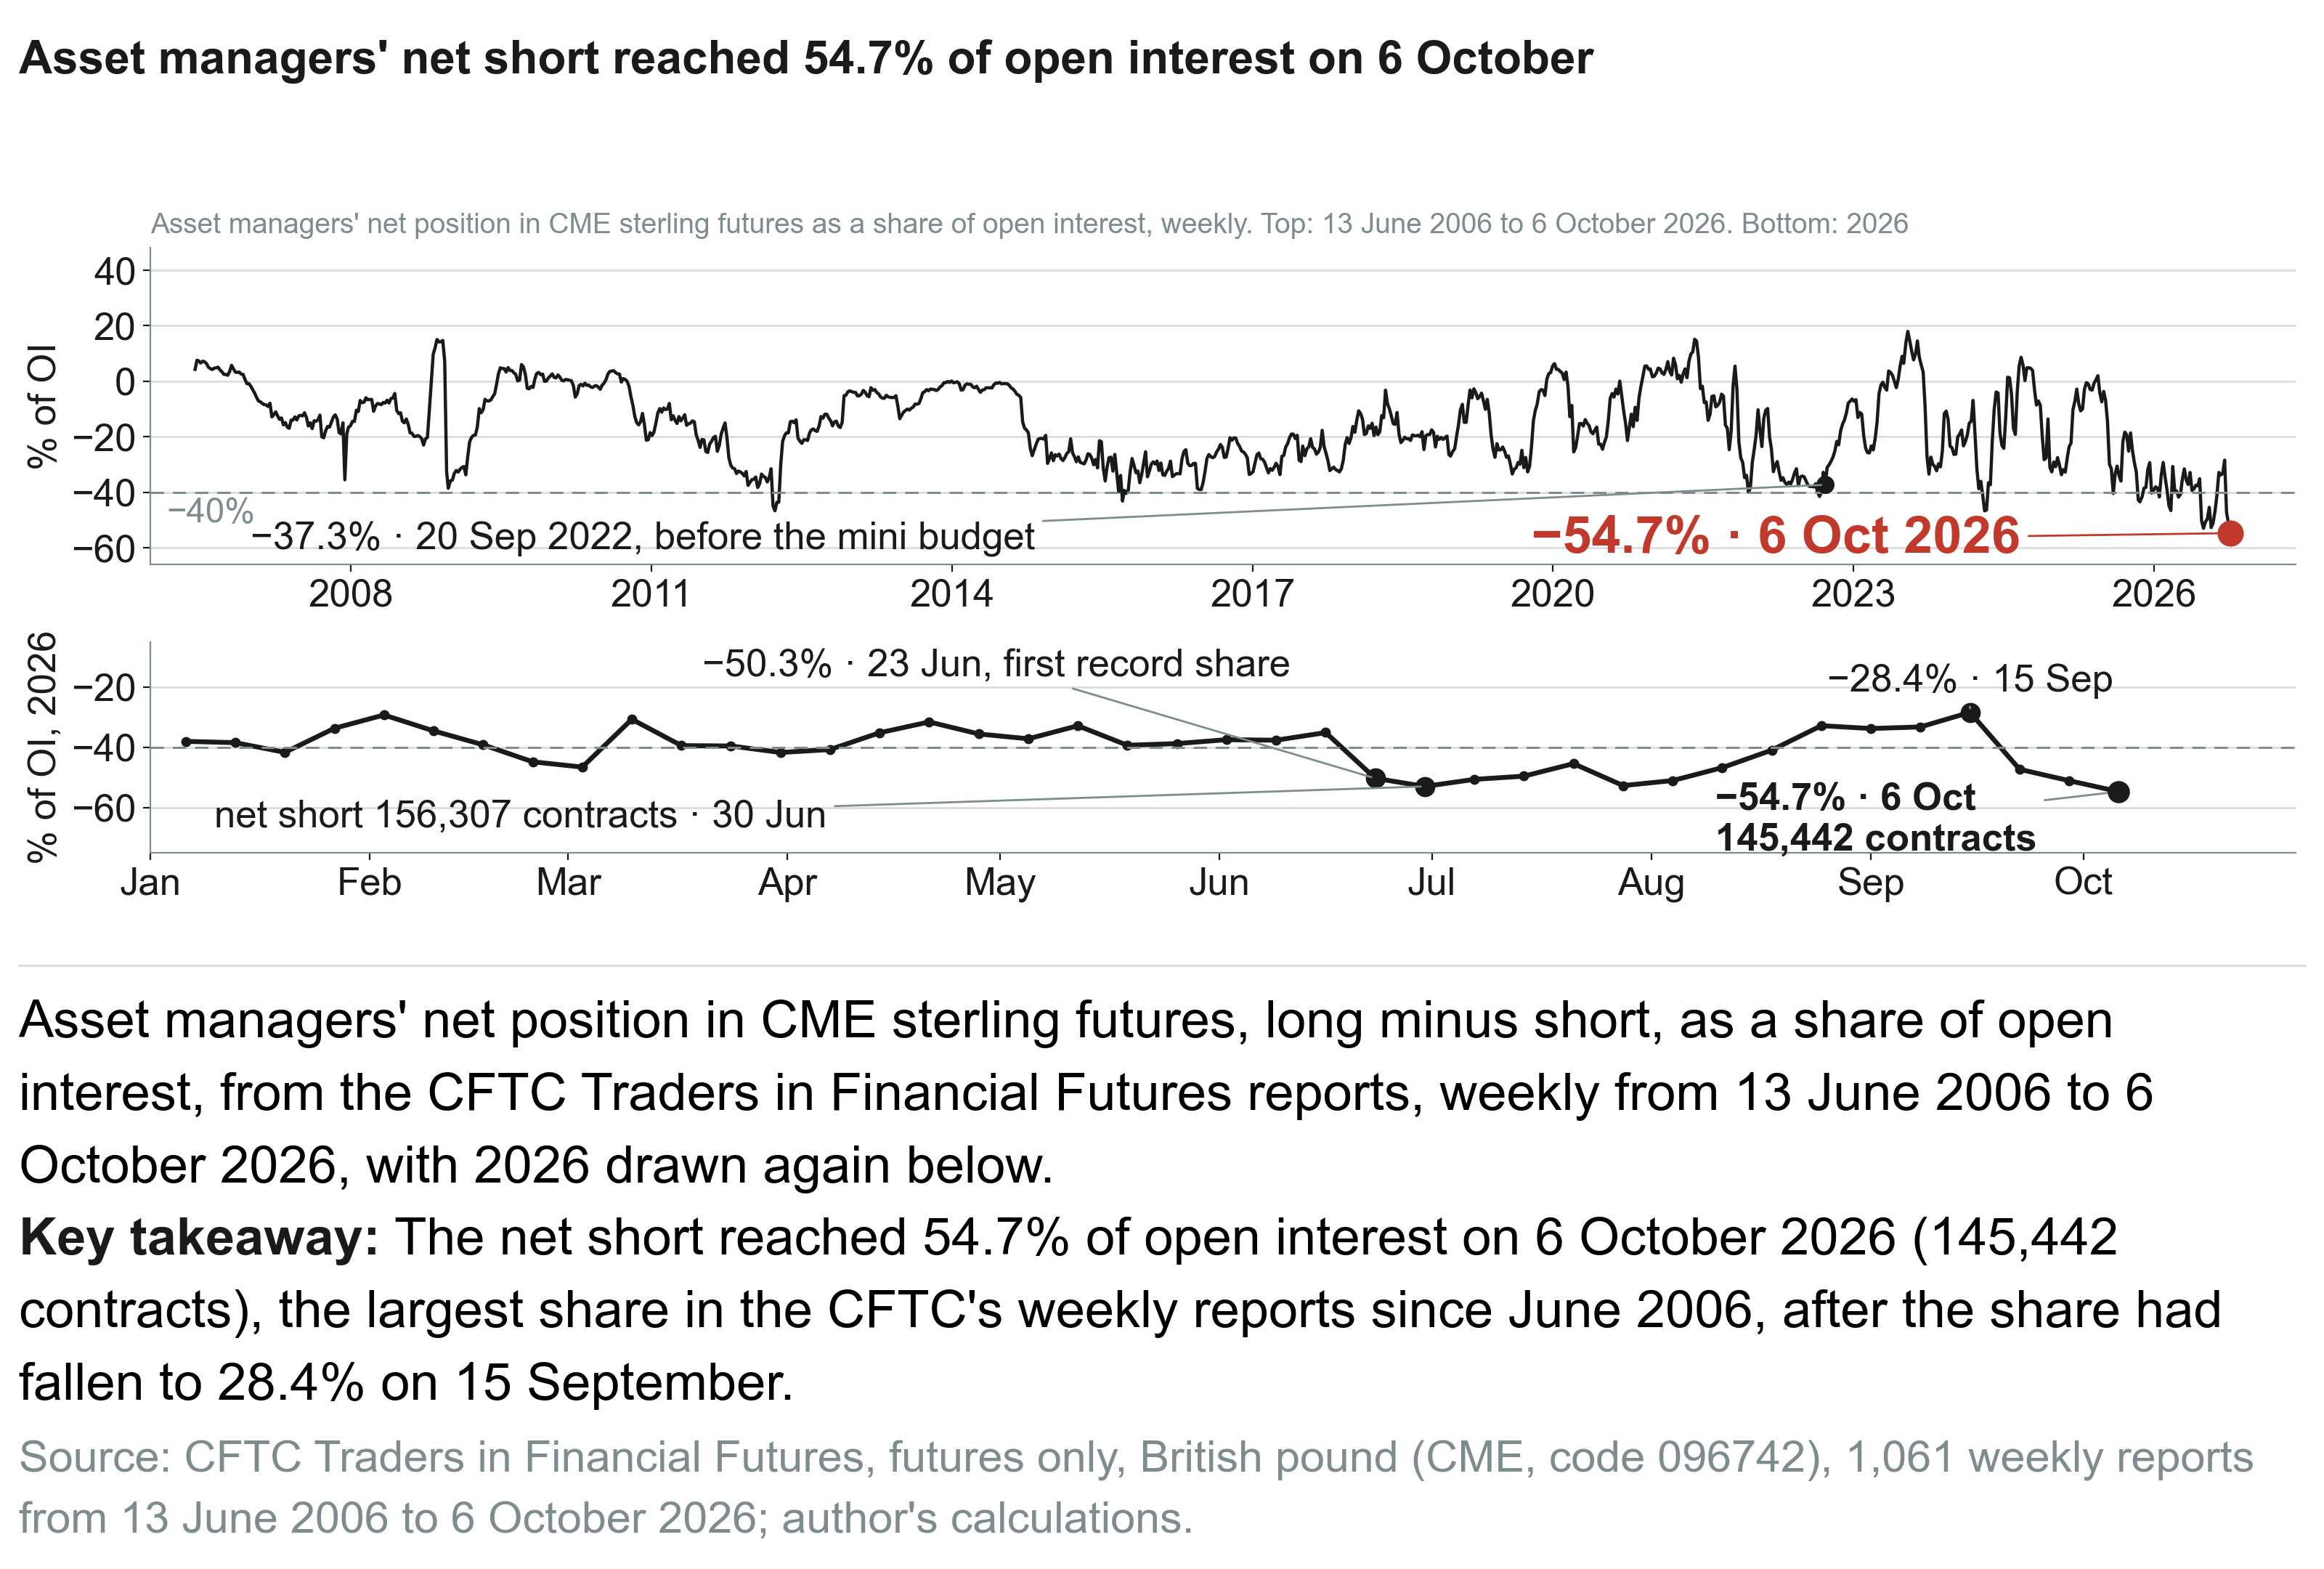
I went through every CFTC report on CME sterling futures. In the report for Tuesday 6 October, asset managers’ net short was 145,442 contracts, 54.7% of open interest, the largest share in the CFTC’s weekly reports since June 2006 by my count. Leveraged funds were net long 12,432. That share first set a record on 23 June, before the change of prime minister. In contracts, the net short peaked at 156,307 on 30 June. The share then fell to 28.4% by 15 September and rebuilt to 54.7%, so I read the short as a view on sterling more than on the Budget. The asset manager category includes pension funds, insurers and mutual funds, so part of the short may hedge their UK holdings. Shorts this large have not predicted much: in the 12 earlier spells since 2012 with the share past 40% short, GBP/USD rose over the following 13 sessions in eight. A large short didn’t prevent the 2022 fiscal shock either. On 20 September 2022 the asset managers’ share was more short than in 97% of the earlier reports, and GBP/USD fell 6.4% from the rate 12 sessions before the mini budget to the rate after.
Budgets have a record of their own, so I counted it. I took the 20 UK Budgets, Autumn and Spring Statements and the 2022 mini budget since March 2016 and measured GBP/USD from the rate 12 sessions before each one to the rate after it, the window this call covers. GBP/USD rose in 13 of the 20 windows, with a median move of +0.57%, and about one in seven random sets of 20 windows drawn from every 13-session stretch since 2016 reaches a median that high. Six of the 20 windows touched a 2.5% move before they ended, four of them on the downside, though several came with shocks beyond the Budget. Four windows ended more than 2.5% lower, against 8% of all 13-session stretches since 2016.
Position and Risk
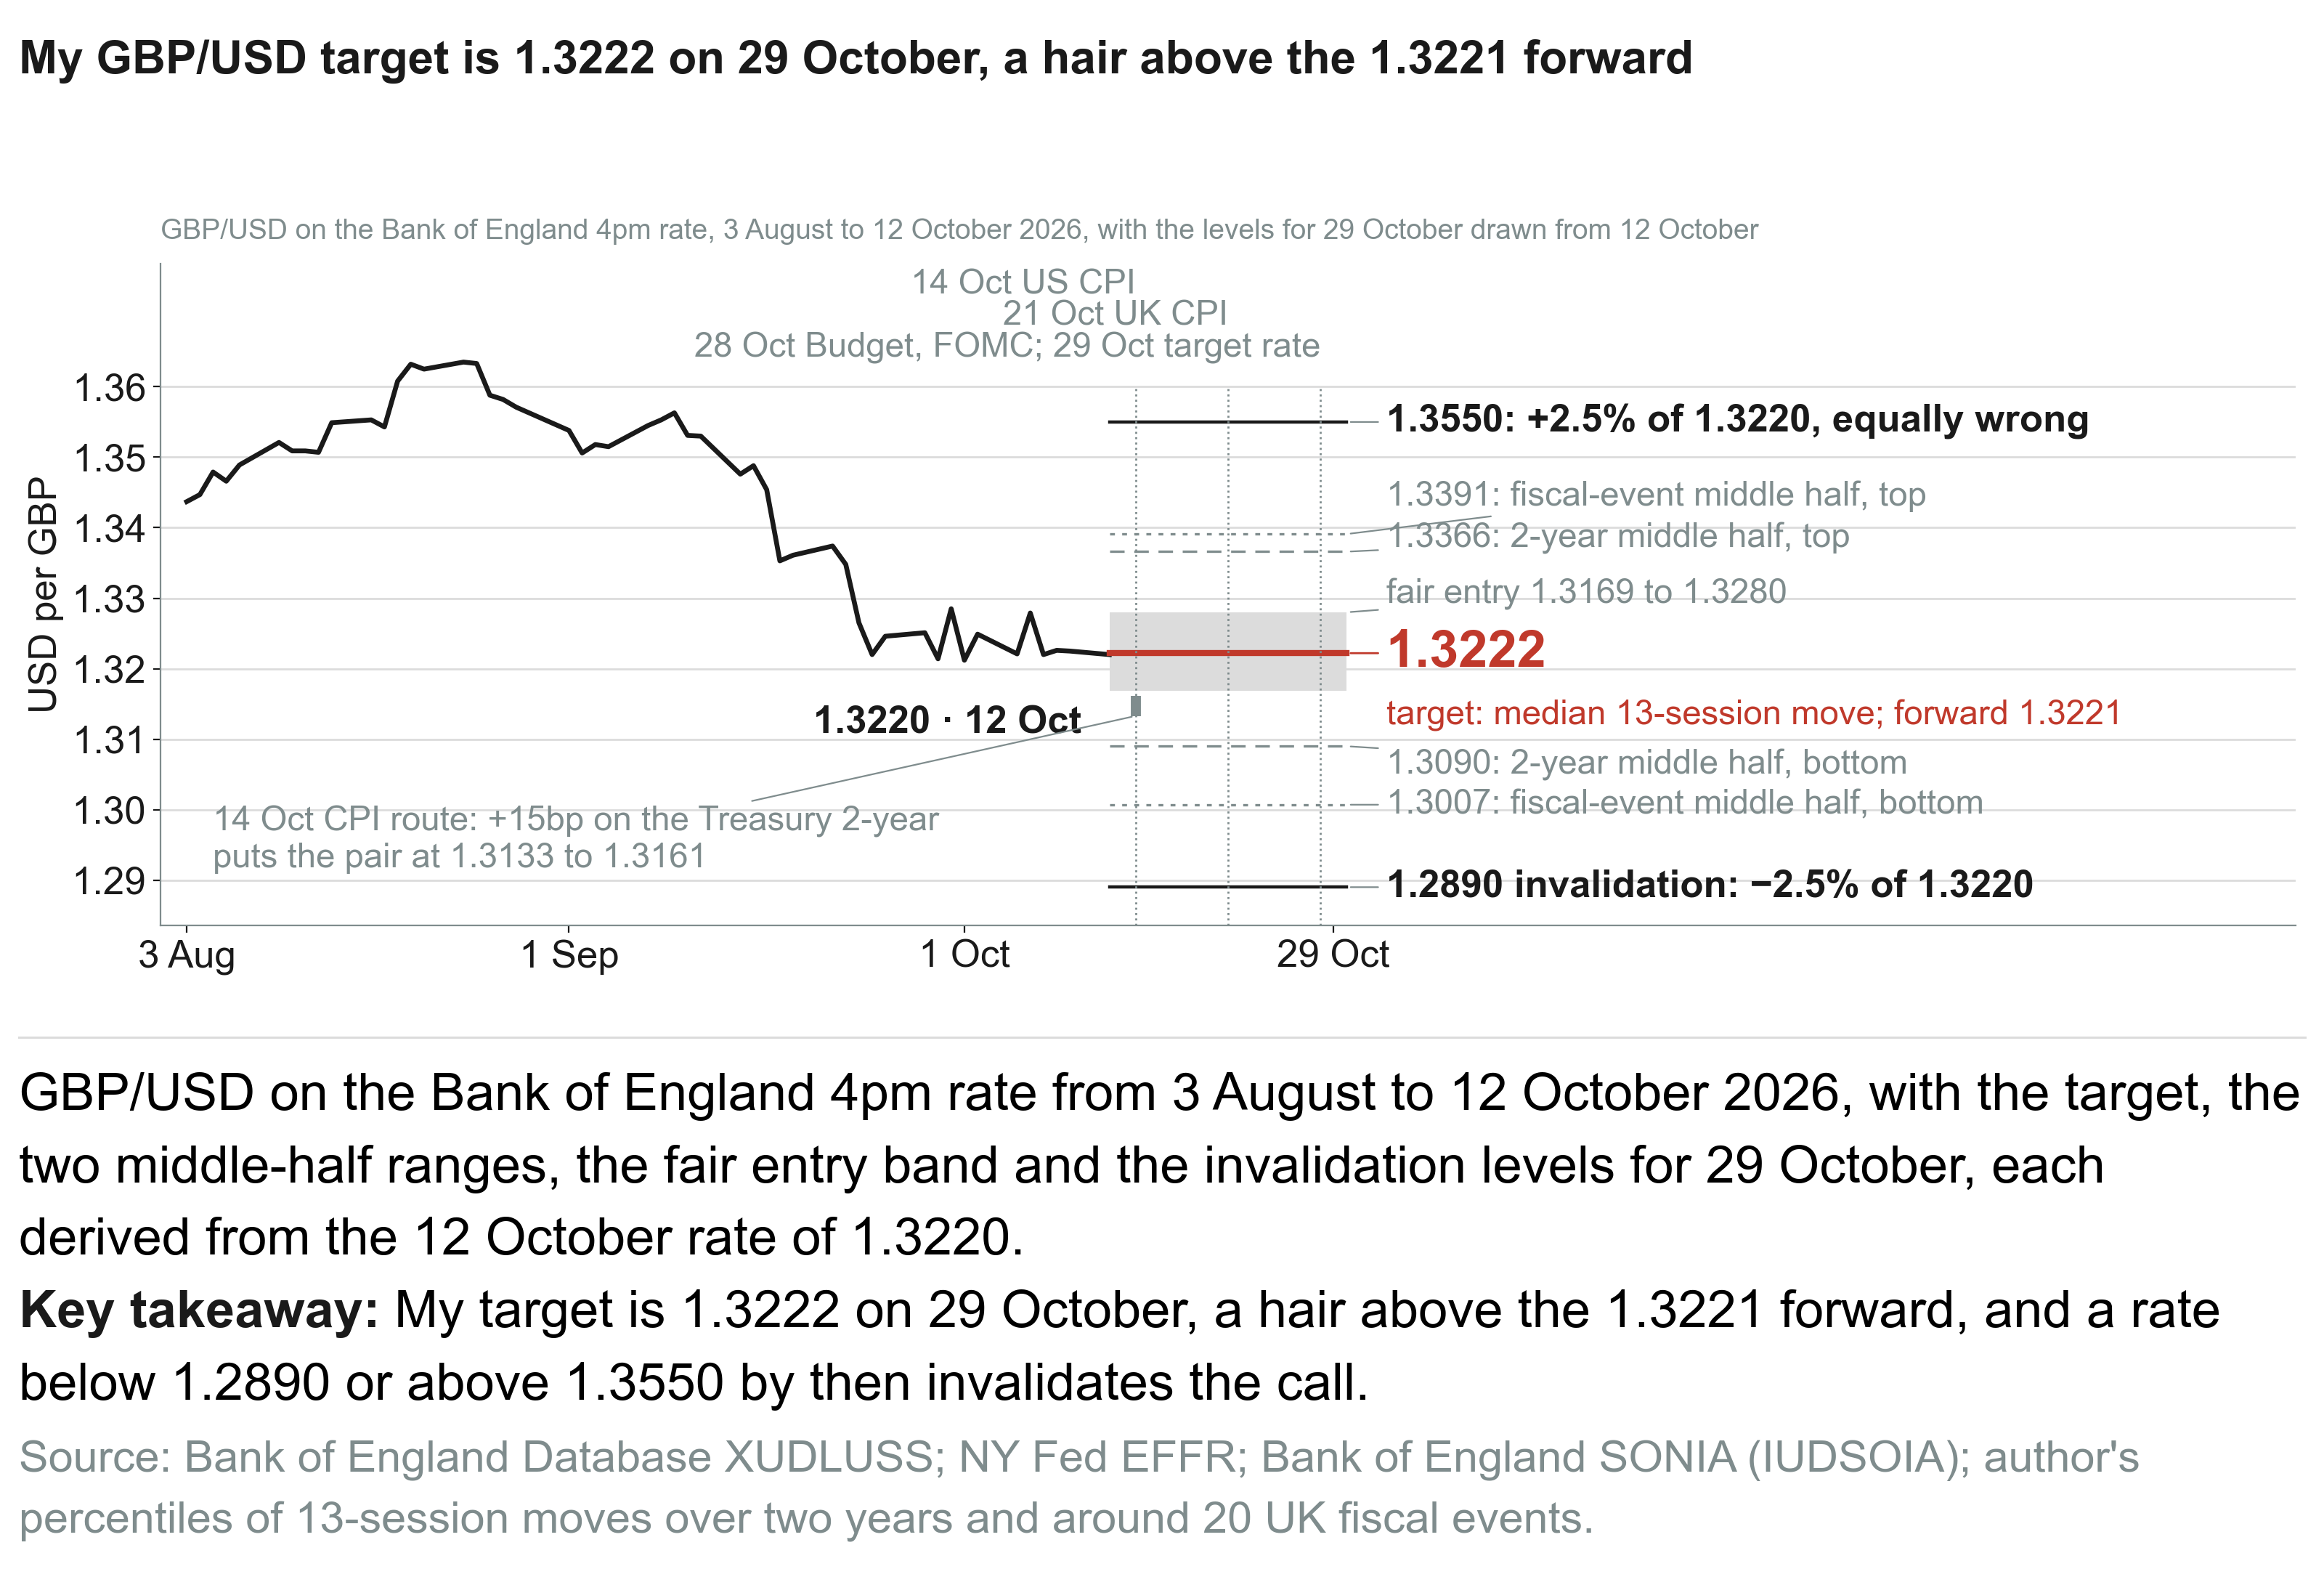
I expect GBP/USD spot, read off the Bank of England’s 4pm rate, to trade sideways into 29 October, with the risk skewed lower. My target is a rate near 1.3222 on 29 October: the median 13-session move over the past two years, a rise of 0.015%, applied to the 1.3220 of 12 October. That is slightly above the 1.3221 forward implied by the Fed’s 3.88% effective rate on 8 October and SONIA’s 3.73% on 9 October. Half of those 2-year moves landed between 1.3090 and 1.3366, and around the last 20 fiscal events the middle half ran wider, from 1.3007 to 1.3391. I’d put fair entry at 1.3169 to 1.3280, the 40th to 60th percentile of the 2-year moves. A rate below 1.2890, 2.5% under 12 October’s, by 29 October invalidates the call, and one above 1.3550, 2.5% over it, would leave me equally wrong. Over the past two years 5.5% of 13-session stretches touched the lower level and 5.7% touched the upper one, about two-fifths of the rate since 2016. Six of the 20 fiscal windows touched one or the other.
The case for lower is the stronger tail, and I won’t pretend otherwise. Ebury’s view, the October 2024 Budget and the 2022 mini budget all suggest a fall, and four of the six fiscal windows that touched a 2.5% move did so on the downside. Weekly data don’t capture the Budget day itself, so I watch the gilt spread. My trigger is the 5-day average clearing 79.5 basis points, this year’s highest, by 28 October. If the average clears that level while the pound falls against the euro, I’d read the premium as growing past what’s priced and lean lower. Getting there needs a rise of 4.7 basis points, which 8.0% of 13-session windows since 2024 produced. The signal is slow: in 2022 the average cleared a rise that size only on 26 September, after GBP/USD had already fallen 4.8% from 21 September. For the dollar, the test is the 14 October CPI report, where a 15 basis point rise in the Treasury 2-year would put the pair between 1.3133 and 1.3161 on the slopes above, inside my range. The ECB’s Governing Council meets on 28 and 29 October as well. The fiscal windows’ median of +0.57% and the record short both fall short of statistical significance, so I keep the centre where it is and leave the risk in the tails.
Conclusion
Five dates decide the call. US CPI is released on 14 October, UK CPI on 21 October, and the Budget and the Fed’s decision both fall on 28 October. I’ll be marked against the 29 October rate, with 1.3222 as my base case and 1.2890 and 1.3550 as the levels where I’d be wrong. The Bank of England’s 5 November decision comes last. For gilts, the next test is the Bank’s plan for gilt sales, due by April 2027. Over six to twelve months I’d expect the pound to track US rates more closely than gilt yields. FX Empire’s GBP/USD page carries live quotes, and its economic calendar lists the US and UK CPI dates. My 7 October EUR/USD piece found the dollar drove most of the euro’s fall as well.