


EUR/USD
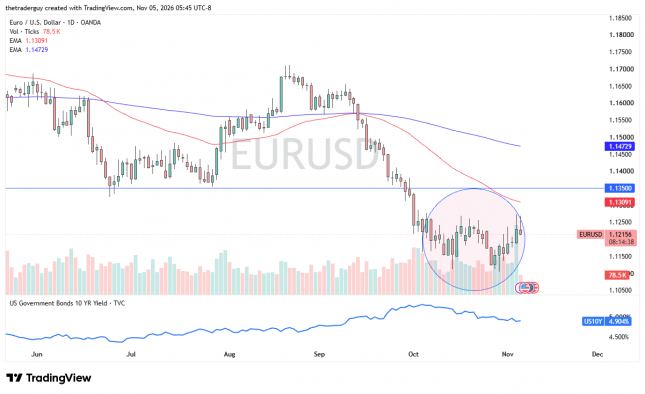
We continue to see the same area offer plenty of resistance in the form of 1.1250. This is an area that has been very difficult to break above since the beginning of October, and that does make a certain amount of sense, as the European Union has a lot to worry about right now, not the least of which is inflation coming out of the energy sector.
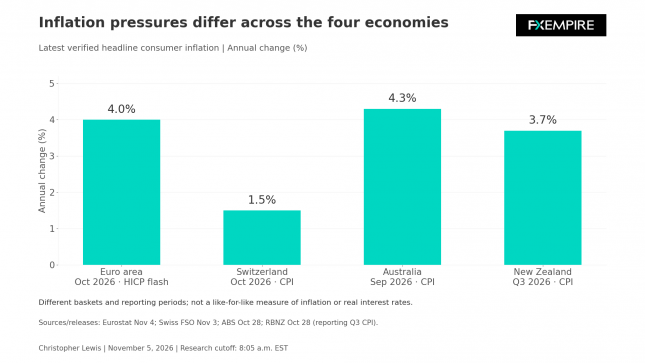
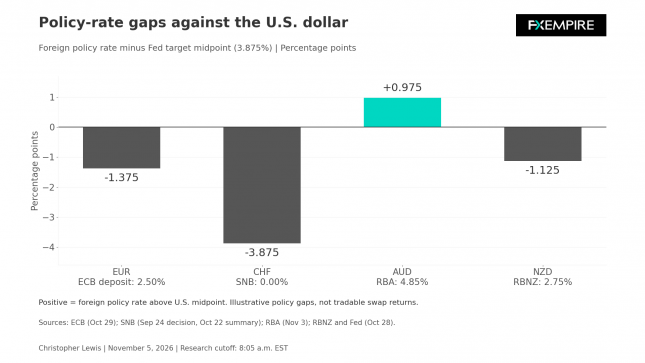
Energy inflation reached 20.8% in the month of October. The measure excluding energy, food, and tobacco remained at 2.5%, so it suggests that there are some very uneven concerns there. The interest rate being 2.5% and held on October 29 by the ECB, while the FOMC did the same, means that the interest rate differential remains as is.
Going into the non-farm payroll announcement tomorrow, I suspect any rallies will continue to see selling.
USD/CHF
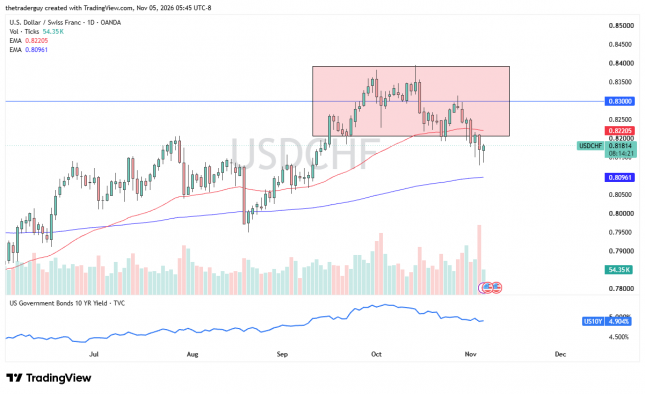
The U.S. dollar against the Swiss franc, of course, is a pair that I talk about a lot. I like the yield advantage, and really, at this point, the Fed’s policy range being between 3.75% and 4% creates a wide gap in the short-term policy settings.
The November 3 Swiss inflation release showed October consumer prices rising 0.2% and 1.5% annually. Heating oil, petrol, and diesel contributed to most of the monthly increase. It does add a little bit of an inflation consideration for the Swiss National Bank, but it doesn’t necessarily contribute to them making an immediate policy decision.
As such, I continue to buy dips. I think we are building up the setup to go higher, with the caveat that the jobs report comes out on Friday.
AUD/USD
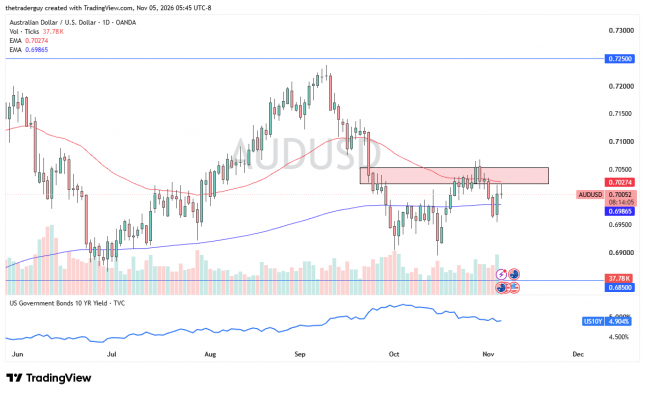
The Australian dollar has fresh domestic support from monetary policy and trade. On November 3, the RBA increased its cash rate by 25 basis points to 4.85%, actually making it pay against the U.S. dollar in the carry trade, with a 6-3 vote, though. And that’s the problem. The three dissenting voters have taken some of the wind out of the sails for the Australian dollar.
EUR/USD Price Forecast
Every new EUR/USD analysis as it publishes, today's technical signal and key levels, live price — on one page.
See all EUR/USD forecastsWe continue to see the 0.7050 level causing a bit of a barrier, and it’s not until then that I would be bullish on the Australian dollar. When we look at the longer-term charts, we’ve been bouncing around below the 0.7250 level and above the 0.6850 level for some time.
I think right now we’re in a bit of a holding pattern. At this point, I do favor the downside slightly, and just for this session.
NZD/USD
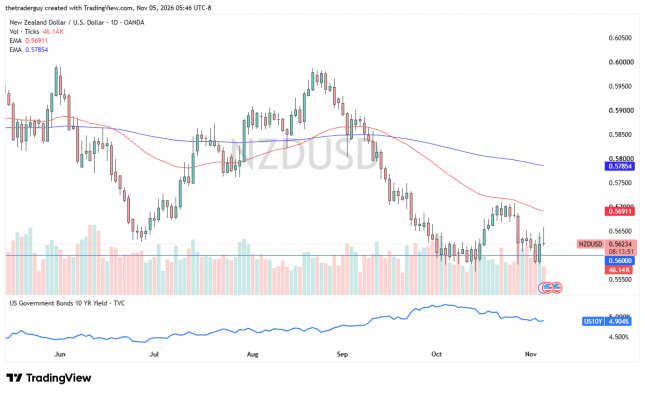
The New Zealand dollar continues to give up any attempt at gains, it seems, as the 0.5650 level has offered a pretty significant barrier. It has the most recent RBNZ policy decision as a hold at 2.75% on October 28 in a 4-3 vote. Three of the members did prefer a quarter-point increase, so that’s worth watching.
But at the same time, it’s worth noting that the Federal Reserve is expected to raise by a quarter point in December. So essentially, once it’s all said and done, it’s a wash.
We continue to hang around the 0.56 level. I continue to look at rallies in the Kiwi dollar as selling opportunities. Pretty much any time we rise 50 pips and show signs of exhaustion, I continue to look for selling opportunities. A break below 0.5550 opens up a longer-term grind lower.