Advertisement
Advertisement
Silver Punches Above $18.00
By:
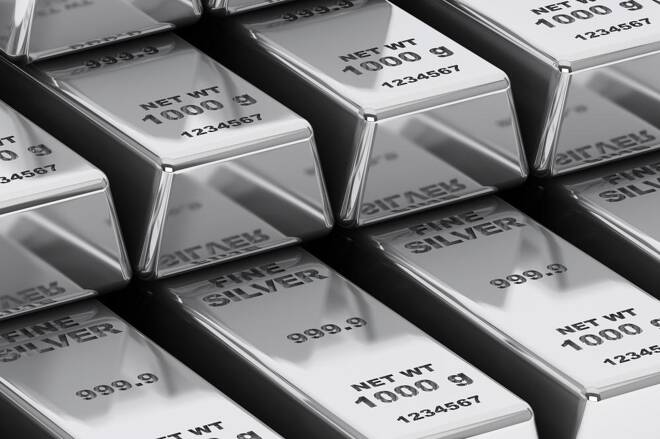
Silver has been hovering at 17.50 for the better part of a week, but has finally broken the impasse with some gains. The metal has crossed above the symbolic round number of 18.00 on Friday and the upward trend could continue next week.
Silver has embarked on a late-week rally and punched above the symbolic $18.00 level on Friday. In the European session, the pair is trading at $18.04, up $0.23 or 1.31%.
Silver Climbs to 4-Week High
After trading sideways for four straight sessions, silver has flexed some muscle. The metal climbed 1.4% on Thursday and has added another 1.3% in Friday trade. Earlier on Friday, silver punched past the $18.00 level, which has psychological significance.
Soft U.S. Durable Goods Orders Boosts Silver
U.S. durable goods orders reports disappointed in September. Durable goods orders disappointed, with a decline of 1.1%. This marked the first contraction in four months. The core reading came in at -0.3%, compared to a 0.5% gain in the previous release. As well, manufacturing PMI came in at 51.5, which is barely in expansion territory. These weak releases underscore a weak manufacturing sector, which has weighed on the economy. Precious metals such as gold and silver have taken advantage, as concerned investors moved into safe-haven assets after the soft economic numbers. It is interesting to note that silver’s recent path has mirrored that of gold. On Thursday, gold broke through a key barrier on Thursday, pushing above the $1500 level. This followed a week of sideways trading.
Silver Technical Analysis
About the Author
Kenny Fisherauthor
Kenny is an experienced market analyst, with a focus on fundamental analysis. Kenny has over 15 years of experience across a broad range of markets and assets –forex, indices and commodities.
Advertisement
