


As we open trading on Friday, a new Silver Institute and Metals Focus forecast gives silver a more specific fundamental story than the usual industrial metal versus safe-haven split that we see through most financial media.
Deficits Remain
The market is still expected to post a sixth consecutive annual deficit this year, but the projected shortfall has narrowed to 35 million ounces from 54 million last year. Total demand is forecast to fall 5% to 1.081 billion ounces, while total supply is expected at 1.045 billion ounces. The cumulative deficit for the last 5 years is estimated at roughly 746 million ounces.
These are full-year forecasts, not necessarily audited final totals, but they do describe a market that remains structurally undersupplied without the same degree of near-term tightness as we had seen last year. Metals Focus expects total industrial demand to decline 3% to 640 million ounces. Solar is the weak spot at the moment, as installations have fallen short of expectations, especially in China, and high silver prices have encouraged manufacturers to reduce silver loading or substitute other materials.
Outside photovoltaics, however, industrial demand is forecast to rise 4.5% to 492 million ounces, where vehicle electrification, charging infrastructure, and brazing alloys and solders are providing support. This is the better way to look at this rather than calling industrial demand uniformly weak. It just depends on where we are talking.
Investment Flows Temper the Deficit Story, Though
The Institute’s November 12 release says global silver-backed ETP holdings stood at 1.25 billion ounces on November 3, down 55 million ounces since the start of the year. Metals Focus forecasts net outflows of 450 million ounces for this year. The report says released metal from ETP selling, alongside a smaller market deficit, has eased physical market tightness.
Silver Price Forecast
Every new Silver analysis as it publishes, today's technical signal and key levels, live price — on one page.
See all Silver forecastsThat being said, rates are a massive headwind at the moment. The U.S. Treasury’s November 12 real par yields were at 2.64% at 5 years and 2.86% at 10 years, up from 2.35% and 2.63% on November 6. Higher real yields raise the opportunity cost for holding a non-yielding asset such as silver, although the relationship isn’t necessarily automatic.
October CPI
October CPI, released November 10, rose 0.4% month over month, while core CPI rose 0.3%. The BLS could not publish year-over-year October 2026 changes for the affected series because, in October 2025, there were appropriations fights in Congress which delayed the release. The monthly data shows headline inflation cooled from September’s 0.6% pace, but core inflation held.
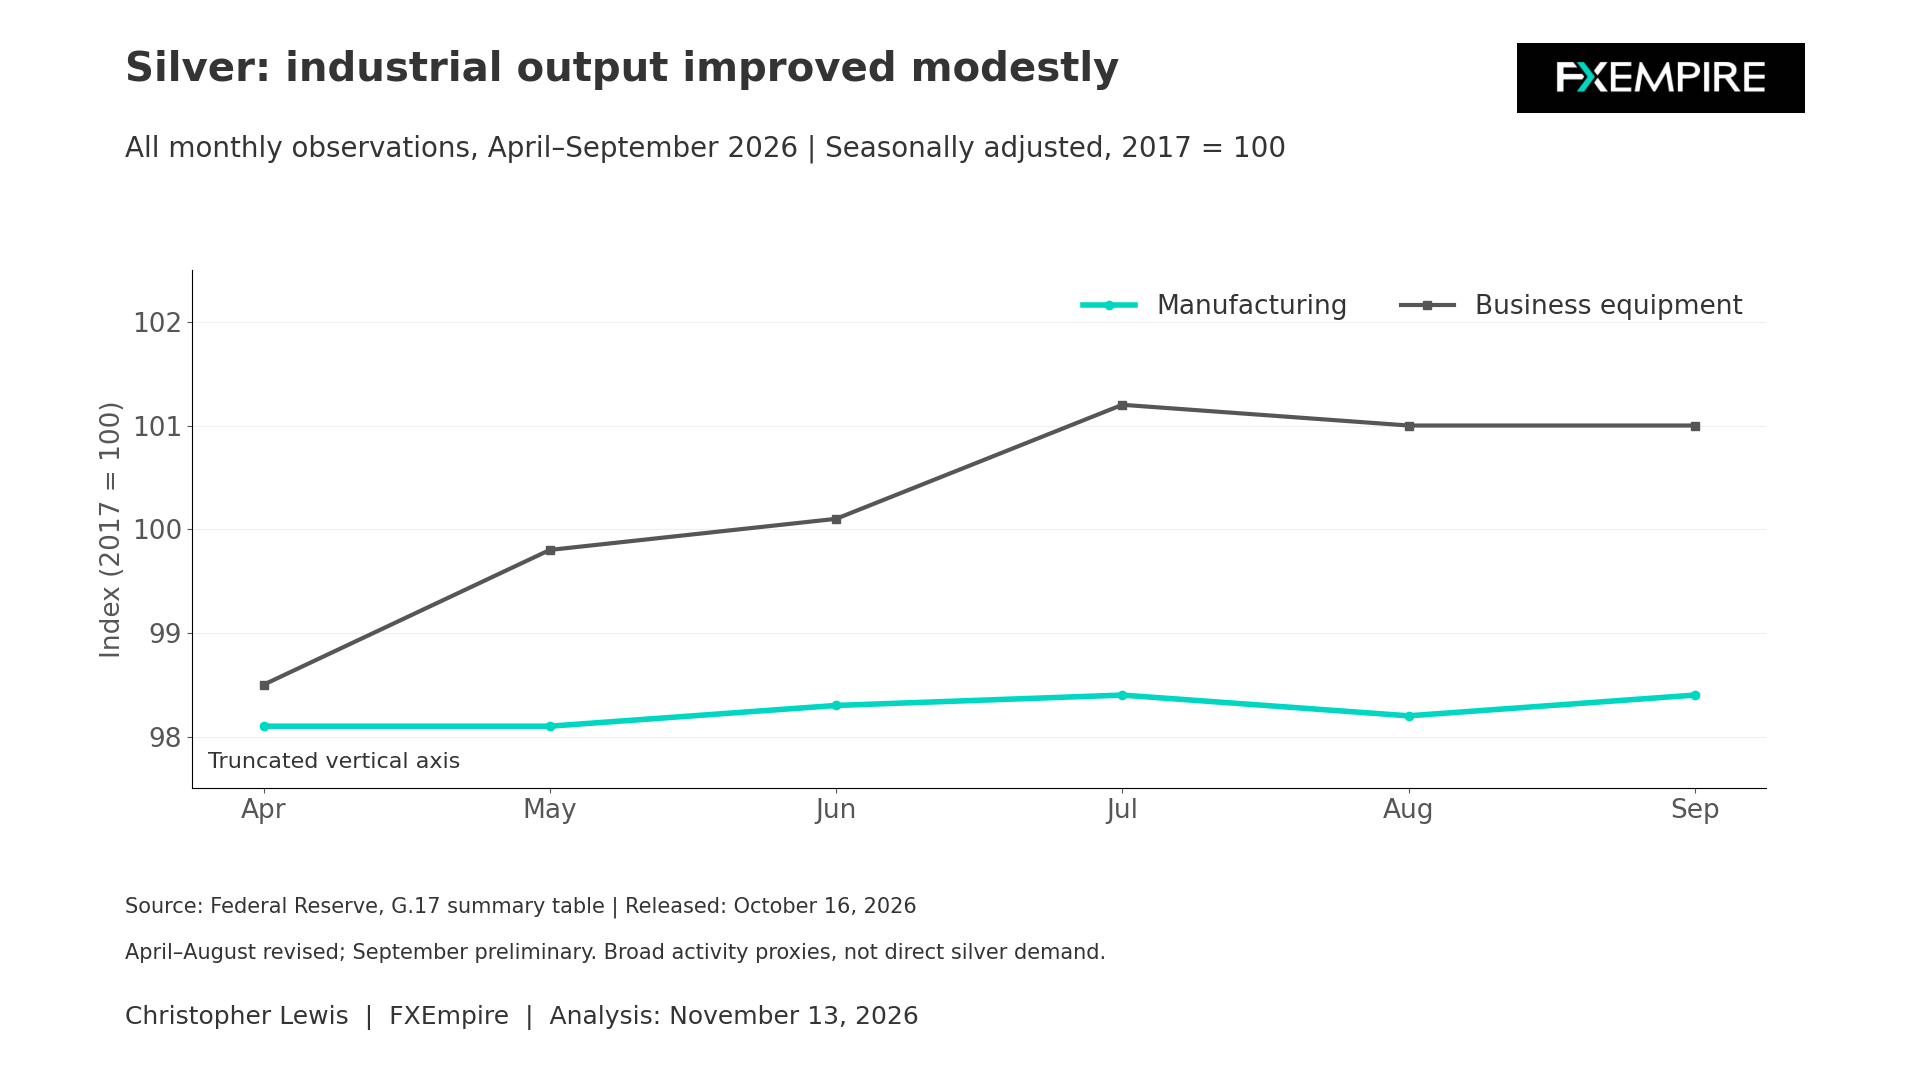
The latest industrial production evidence is September’s Federal Reserve G.17 report. Total industrial production increased 0.7%, while manufacturing output rose 0.3%. Electrical equipment and machinery were among the stronger segments, but the index measures factory output, not necessarily silver consumption. The next G.17 release is scheduled for November 17.
Mixed Views
The near-term view is somewhat mixed, with the fresh demand forecast making the structural case less bullish than the word deficit would suggest. The 35 million-ounce projected gap is supportive over time, but is smaller than last year’s, and forecast ETP outflows are returning metal to the market. Persistent high real yields continue to add pressure.
The Charts
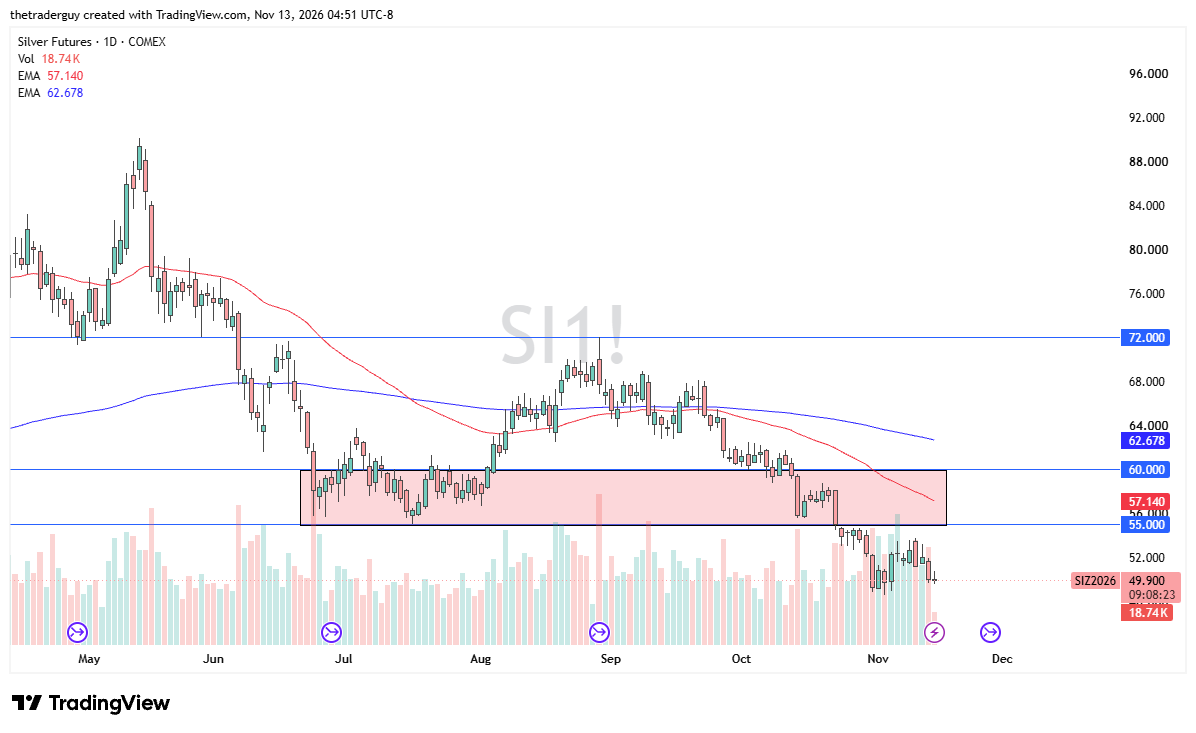
The technical analysis looks rather bleak, as the market did try to rally a bit early during the session, but gave back those gains. This remains a market that you fade on short-term rallies from everything I see on the charts, and signs of exhaustion continue to present themselves as opportunities.