


Silver faces some pressure on Tuesday from high real yields and a modest improvement in official U.S. industrial activity. This combination is especially relevant because silver trades both as a precious metal and an industrial input.
The latest official preliminary daily bulletin showed the December 2026 silver contract settling at $52.60 per troy ounce on Monday. The monetary side remains a bit of a headwind, though. The U.S. Treasury recorded a 5-year real yield of 2.35% and a 10-year real yield of 2.63% on November 6. The 5-year yield spent last week between 2.31% and 2.39%, while the 10-year remained between 2.60% and 2.65%. Elevated inflation-adjusted returns raise the opportunity cost of holding silver, although the relationship is not always constant. Industrial expectations, supply constraints, investment flows, and gold market direction can all override the yield signal.
Mildly Positive News from Industry
The industrial evidence is mildly constructive, but not strong enough to provide the idea of a new demand surge. The Federal Reserve’s G.17 industrial production release, published on October 16 with preliminary September data, showed the manufacturing index at 98.4 in September, up from 98.2 in August and 98.1 in April, on a seasonally adjusted 2017=100 basis. The business equipment index stood at 101.0 in August and September after rising from 98.5 in April.
Manufacturing Output
In September, manufacturing output increased 0.3% from the previous month. Primary metals, machinery, and electrical equipment, appliances, and components each posted gains of 1% or more, while motor vehicles and automotive parts fell 3% in that same time frame. These broad categories connect to the idea of the silver industrial narrative through electrical machinery and fabrication demand, but they are not direct measurements of consumption. They also describe September rather than what is going on today, but it does give us a bit of a backdrop on what has been going on.
The chart underneath therefore presents them as context, not necessarily evidence that physical silver demand rose by a specific amount. The next G.17 report is scheduled for November 17 at 9:15 a.m. Eastern Standard Time.
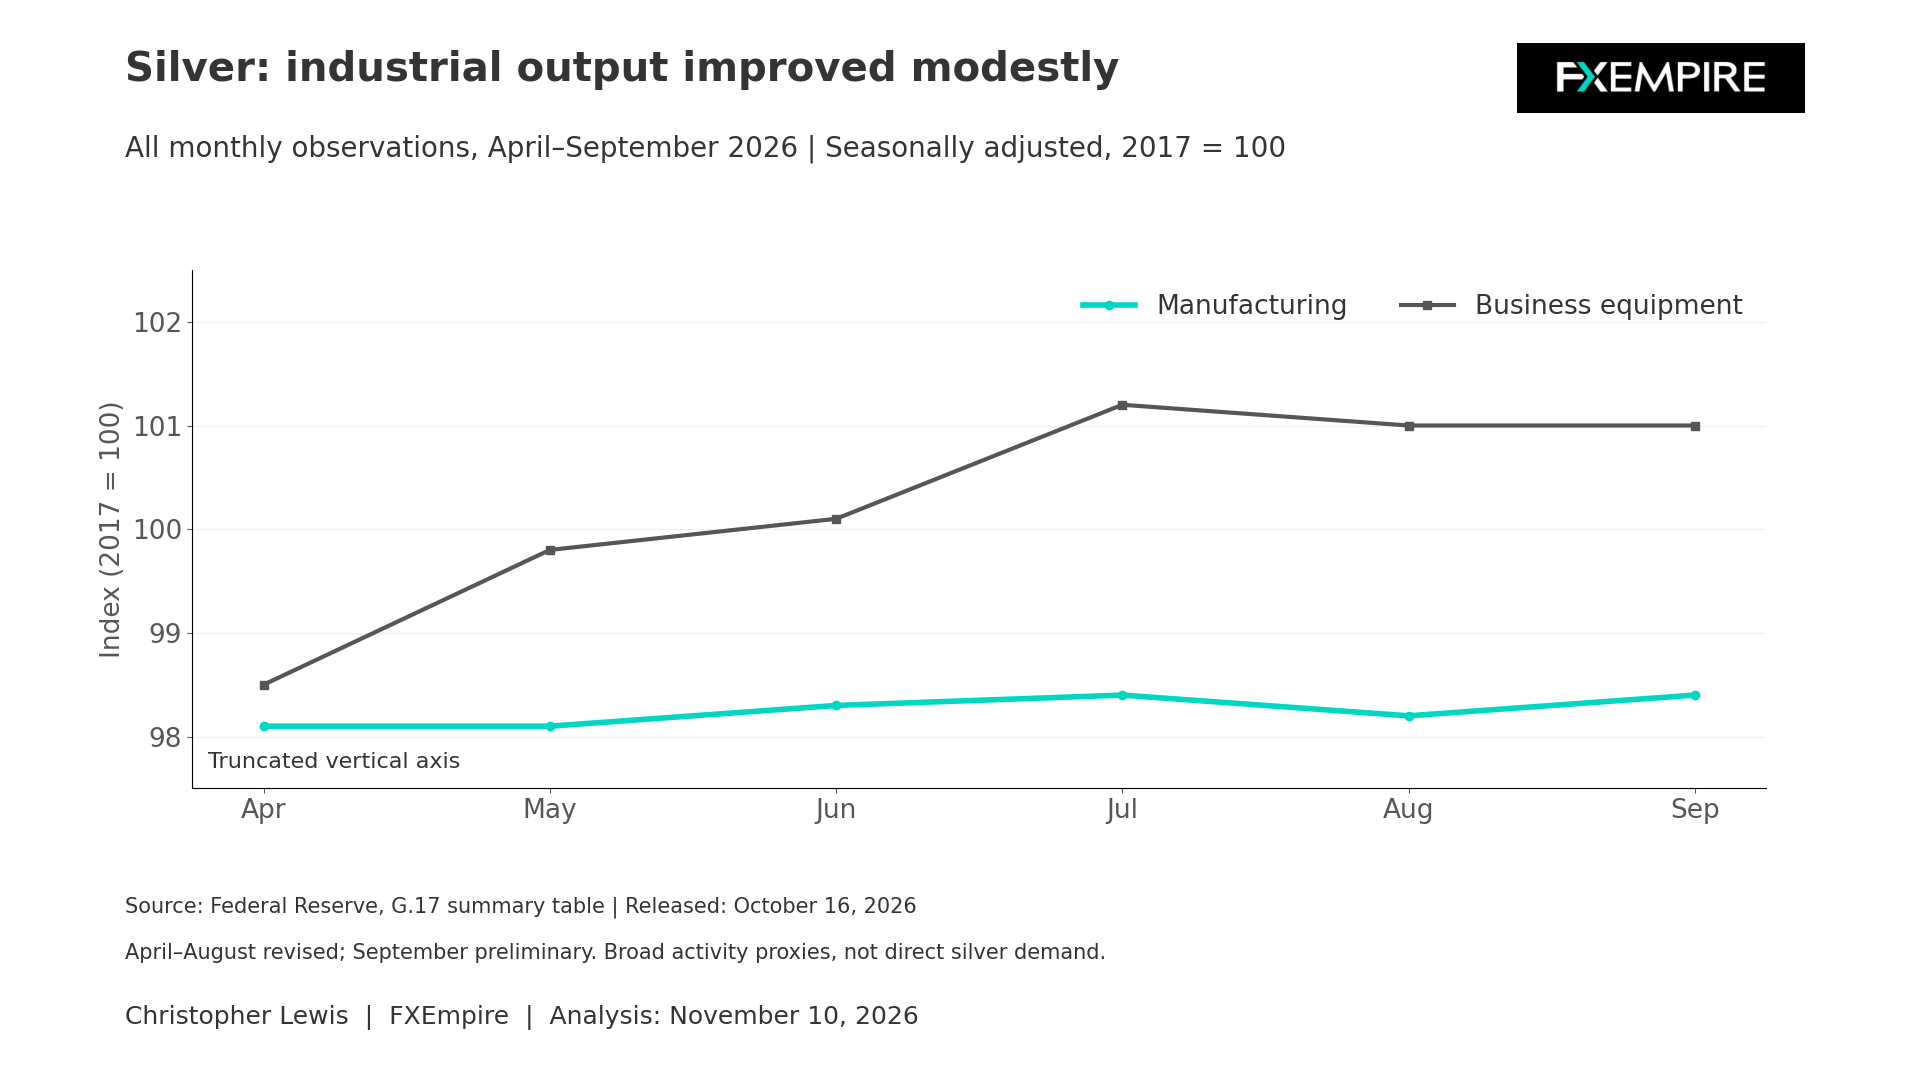
The composition of the September report is more informative than the headline alone. Gains of at least 1% in primary metals, machinery, and electrical equipment suggest improvement in several silver-relevant manufacturing chains, while the 3% fall in motor vehicles shows that strength was relatively uneven. The flat business equipment index between August and September also argues against calling the month a bit of an acceleration. A durable bullish industrial signal would require subsequent data to confirm rising production across electrical equipment and other silver-intensive industries, ideally alongside inventory numbers or exchange evidence that shows consumption.
Silver Price Forecast
Every new Silver analysis as it publishes, today's technical signal and key levels, live price — on one page.
See all Silver forecastsJobs and CPI
On November 6, the Bureau of Labor Statistics reported that October payrolls increased by 165,000 and the unemployment rate was 4.1%. The October Consumer Price Index was released this morning and showed core CPI month-over-month coming in at 0.3% for October, while CPI month-over-month came in at 0.4% for the month of October as well. Both were 0.1% above expectations, showing that inflation simply is not going anywhere.
The Chart
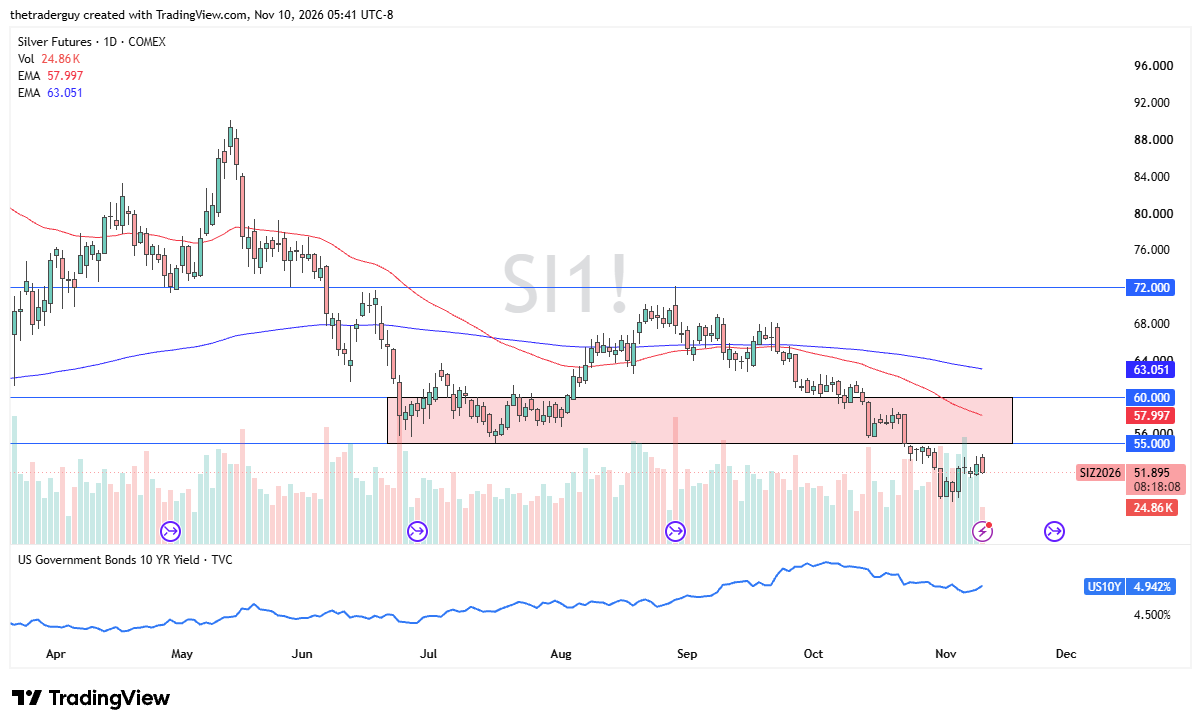
With this in mind, it does suggest that there will remain a bit of pressure on silver, as Federal Reserve policy has to be thought of through the lens of remaining firm, if not starting to strengthen. From a technical analysis standpoint, the $55 level looks to be a bit of a barrier, and after a gap higher to kick off the session only to sell off, it shows that there are still plenty of bearish traders out there. Whether or not the market breaks back down again remains to be seen, but it certainly looks like it is difficult to pick up any momentum. I still remain more in the camp of fading rallies.