


Spot Silver is a little higher early Tuesday but it is likely to continue to face heavy downside pressure because of hawkish Fed and other macro headwinds. A year ago, traders were pricing in as many as three rate cuts in 2026, but throughout the year, expectations have been shifting away from rate cuts with the market repricing the possibility of a more restrictive monetary policy path. Currently, traders are pricing in a 100% chance of a rate hike at the Fed’s December meeting. Furthermore, the market is still undecided about how many more will be needed before the Fed gains control of rising inflation.
These factors have driven a stronger U.S. Dollar and higher Treasury yields. This has created a hostile environment for non-yielding, dollar-denominated silver.
Firm Greenback Weighs on Demand for Dollar-Denominated Silver
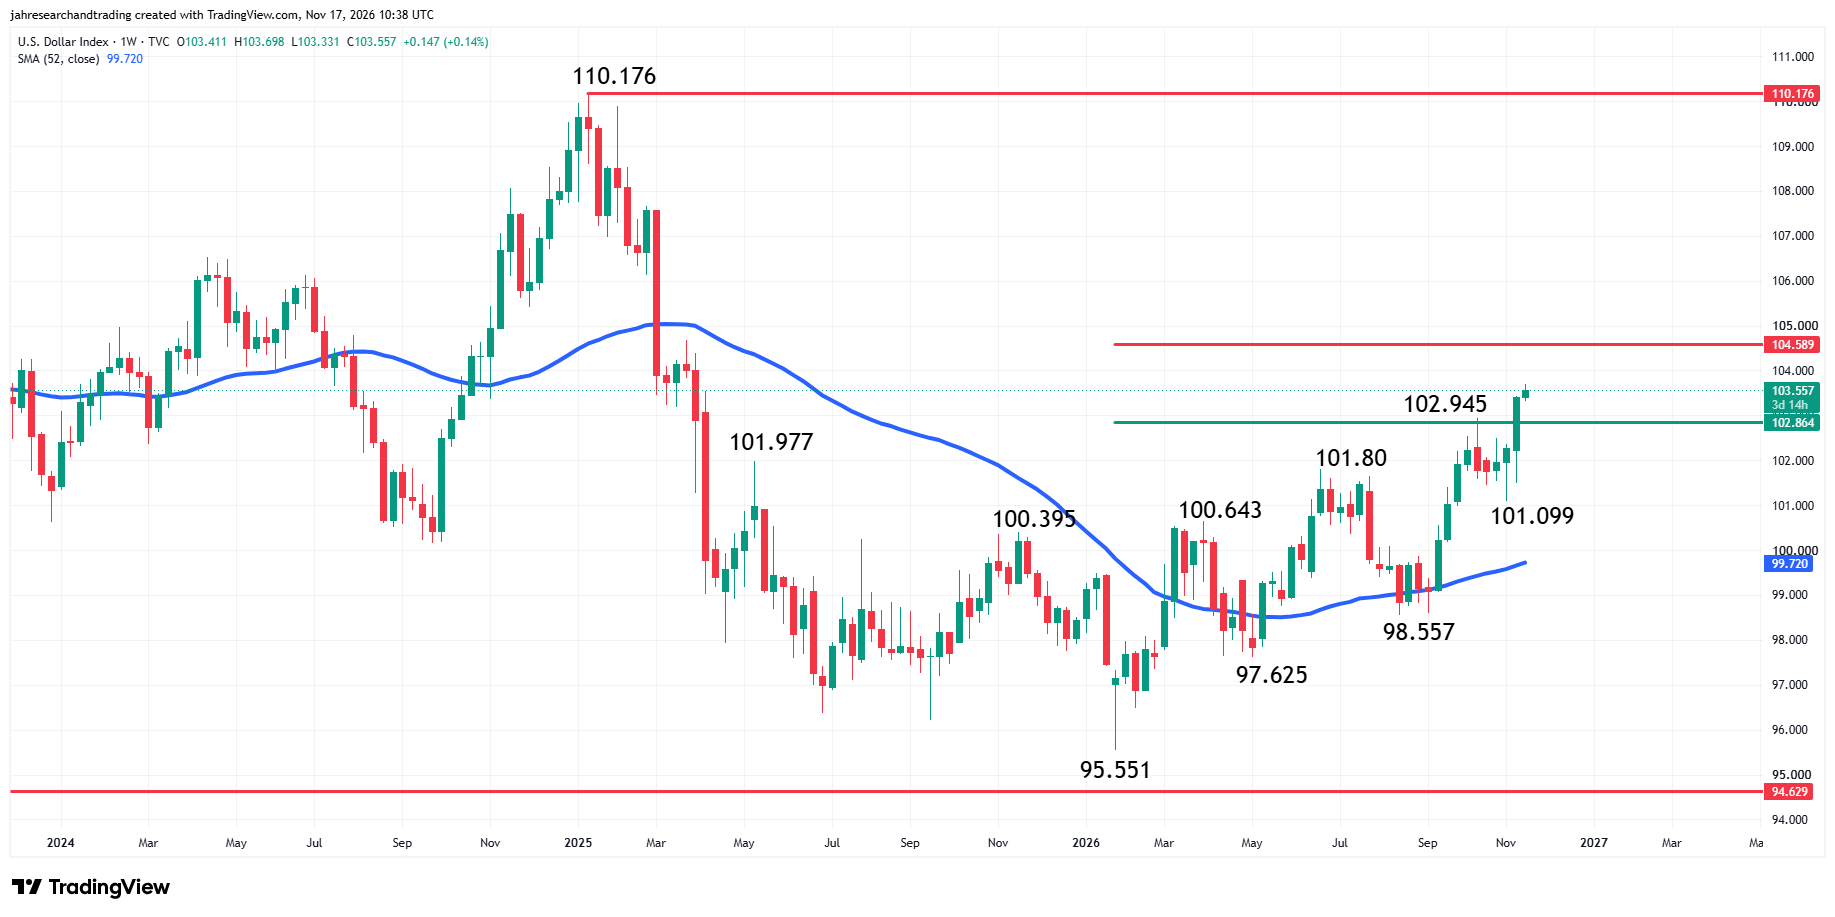
Technically, the main trend is up according to the weekly swing chart. Last week’s trade through 102.945 reaffirmed the uptrend. A trade through 101.099 will change the main trend to down.
The long-term range is formed by the January 2025 main top at 110.176 and the January 2026 main bottom at 95.551. Its retracement zone at 102.864 to 104.589 is currently being tested. Trader reaction to this zone could determine whether the current rally stalls, leading to a possible retreat, or extends through 104.589 with traders setting their sights on a test of 110.176.
This will be a significant development that could have a major influence on silver prices. The U.S. Dollar Index’s January 2026 low at 95.551 coincided with Spot Silver’s January 2026 all-time high. The DXY’s base-building throughout the Spring and Summer, and its current price surge also mirrored the decline in silver prices. So it’s safe to conclude in my opinion that we’re not likely to see a bottom in spot silver until the U.S. Dollar tops and that’s not likely to be determined until the market can figure out how many interest rate hikes are in the cards for the Federal Reserve.
Rising Treasury Yields Also Creating Downward Pressure
In addition to the U.S. Dollar, we’re also eyeing the movement in the 10-year U.S. Treasury Note yield and the 2-year U.S. Treasury Note yield.
Silver Price Forecast
Every new Silver analysis as it publishes, today's technical signal and key levels, live price — on one page.
See all Silver forecasts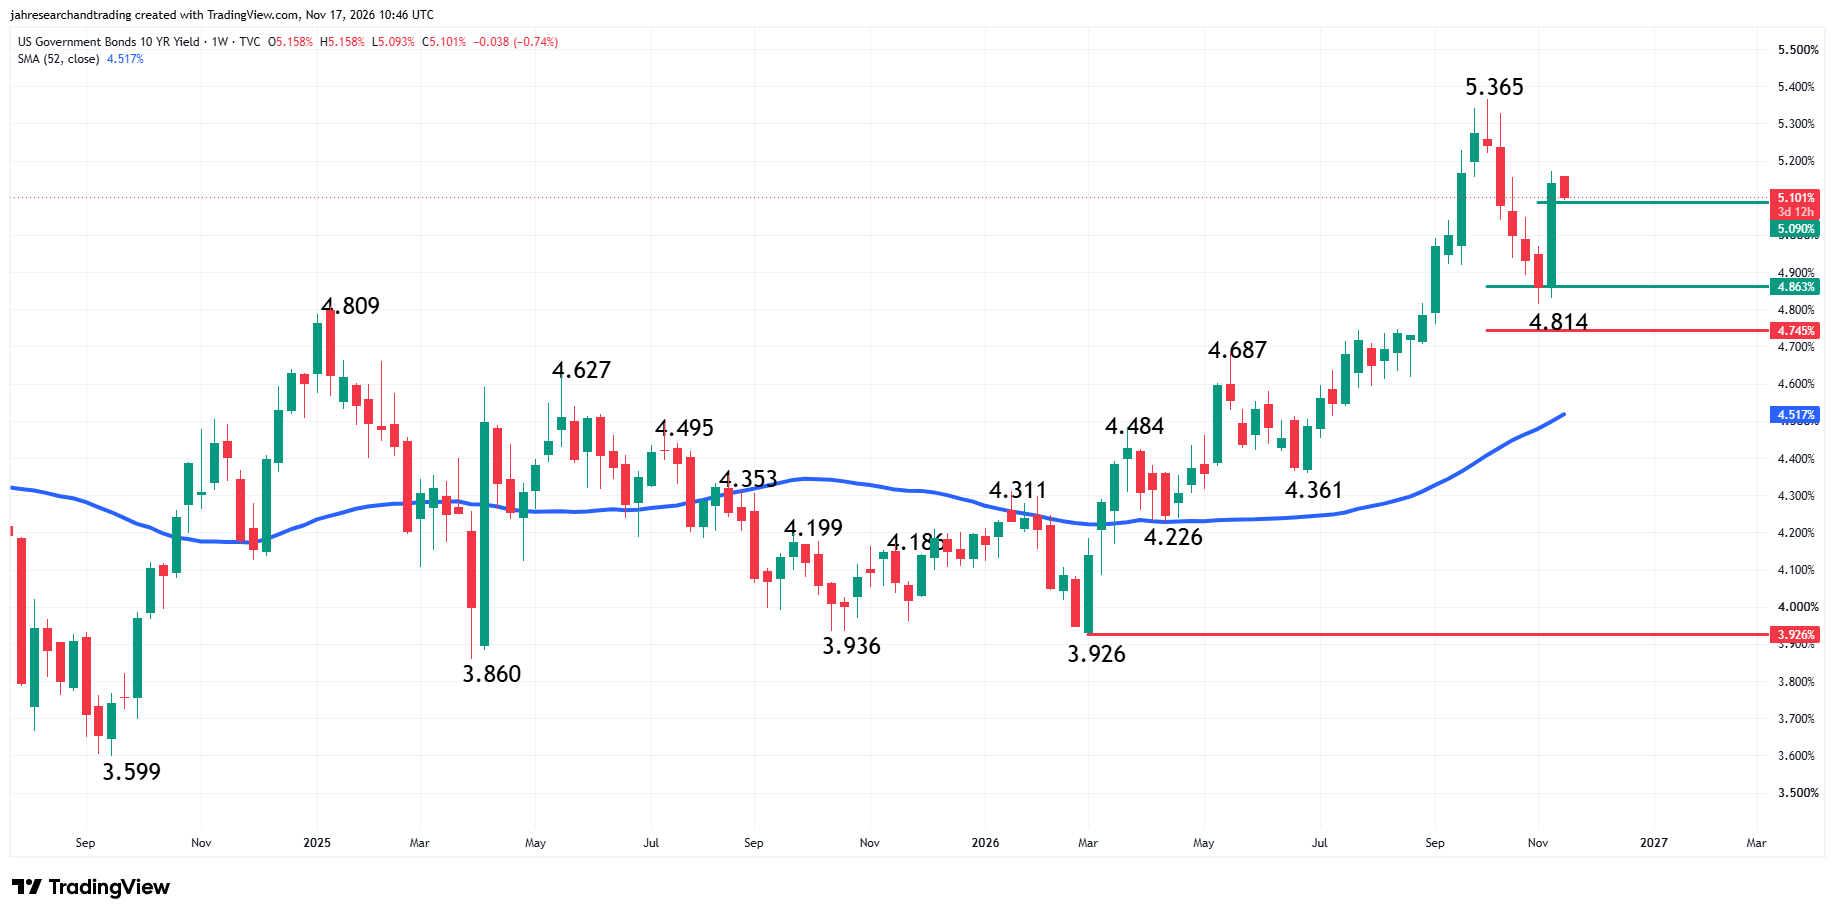
Two weeks ago, the 10-year U.S. Treasury note yield bottomed at 4.814%. The subsequent rally has stalled near 50% of the break from 5.365% to 4.814%. This level is 5.090%. A sustained move over this level could launch a rally into the multi-year high at 5.365%. This could drive up demand for the dollar, likely putting more pressure on silver prices.
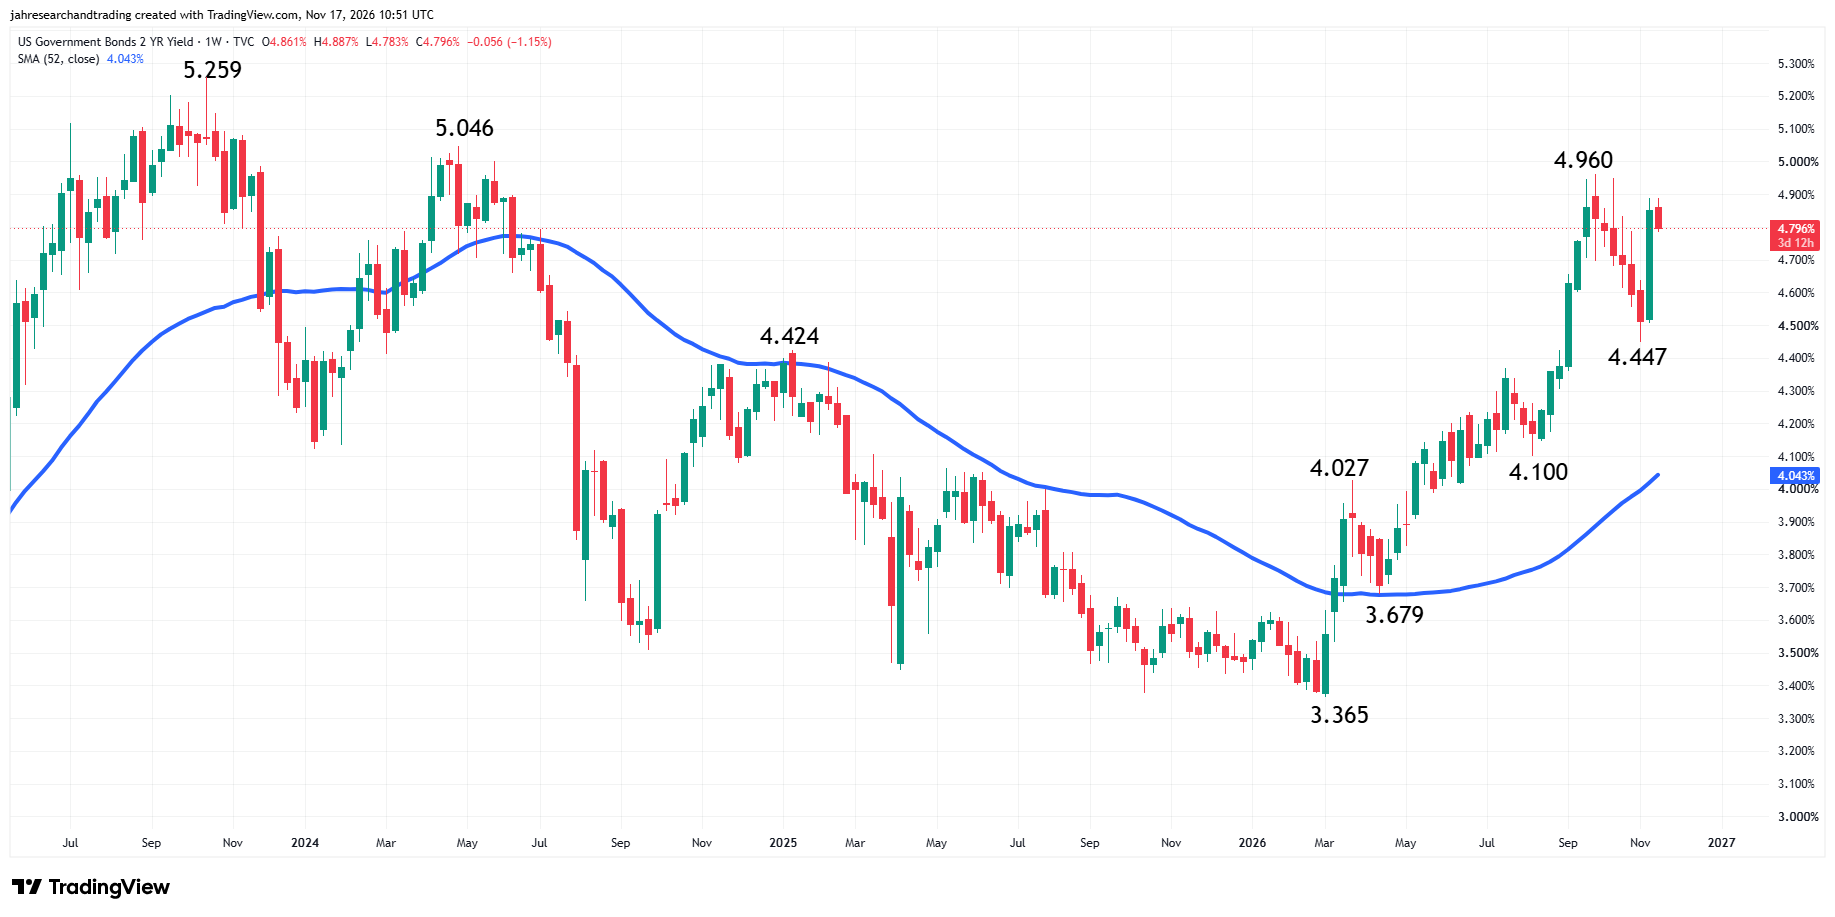
The 2-year U.S. Treasury note yield hit 4.888% the previous session before today’s small setback. If it continues to climb then it will threaten the September top at 4.960% with momentum behind it. This could extend the rally into multi-year tops at 5.046% and 5.259%. The continued upside movement in the 2-year yield is another reason to fear lower prices in silver. Unless the yield falls below 4.447% or better yet, the 52-week moving average at 4.043%, it’s hard to find another catalyst that could stop silver’s price slide or fuel a meaningful rally.
Weekly Spot Silver (XAGUSD) Technical Analysis
Spot Silver (XAGUSD) is lower at the start of the week, putting it in a position to test the 61.8% retracement level from the all-time high at $46.48 and the last main bottom before the run-up to $121.67 at $45.55.
The main trend is down according to the weekly swing chart. A trade through $71.18 will change the main trend to up. Taking out the main bottom at $45.55 will reaffirm the downtrend.
The all-time high is $121.67. 50% of this price is $60.835. This is a major resistance level. The 61.8% retracement level from the all-time high is $46.48. This would be the first test of this level. Until we see how the market behaves here, we can’t call it support so we’ll call it a target.
XAGUSD is also well-below the 52-week moving average at $68.98, which is a major trend indicator as well as resistance level.
What to Watch
Weekly Spot Silver (XAGUSD)
My bias is to the downside due to the bearish swing chart, the prolonged trade below the long-term 50% level at $60.835 and the 52-week moving average at $68.98. However, I do recognize the possibility of a technical bounce following a test of the potential support cluster formed by the 61.8% retracement level at $46.48 and the long-term main bottom at $45.55.
My outlook will strengthen if $45.55 is taken out with conviction. If this becomes the case then the door will be opened for a potential acceleration to the downside with the next major bottom at $28.31 my target.
More Information in our Economic Calendar.