


Silver has been punished again for the week, with the decline spreading well beyond what could be explained by a single economic release. Reuters reported early today that silver, along with platinum and palladium, was heading for a second consecutive weekly decline. The market’s problem is that it must absorb both the same monetary-policy pressure affecting gold and a more complicated outlook for industrial consumption.
Silver Crashed Through Several Levels of Support
From a weekly technical perspective, the decline has removed several familiar price levels. CME Group reported on November 13 that silver futures had traded from an intraday high near $50.72 to a low of $48.83, putting the contract on course for its eighth down week in 12. On November 16, CME described futures falling more than 4.5% to approximately $46.91. Its November 18 commentary said December silver futures had fallen below $45. It appears that Friday is going to simply continue this pattern.
The weekly chart’s most important area is not necessarily a speculative upside target. It is whether silver can reclaim and hold above the broken $45 region and then challenge the higher $48 to $50 area. A bounce that fails beneath those former trading zones would be consistent with a market that is still being dominated by sellers, and rallies could be opportunities for long traders to reduce exposure.
Futures Holdings
The latest available CFTC futures-only report offers a view of the position adjustment before this week’s accelerated selling. For the standard 5,000-ounce COMEX silver contract, non-commercial traders had 36,151 longs and 16,787 shorts as of Tuesday, November 10, a net long of 19,364 contracts. That was down from 22,631 net-long contracts on October 13.
Although the five-week path was not necessarily a straight line, the chart just below plots the observed Tuesday snapshot from October 13 through November 10. Positioning explains why an ostensibly supportive annual shortage can lose influence in fast liquidation. When investors close leveraged silver longs, the pressure can be immediate. Industrial usage does not adjust at the same speed. A factory’s anticipated consumption over 12 months is not a standing bid at a particular futures price on Friday morning.
Silver Price Forecast
Every new Silver analysis as it publishes, today's technical signal and key levels, live price — on one page.
See all Silver forecasts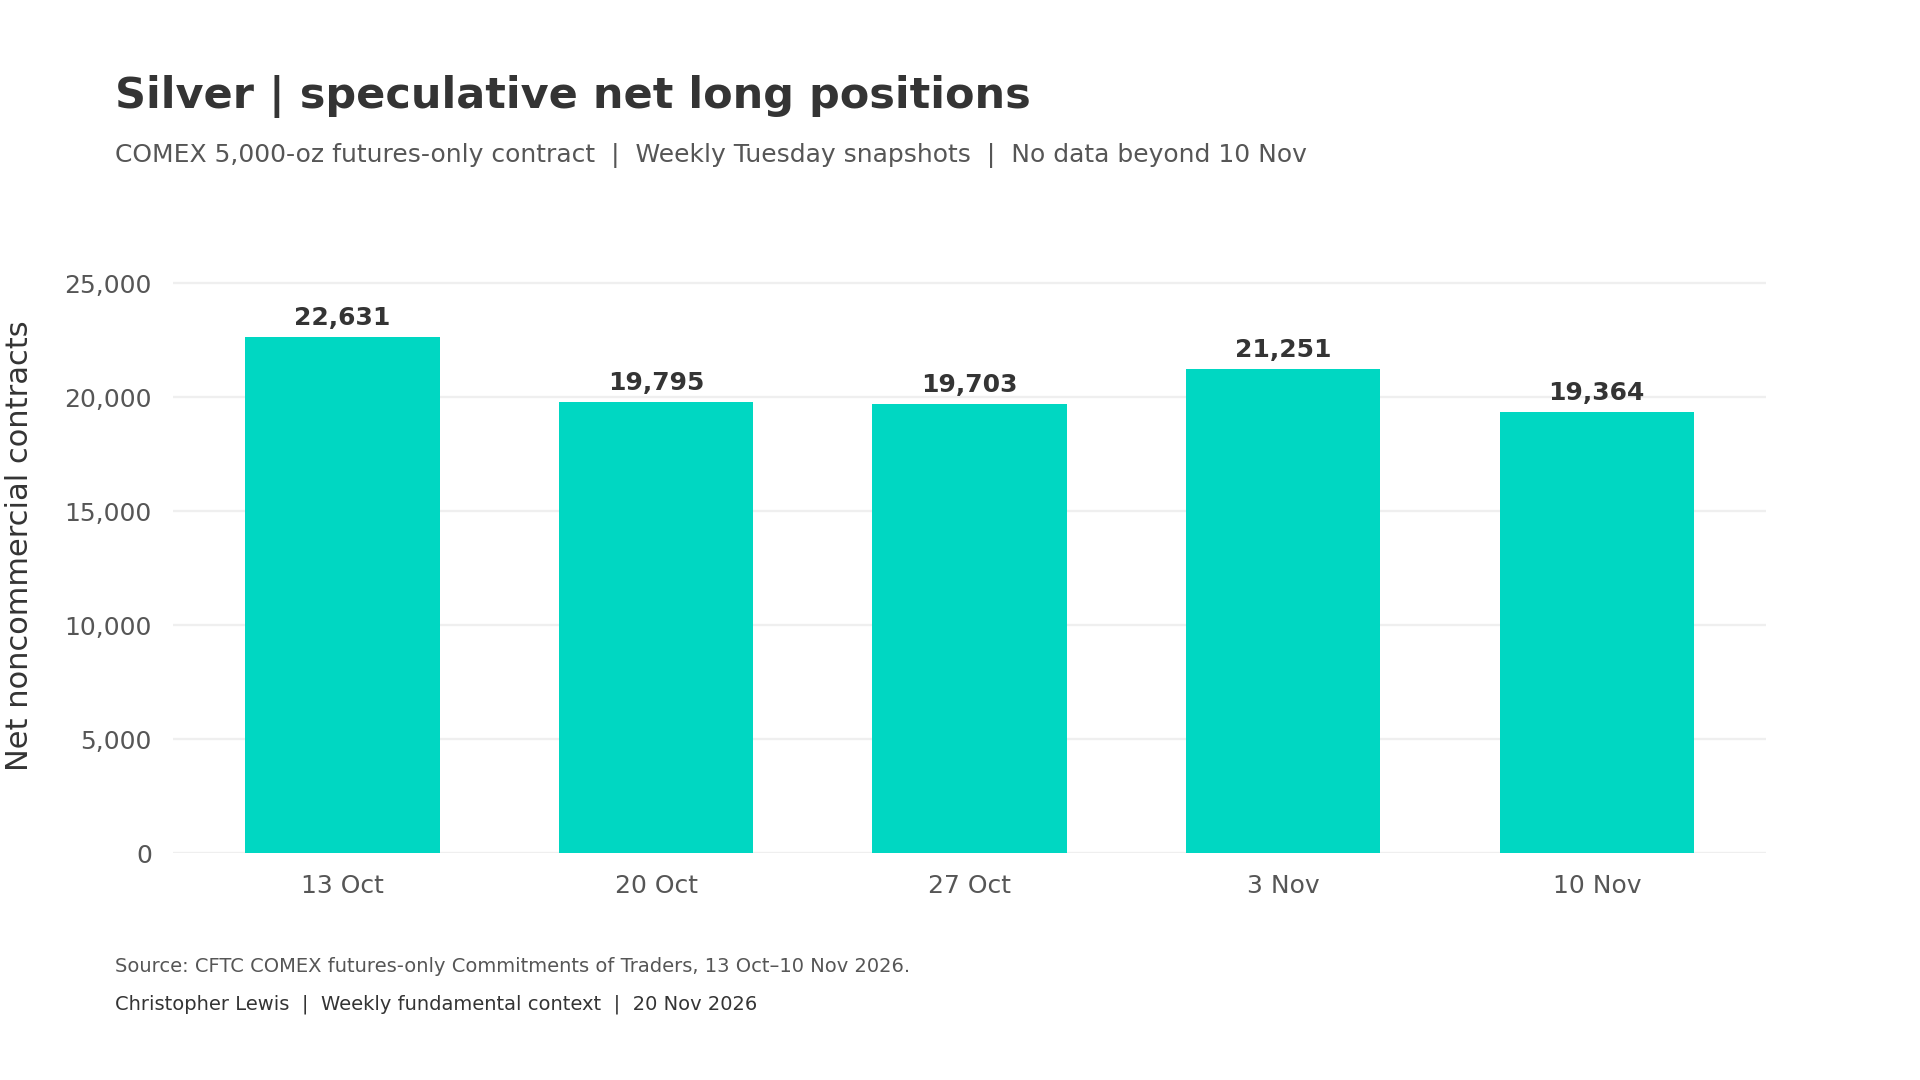
The current report’s positioning sample predates this week’s fall, so the scale of liquidation is not quite verified yet. The annual fundamentals are also less straightforward than the word “deficit” would suggest. In its November 12 outlook, the Silver Institute and Metals Focus projected a 35 million-ounce global deficit for this year, but also a 5% decline in total demand to 1.08 billion ounces. Industrial consumption is forecast to fall 3% to 640 million ounces.
Non-solar industrial applications are expected to grow 4.5% to 492 million ounces, meaning photovoltaic-sector thrifting and substitution are doing much of the work on the downside.
Industrial Data
Fresh U.S. industrial data adds useful context without implying a direct silver-demand estimate. The Federal Reserve’s November 17 release reported total industrial production down 0.4% in October, while manufacturing output rose 0.3%. Manufacturing excluding motor vehicles and parts slipped 0.1%. This mixed report is not evidence that silver consumption changed by a particular number of ounces, but it cautions against treating general manufacturing strength as a uniformly positive signal for industrial metals. The Fed has scheduled an annual G.17 data revision for November 24.
The monetary side of the equation remains consequential. The October FOMC Minutes, published November 18, indicated that nearly all participants anticipated further rate increases under their baseline assumptions. This supports the dollar and yields mechanism for affecting precious-metals investment. It does not necessarily mean that silver has to fall on every increase in yields, but it certainly causes a bit of a headwind.
The breakdown this week leaves the chart more vulnerable until buyers demonstrate sustained acceptance of a previously broken level. A rise that merely retraces part of the collapse is not the same thing as a change in the weekly trend, obviously. The next major macro event is the BEA’s October PCE report, scheduled for November 25 at 8:30 a.m. EST.
Technical Analysis
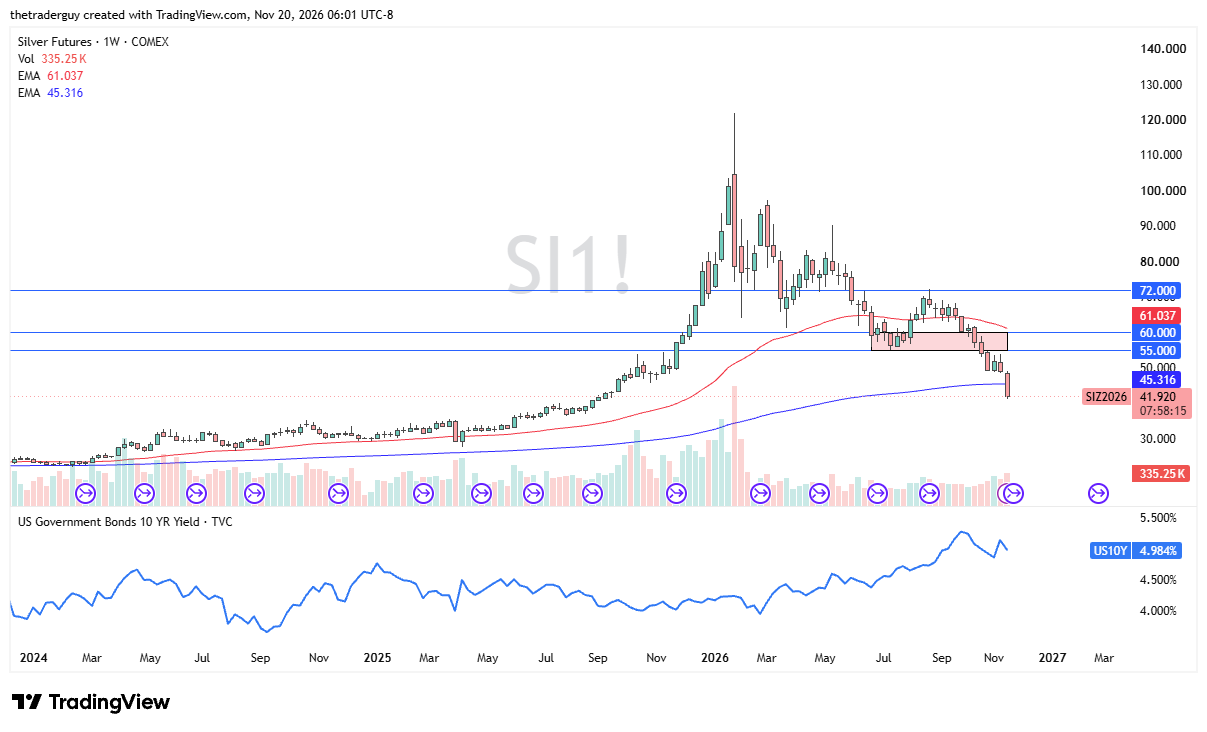
The chart itself looks absolutely horrific. The candlestick slicing through the 200-week EMA shows just how negative things have gotten, and it now looks as if the $40 level underneath could be the next major support target. Rallies at this point in time I look at with suspicion and may drill down to lower timeframes to find entries, but until bond yields in America cool off, there is no real shot, at least from what I see, of silver having a sustained rally.