


Critical Support Gives Way
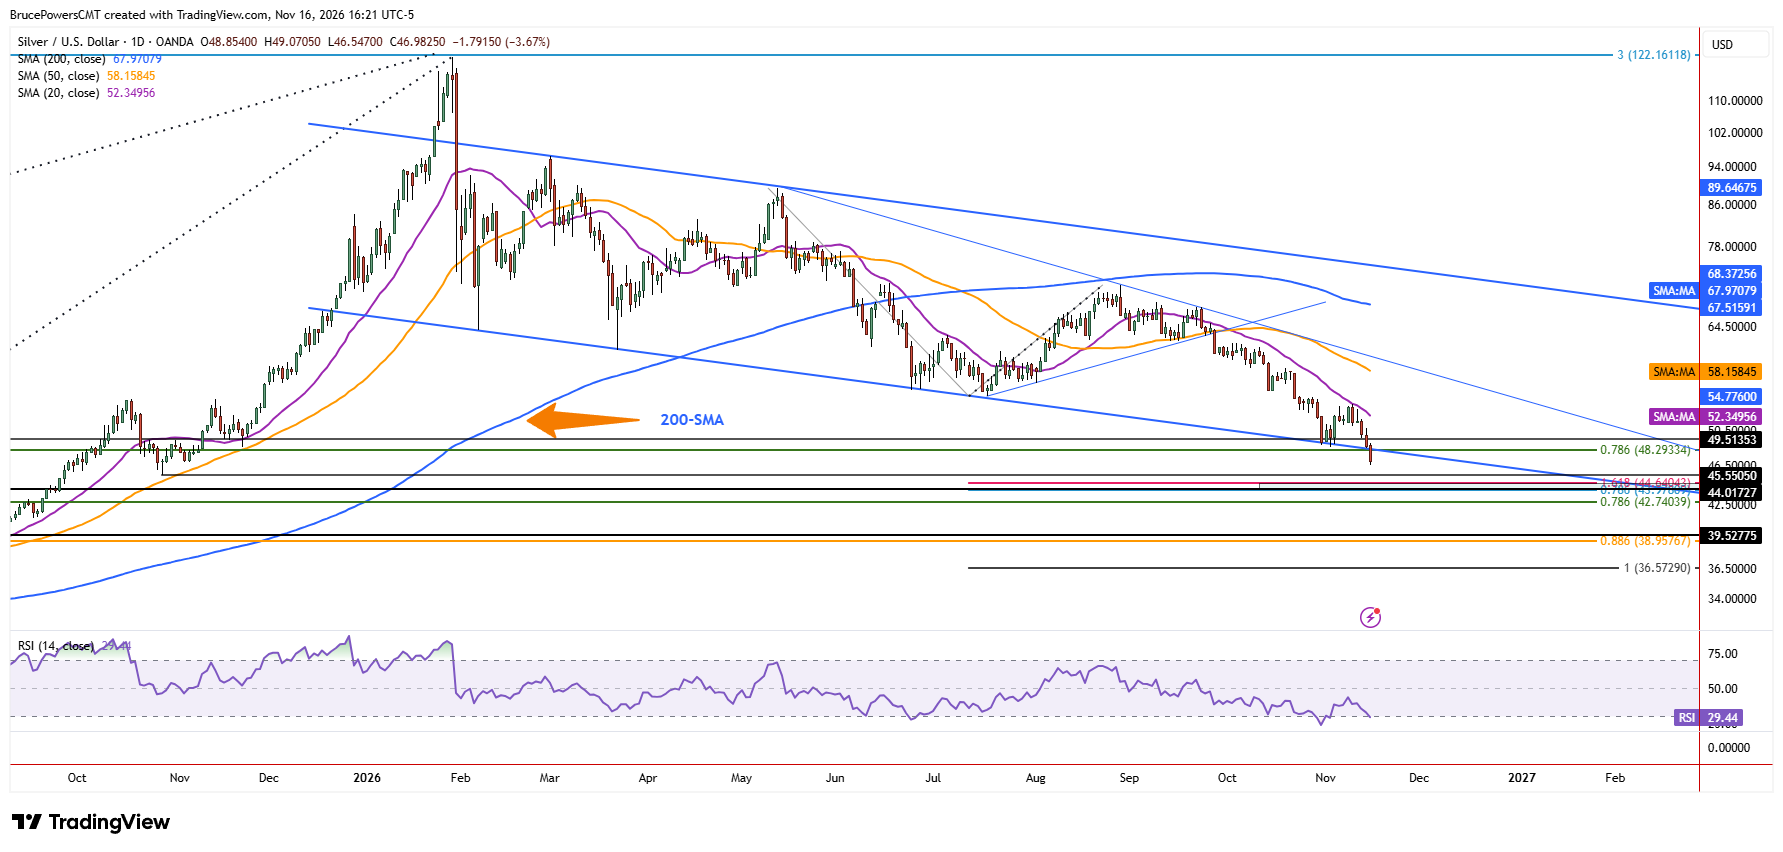
Silver continued to weaken on Monday, falling to a new low of $46.55 after bearish technical signals triggered earlier in the session. Support broke near the confluence of the prior daily swing low of $48.62 and the lower boundary of a declining channel. That lower boundary had held as support during the establishment of the $48.62 low. In addition, the 78.6% Fibonacci retracement of the prior advance at $42.74 reinforced the significance of the support zone and the implications of a sustained break below it.
Momentum Shifts as Sellers Gain Control
Notably, Monday’s decisive decline occurred as the lower channel boundary was crossing the 78.6% Fibonacci level. This suggests that a change in character may have occurred, raising the possibility of a continuation of the accelerating bearish momentum that has developed following the latest swing high for the larger declining structure at $71.18. That high in late August met resistance near the 200-day moving average, after silver broke below it in early June. The 20-day moving average, currently near $52.35 and falling, defines dynamic resistance. It was tested during the establishment of a minor swing high at $53.73 last week.
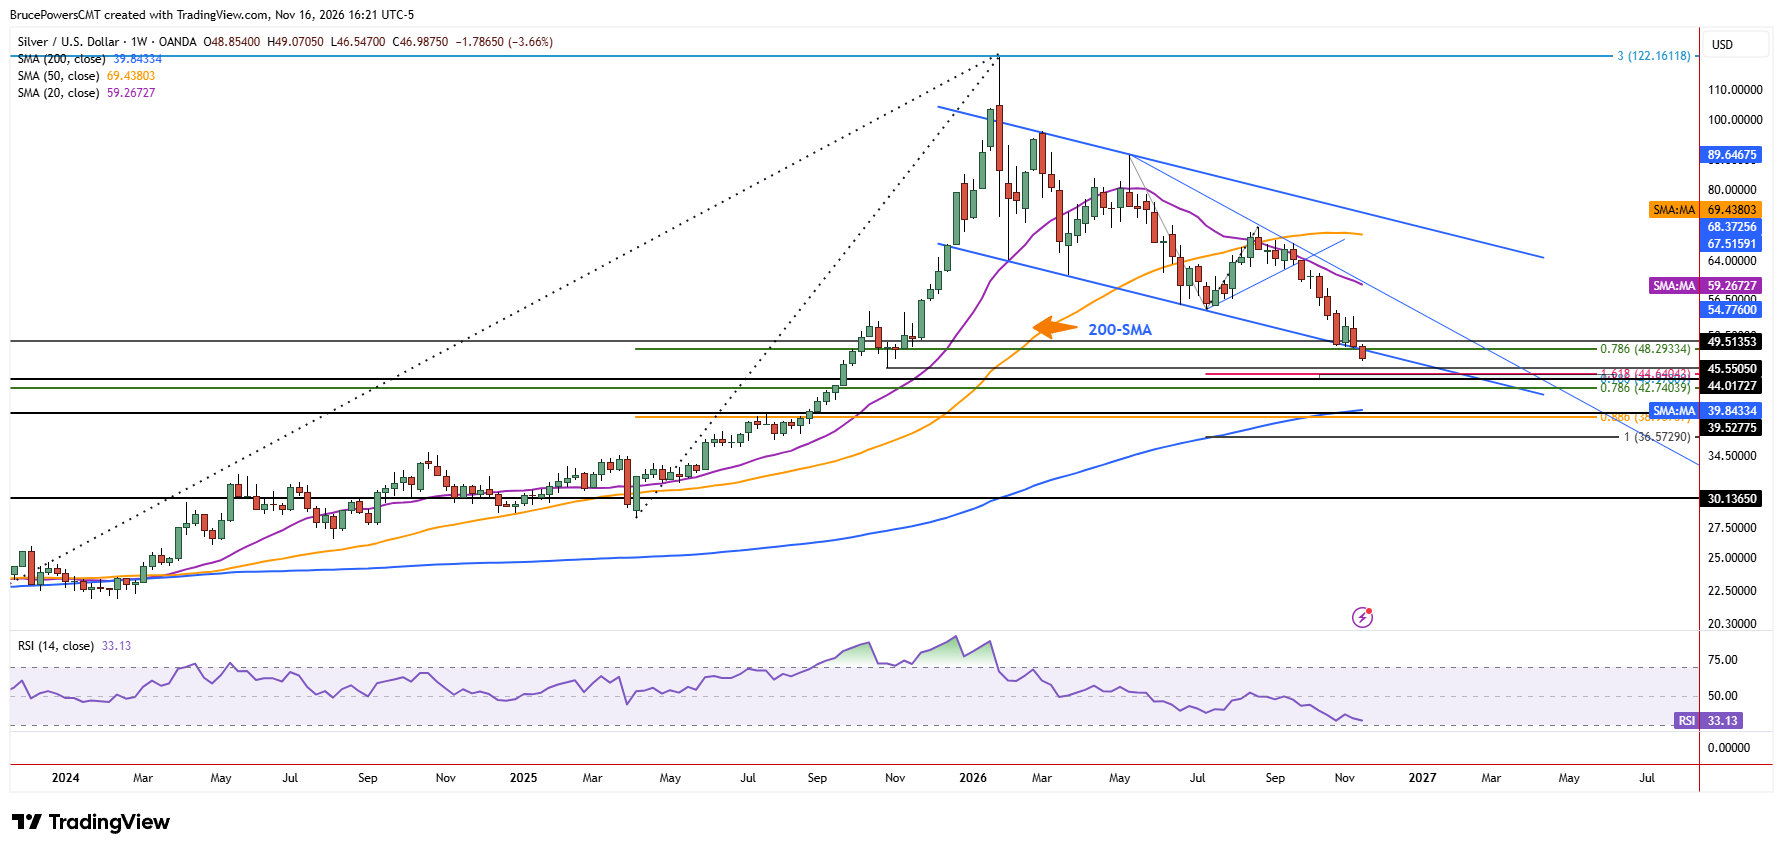
Sellers remain in control at the time of writing, suggesting that upward pullbacks toward key resistance levels should provide useful clues to changes in supply and demand. Since the lower boundary of the channel has now failed as support, the likelihood of a test of the October 2025 low at $45.55 increases. That low marked the bottom of a consolidation range. If it is broken to the downside, a new bearish trend reversal signal will trigger. However, depending on how silver approaches that level and responds, a test could lead to an undercut followed by a reversal and signs of strength. Therefore, $45.55 should still be treated as a potential support area rather than an inevitable breakdown point.
Downside Targets Come Into Focus
Nonetheless, a decisive decline below $45.55 would increase the downside potential for silver in the relatively near term. Below that level is a small confluence zone between two Fibonacci levels, extending from $44.65 to $43.98, which may provide interim support. A bearish reversal signal below $45.55 would be confirmed by a close beneath that level, reinforcing the potential for lower support levels to be tested. Further down, the 78.6% Fibonacci retracement of a prior advance at $42.30 follows the $44.65-$43.98 support zone. That level is followed by a prior peak of $39.53.
If you’d like to know more about how to trade gold and silver, please visit our educational area.