The S&P 500 initially fell during the session on Friday but turned around to rally. However, we are starting to see the market roll over a little bit
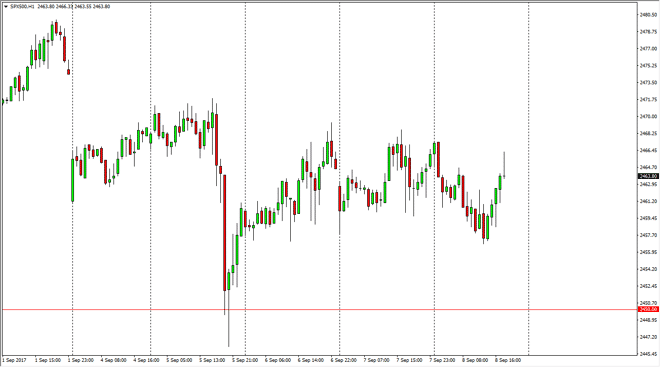
The S&P 500 initially fell during the session on Friday but turned around to rally. However, we are starting to see the market roll over a little bit near the 2465 handle, and I think that the market is stuck in a bit of consolidated action. I think that the 2450 level underneath is supportive, so I don’t know that we break down below there. Quite frankly, this is a market that just goes back and forth and essentially makes no headway in one direction or the other. Ultimately, this is a market that is probably the realm of short-term traders.
Chris is a proprietary trader with more than 20 years of experience across various markets, including currencies, indices and commodities. As a senior analyst at FXEmpire since the website’s early days, he offers readers advanced market perspectives to navigate today’s financial landscape with confidence.