



The dollar held steady near a 19-month high on Wednesday as US data and comments from Fed officials supported the case for further rate increases, Reuters reported. The dollar index, which tracks the greenback against six major currencies, traded near 103.67 after touching 103.78 overnight, its highest since April 2, 2025.
Dollar: Incremental, Not Aggressive
New York Fed President John Williams said on Tuesday that the Fed will likely need to raise rates again, though he pushed back against a more aggressive path, Reuters reported. “All Fed speakers are saying that the Fed should raise rates in an incremental way,” said Tapas Strickland, chief market strategist at Moomoo ANZ. US retail sales rose 0.2% in October, matching expectations, while the control group, which strips out autos, gasoline, building materials and food services, rose 0.6%.
Williams, Fed Governor Michael Barr and Minneapolis Fed President Neel Kashkari are due to speak at separate events. Minutes of the Fed’s October 27 to 28 meeting, where it held rates steady, are due at 1900 GMT on Wednesday, three weeks after the decision under the Fed’s schedule, ahead of the December 8 to 9 meeting.
Euro: Below a Key Threshold
The euro traded near $1.0982 on Wednesday, below the $1.10 mark, Reuters said. Euro zone inflation was 4% in October according to Eurostat’s flash estimate, and the ECB is expected to raise rates in December.
That has not been enough to support the euro. In my view, the US rate path is moving faster than Europe’s, and EUR/USD is trading that gap.
EUR/USD Price Forecast
Every new EUR/USD analysis as it publishes, today's technical signal and key levels, live price — on one page.
See all EUR/USD forecastsPound: Inflation Rises to 3.6% After Mixed Jobs Data
UK unemployment unexpectedly fell to 4.6% in the three months to September, down 0.3 percentage points on the quarter, the Office for National Statistics said. The details were softer: regular pay growth eased to 3.5% from 3.7%, the number of payrolled employees fell by 34,000 in October and vacancies dropped by 22,000 to 690,000. The ONS’s Liz McKeown called it “a mixed picture overall.”
Sterling traded near $1.3191 on Wednesday, Reuters said. UK consumer price inflation rose to 3.6% in October from 3.5% in September, the ONS said on Wednesday. That matched the 3.6% forecast from Brown Brothers Harriman and was below the 3.7% expected by Pantheon Macroeconomics.
US Dollar Index Technical Analysis: DXY Tests 103.74 Inside Rising Channel
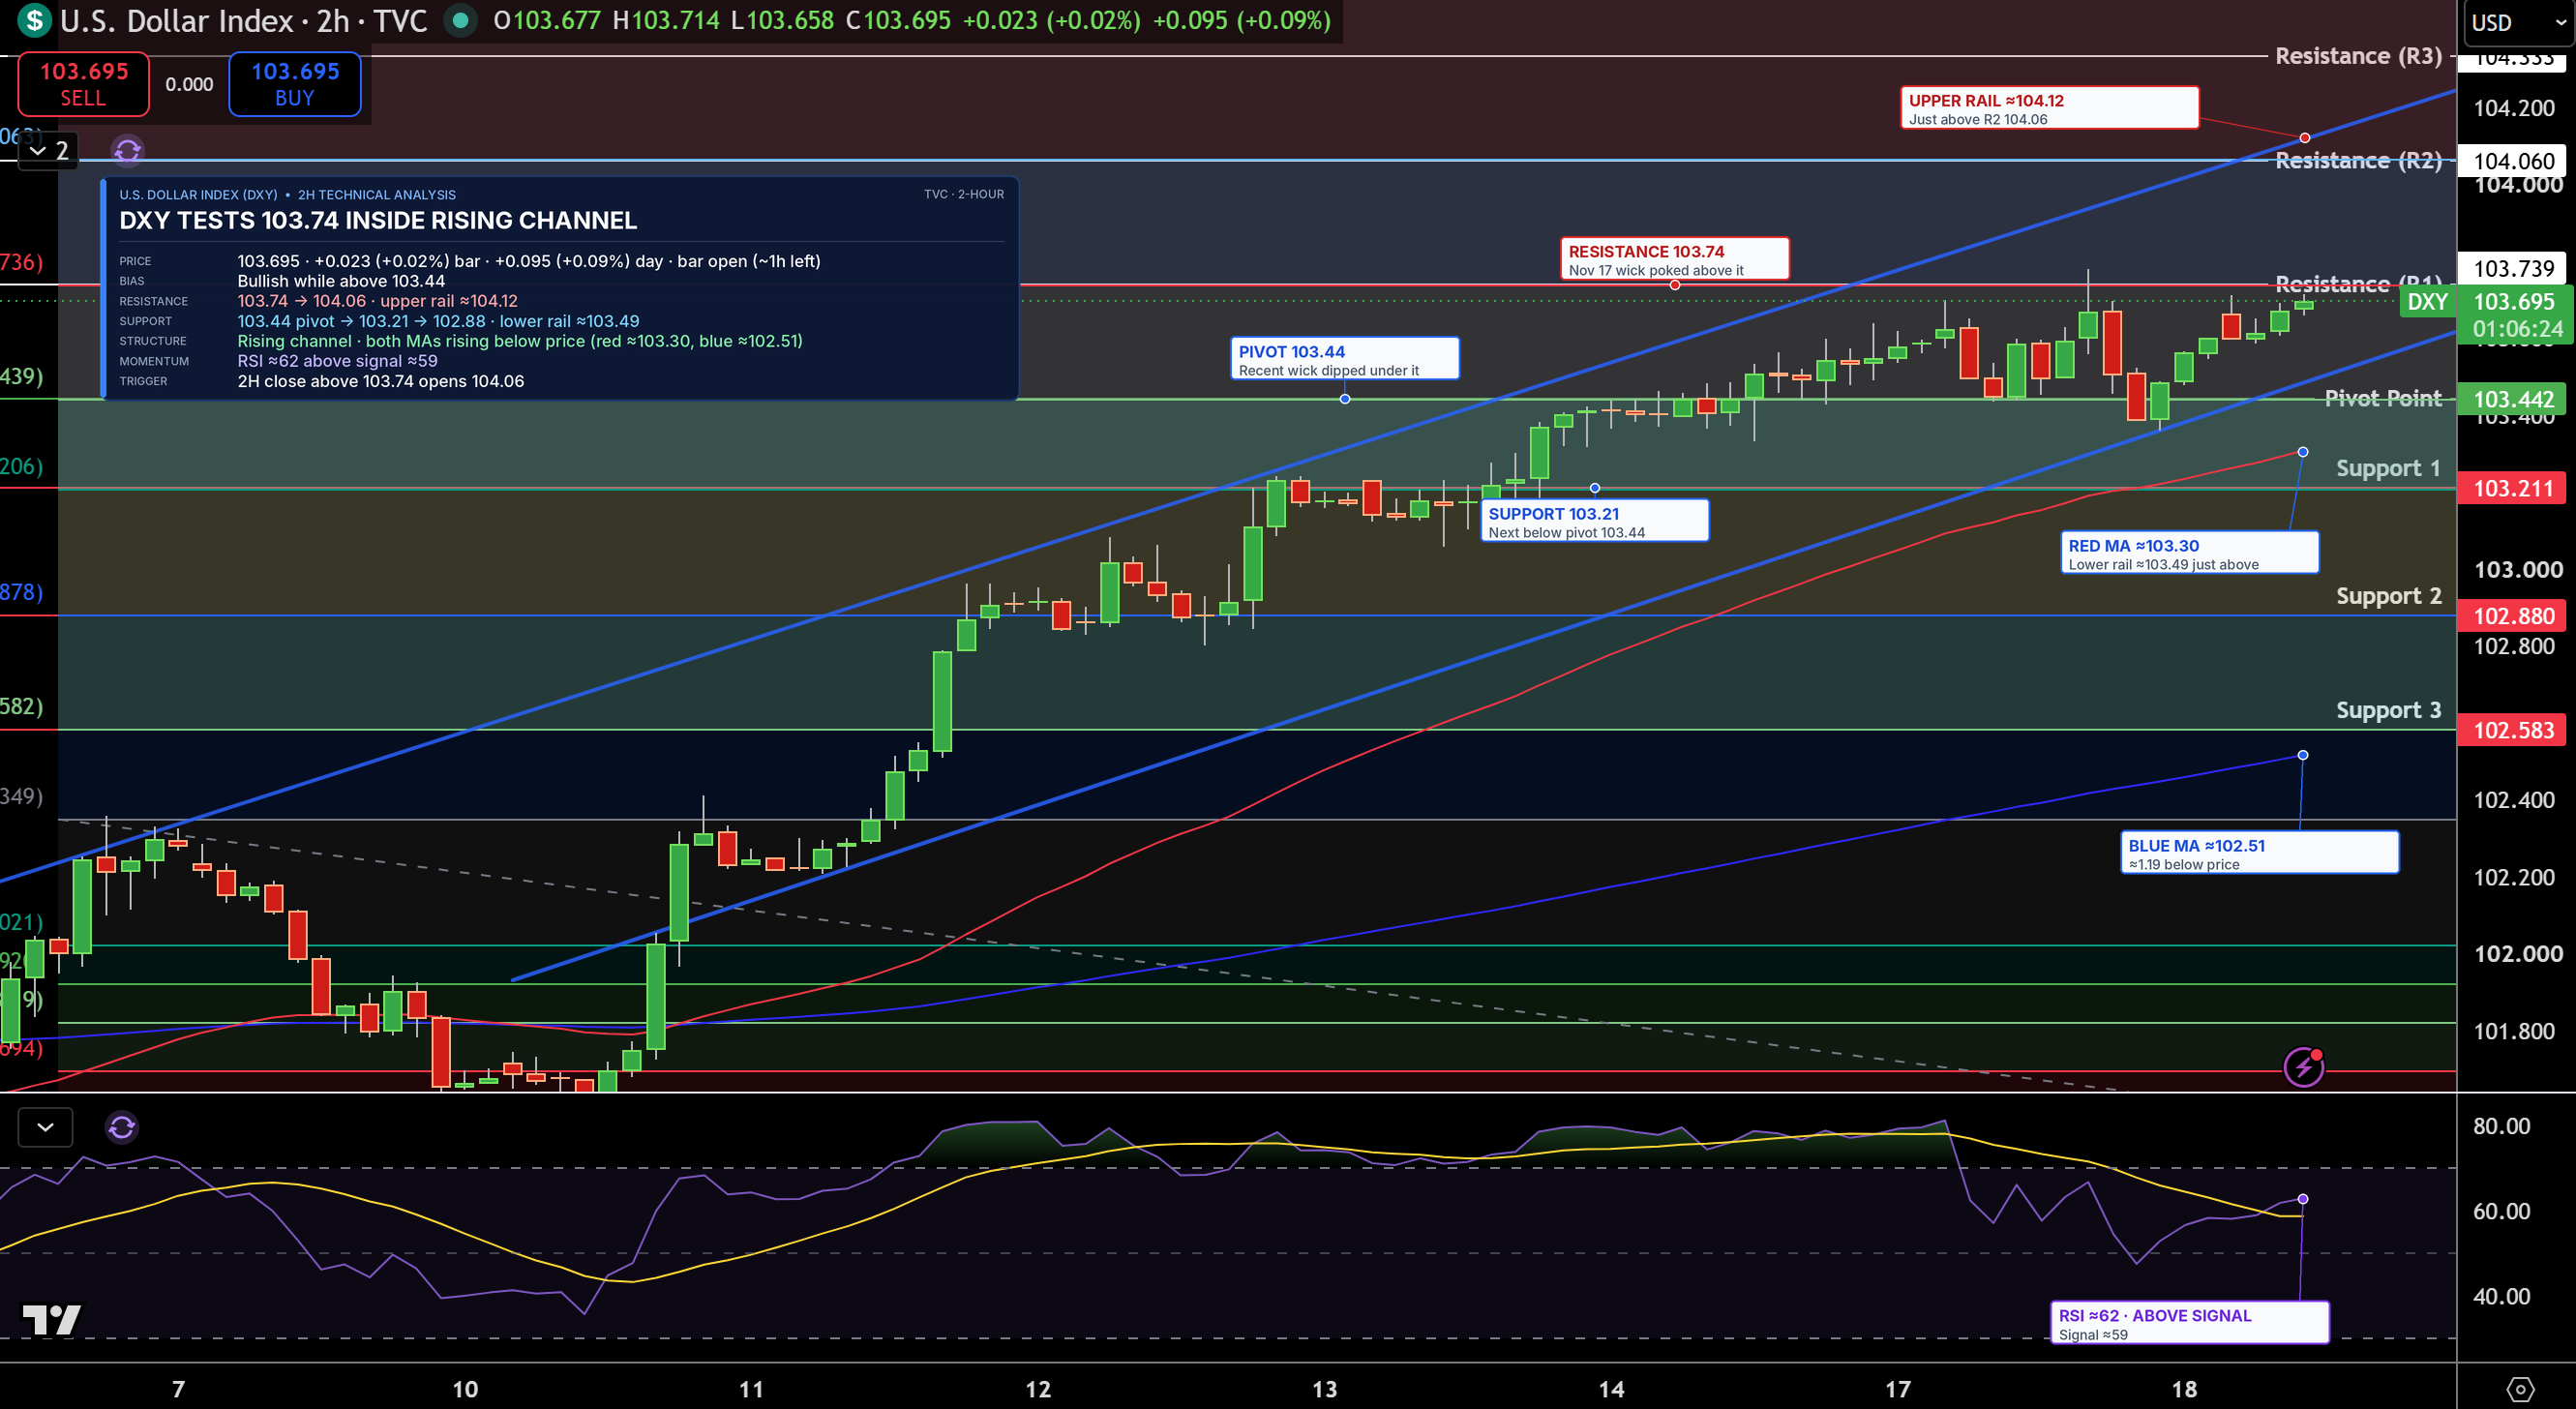
The US Dollar Index is trading near 103.70 on the 2-hour chart, climbing inside a rising channel, two parallel lines that have guided prices higher since November 10. Buyers defended 103.44, the pivot point, a level calculated from the previous period’s high, low and close that traders use to judge direction, and prices are pressing against 103.74 again. Both moving averages, which track average prices over time, are rising below price.
Resistance, where sellers may return, is 103.74, then 104.06. Support, where buyers may step in, is 103.44, then 103.21. RSI, a 0 to 100 gauge of buying and selling strength, is near 62 and above its signal line, a slower average of RSI. I stay bullish while DXY holds 103.44. A close above 103.74 would open 104.06.
EUR/USD Technical Analysis: Euro Slips Below 1.1000 as 1.0935 Comes Into Focus
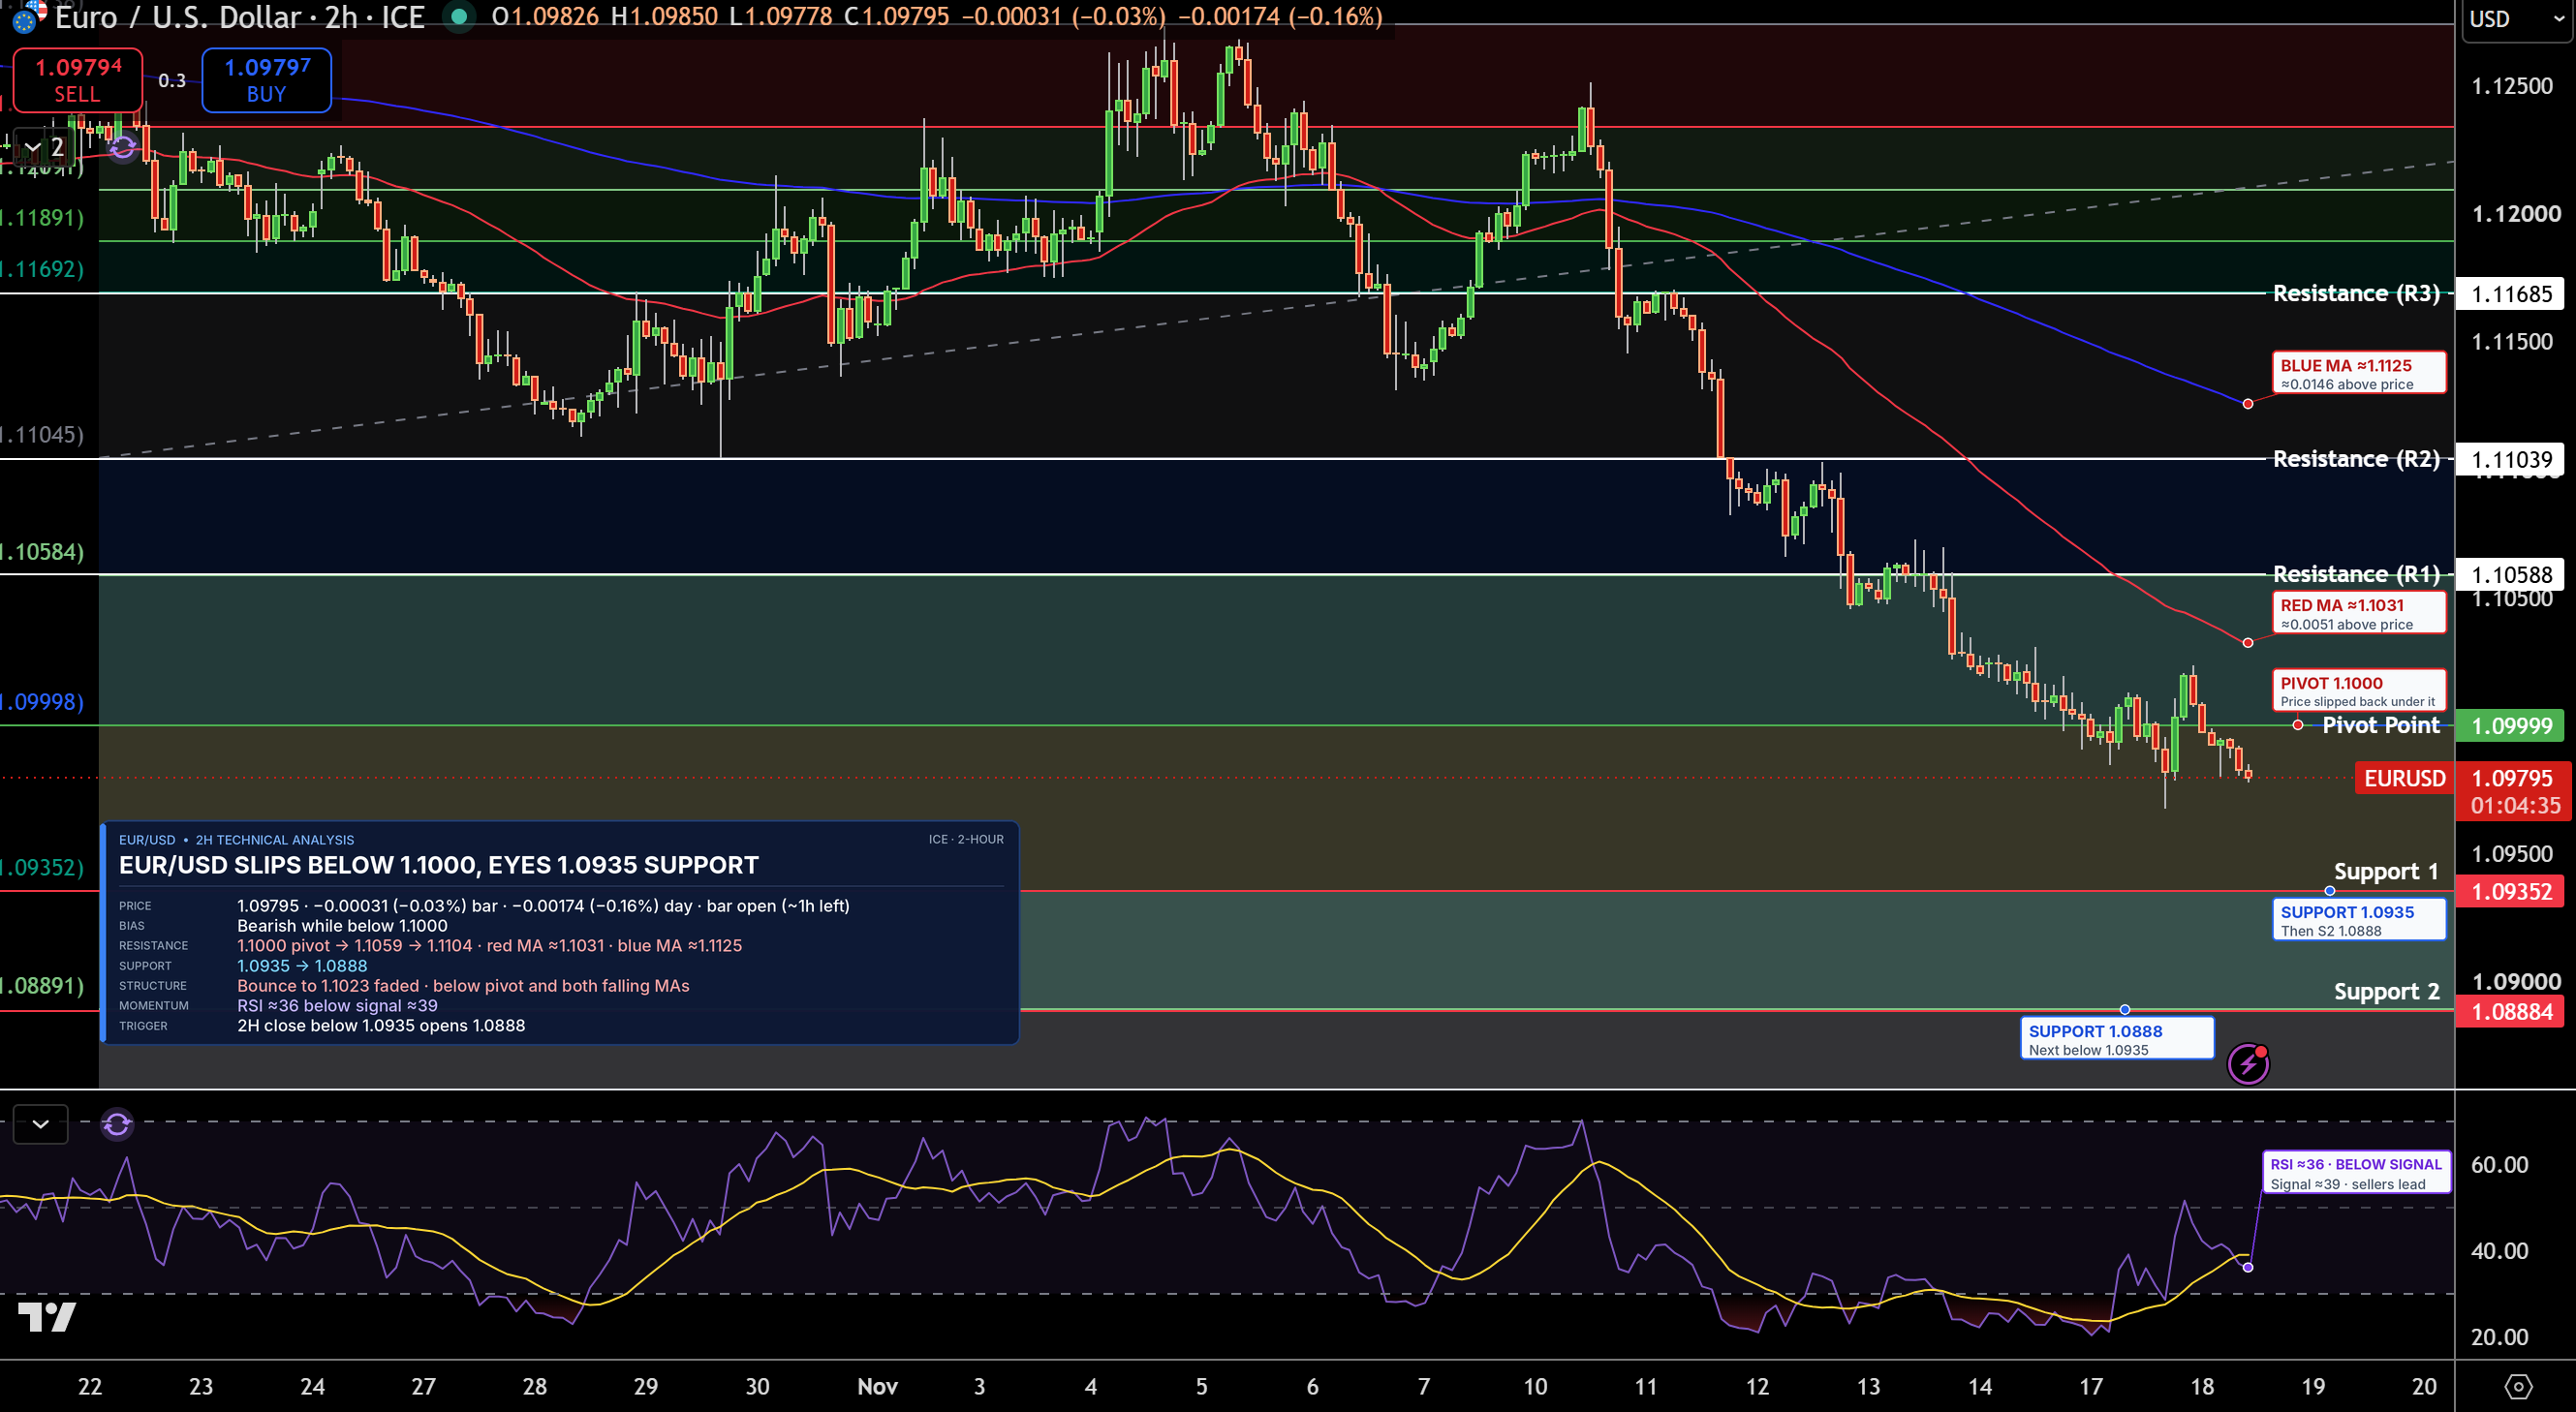
EUR/USD is trading near 1.0980 on the 2-hour chart. A bounce toward 1.1020 on Tuesday faded quickly, and the pair has dropped back below its 1.1000 pivot. Both moving averages are falling above price.
Support is 1.0935, then 1.0888. Resistance is 1.1000, then 1.1059. RSI is near 36 and below its signal line, so sellers have the edge. The bias stays bearish while EUR/USD holds below 1.1000, and a close below 1.0935 would open 1.0888.
GBP/USD Technical Analysis: Pound Holds 1.3174 Pivot but Stays Below 1.3239
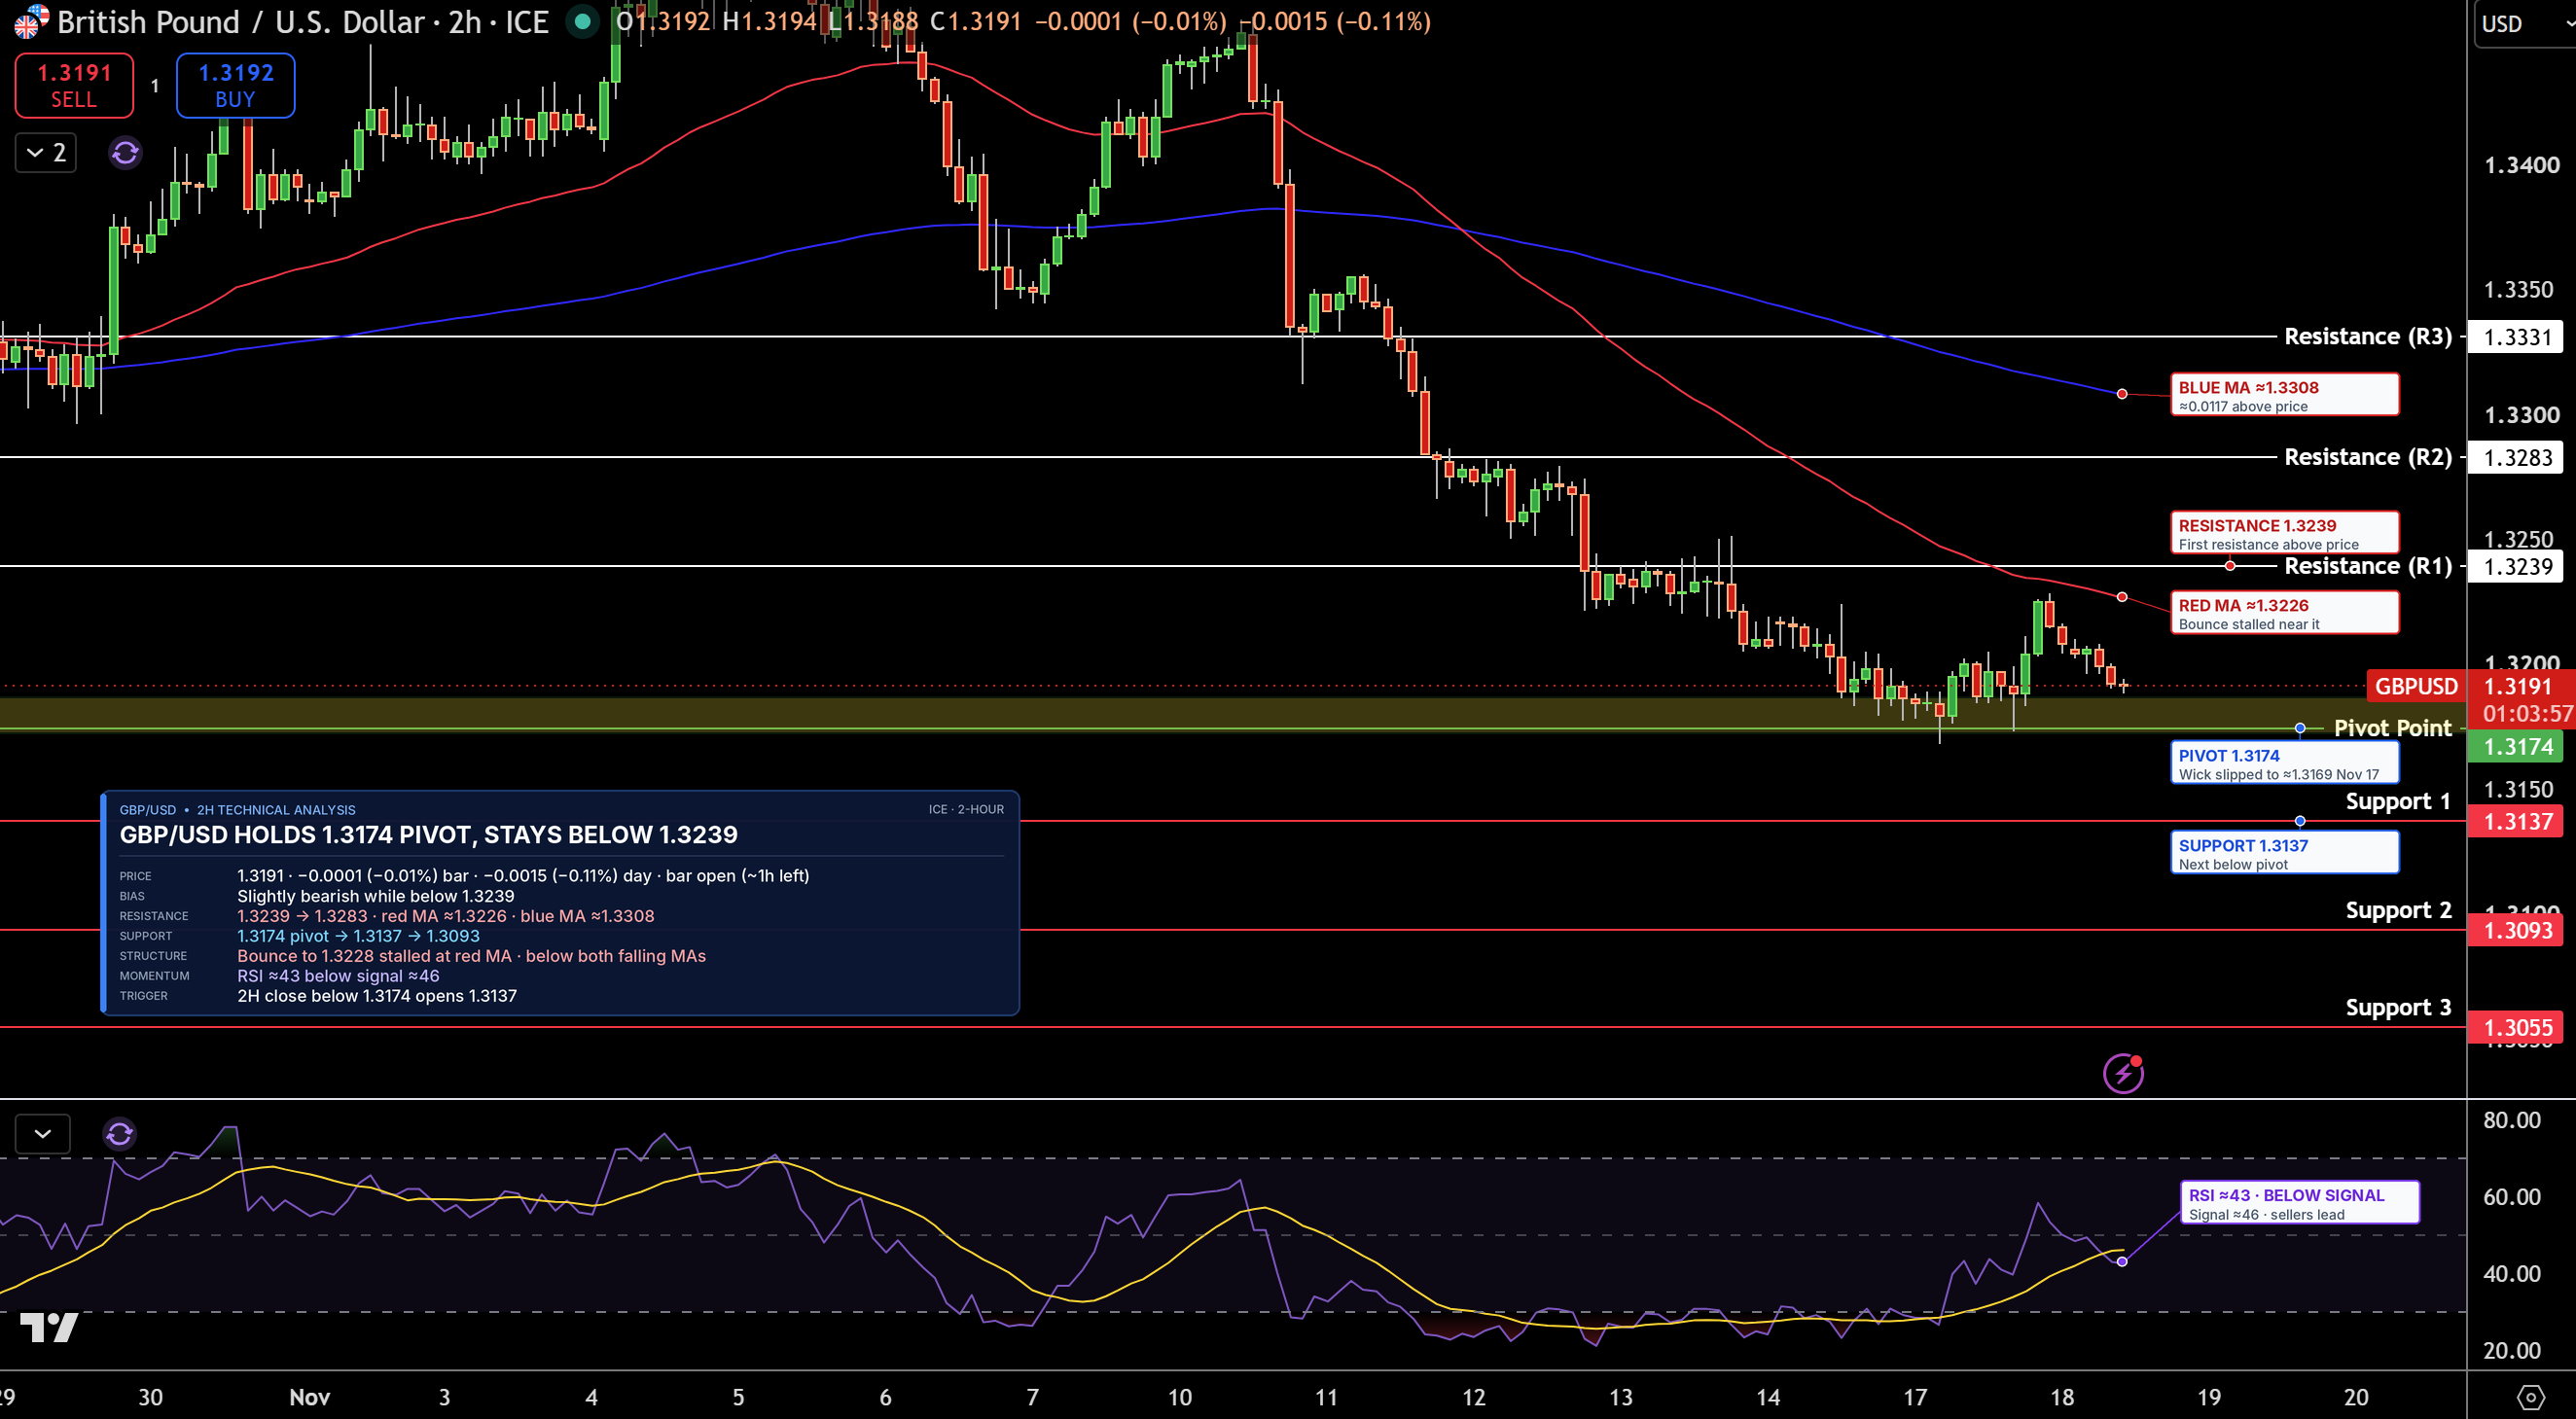
GBP/USD is trading near 1.3191 on the 2-hour chart. The pound bounced toward 1.3225 on Tuesday, but sellers stepped in near the faster moving average. Prices are now drifting back toward the 1.3174 pivot, which buyers have defended since last week.
Support is 1.3174, then 1.3137. Resistance is 1.3239, then 1.3283. RSI is near 43 and below its signal line. The pound keeps a slight bearish lean while it stays below 1.3239, and a close below 1.3174 would open 1.3137.