



The Dollar Heads for a Fourth Winning Week as a Temporary Safe Haven
The US dollar is poised to close its fourth consecutive week in positive territory, despite a decline in Treasury yields as market participants reassess the outlook for the Fed’s December rate decision. Just over a week ago, the probability of a 50-basis-point rate hike in December was approaching 15%, but by 10:30 GMT on Friday, it had dropped to zero. Moreover, futures now indicate a 2% chance that the rate will remain unchanged.
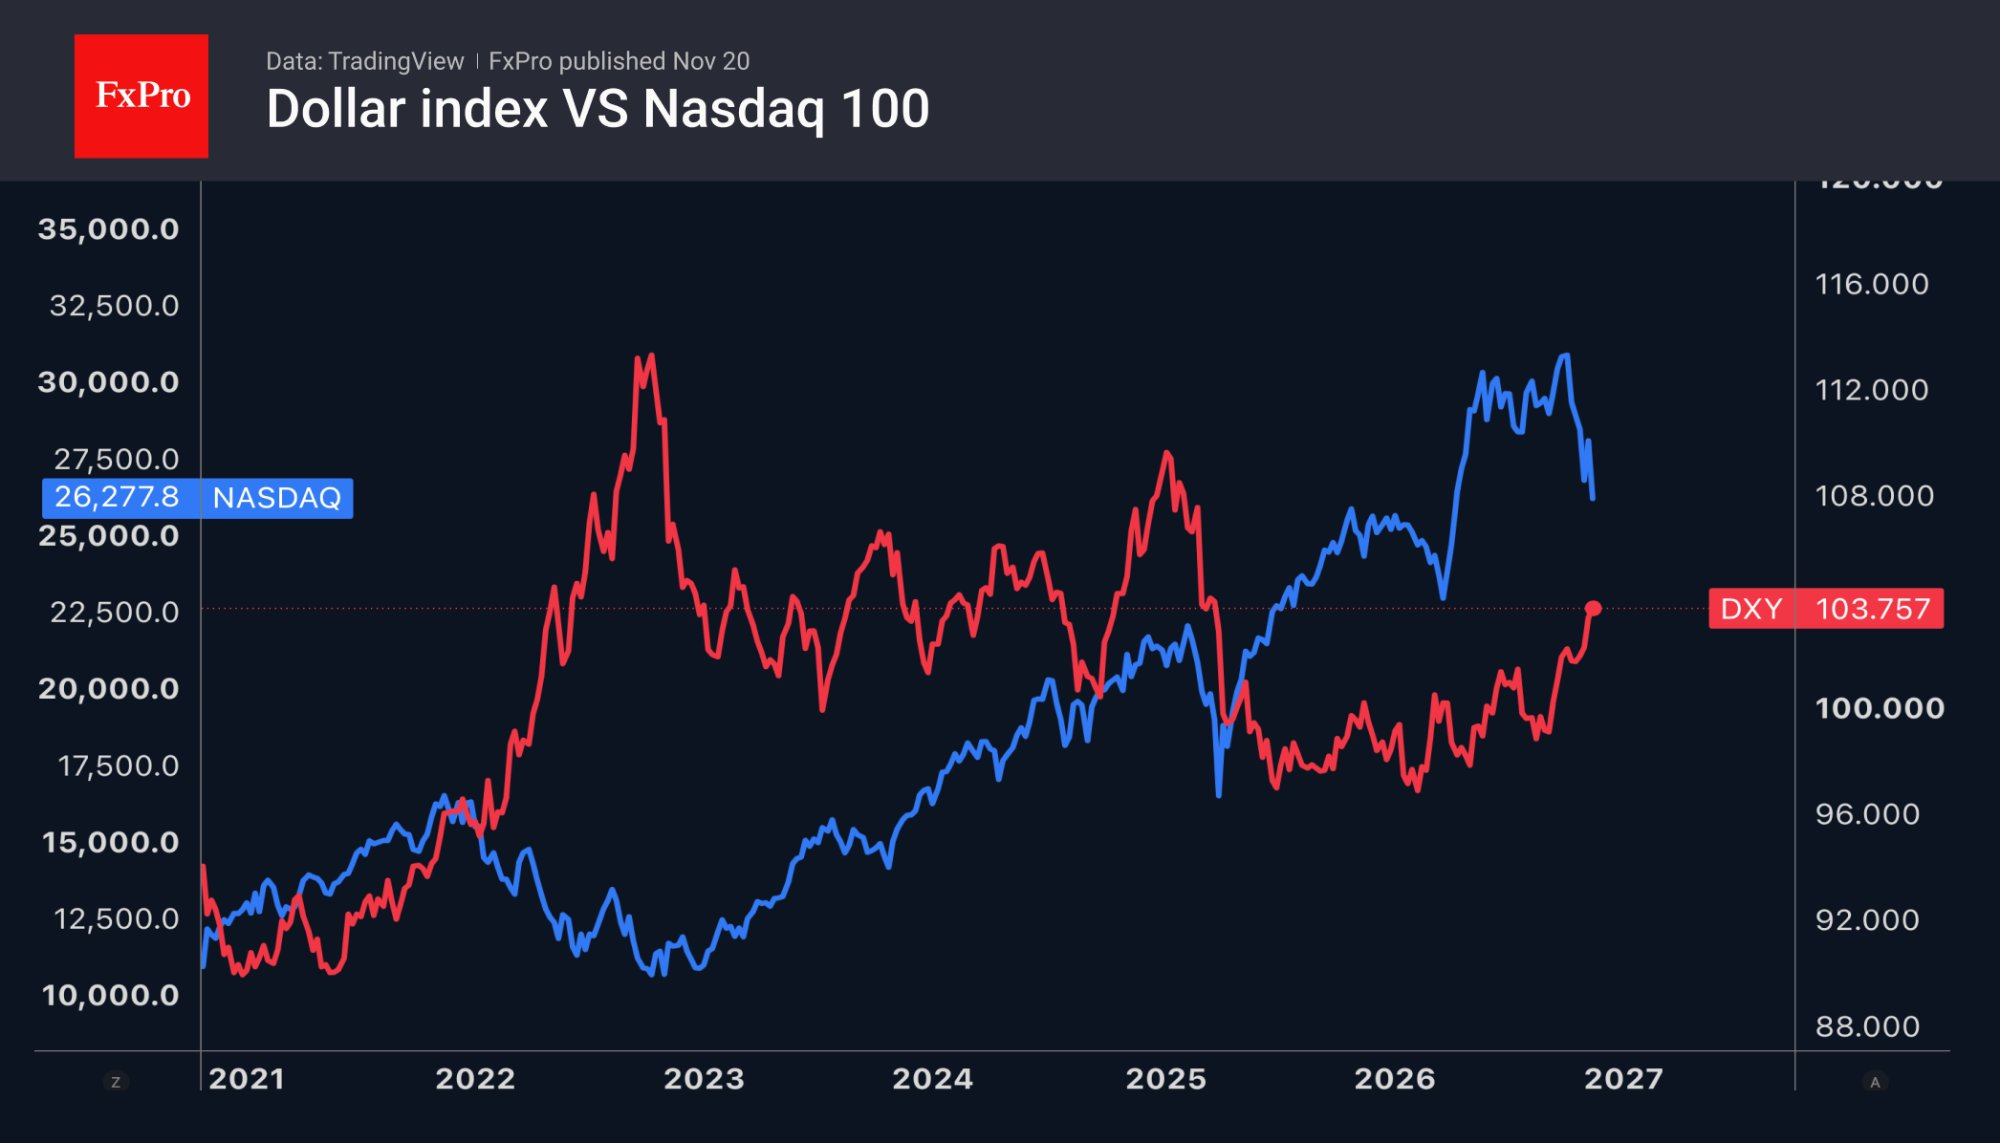
In fact, these fluctuations in expectations do not alter the baseline scenario of a 25-basis-point hike on 9 December. Still, they clearly illustrate a shift in the short-term trend in response to the market turmoil of recent days, which has temporarily turned the dollar into a safe haven. Looking back a little further, the greenback was supported by an inflow of foreign capital into US stock markets.
Artificial intelligence technologies have contributed to the strengthening of the US dollar by boosting the economy and increasing foreign capital inflows. According to Treasury Department estimates, from January to September, non-residents injected $670 billion into US assets, 43% more than during the same period in 2025, the highest since at least 2016.
Why a Nasdaq-100 Correction Threatens the Dollar
A correction in the Nasdaq-100 could hit the US dollar on several fronts at once. Non-residents will withdraw funds or hedge risks by selling US assets. A decline in the wealth effect will slow consumer spending, and market volatility threatens to deter companies from issuing stocks and bonds. The Fed may also reconsider its hawkish monetary policy stance for next year, although the December rate hike is unlikely to be taken off the table. Finally, the flight to safety will push down Treasury yields.
The Yen Is the Main Beneficiary: Inflation at 2.3% Backs a December BoJ Hike
The yen could be the main beneficiary of these developments. It has strengthened by 0.75% over the past 24 hours, more than any other G10 currency, due to the narrowing of the spread between US and Japanese government bond yields and market deleveraging. The JPY has outperformed another safe-haven currency, the CHF, thanks to the Bank of Japan’s focus on tightening monetary policy.
With the latest inflation data from Japan for October, Kazuo Ueda and his colleagues now have another argument for raising the overnight rate in the near future. Last month, consumer prices rose to 2.3% year-on-year, the highest level since November 2025. The futures market puts the odds of the BoJ tightening monetary policy in December at 85%, in line with the results of a Reuters survey.
Markets have priced in 78 basis points of BoJ rate hikes by the end of 2027, compared with 67 basis points now priced in for the Fed (-20 points over the week and -8 points over the day). In the short term, this does not hurt the dollar against most currencies. Still, overall it is eroding the foundations beneath the dollar, which could crack in the coming weeks if the emerging reassessment of expectations continues.
USD/JPY Price Forecast
Every new USD/JPY analysis as it publishes, today's technical signal and key levels, live price — on one page.
See all USD/JPY forecasts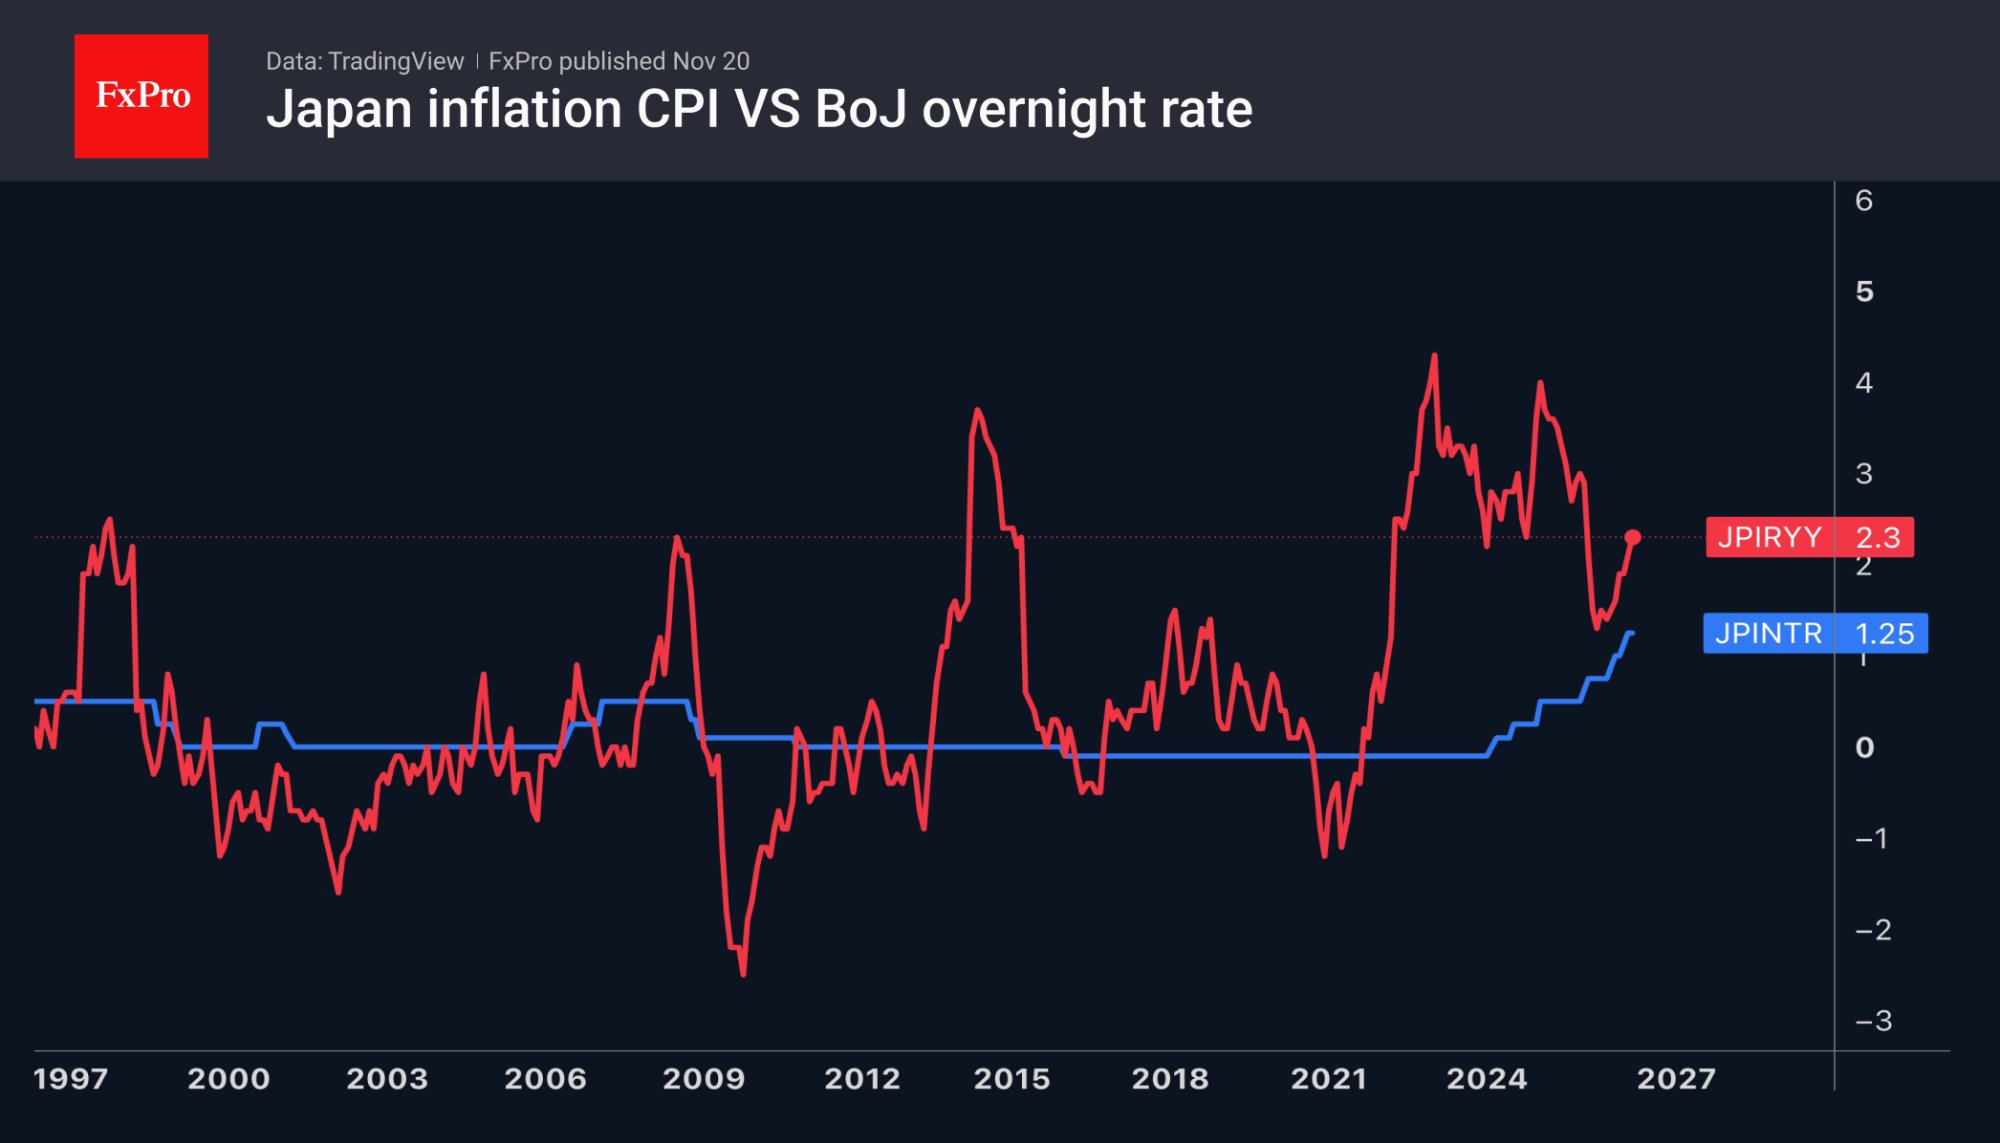
A decline in global risk appetite, accelerating inflation and expectations of a BoJ rate hike have allowed USDJPY to pull back from the 160 level to 158.8 as of 10:30 GMT, which is dangerous in terms of potential intervention.
Crypto Follows Stocks and Metals Down to $2.11T
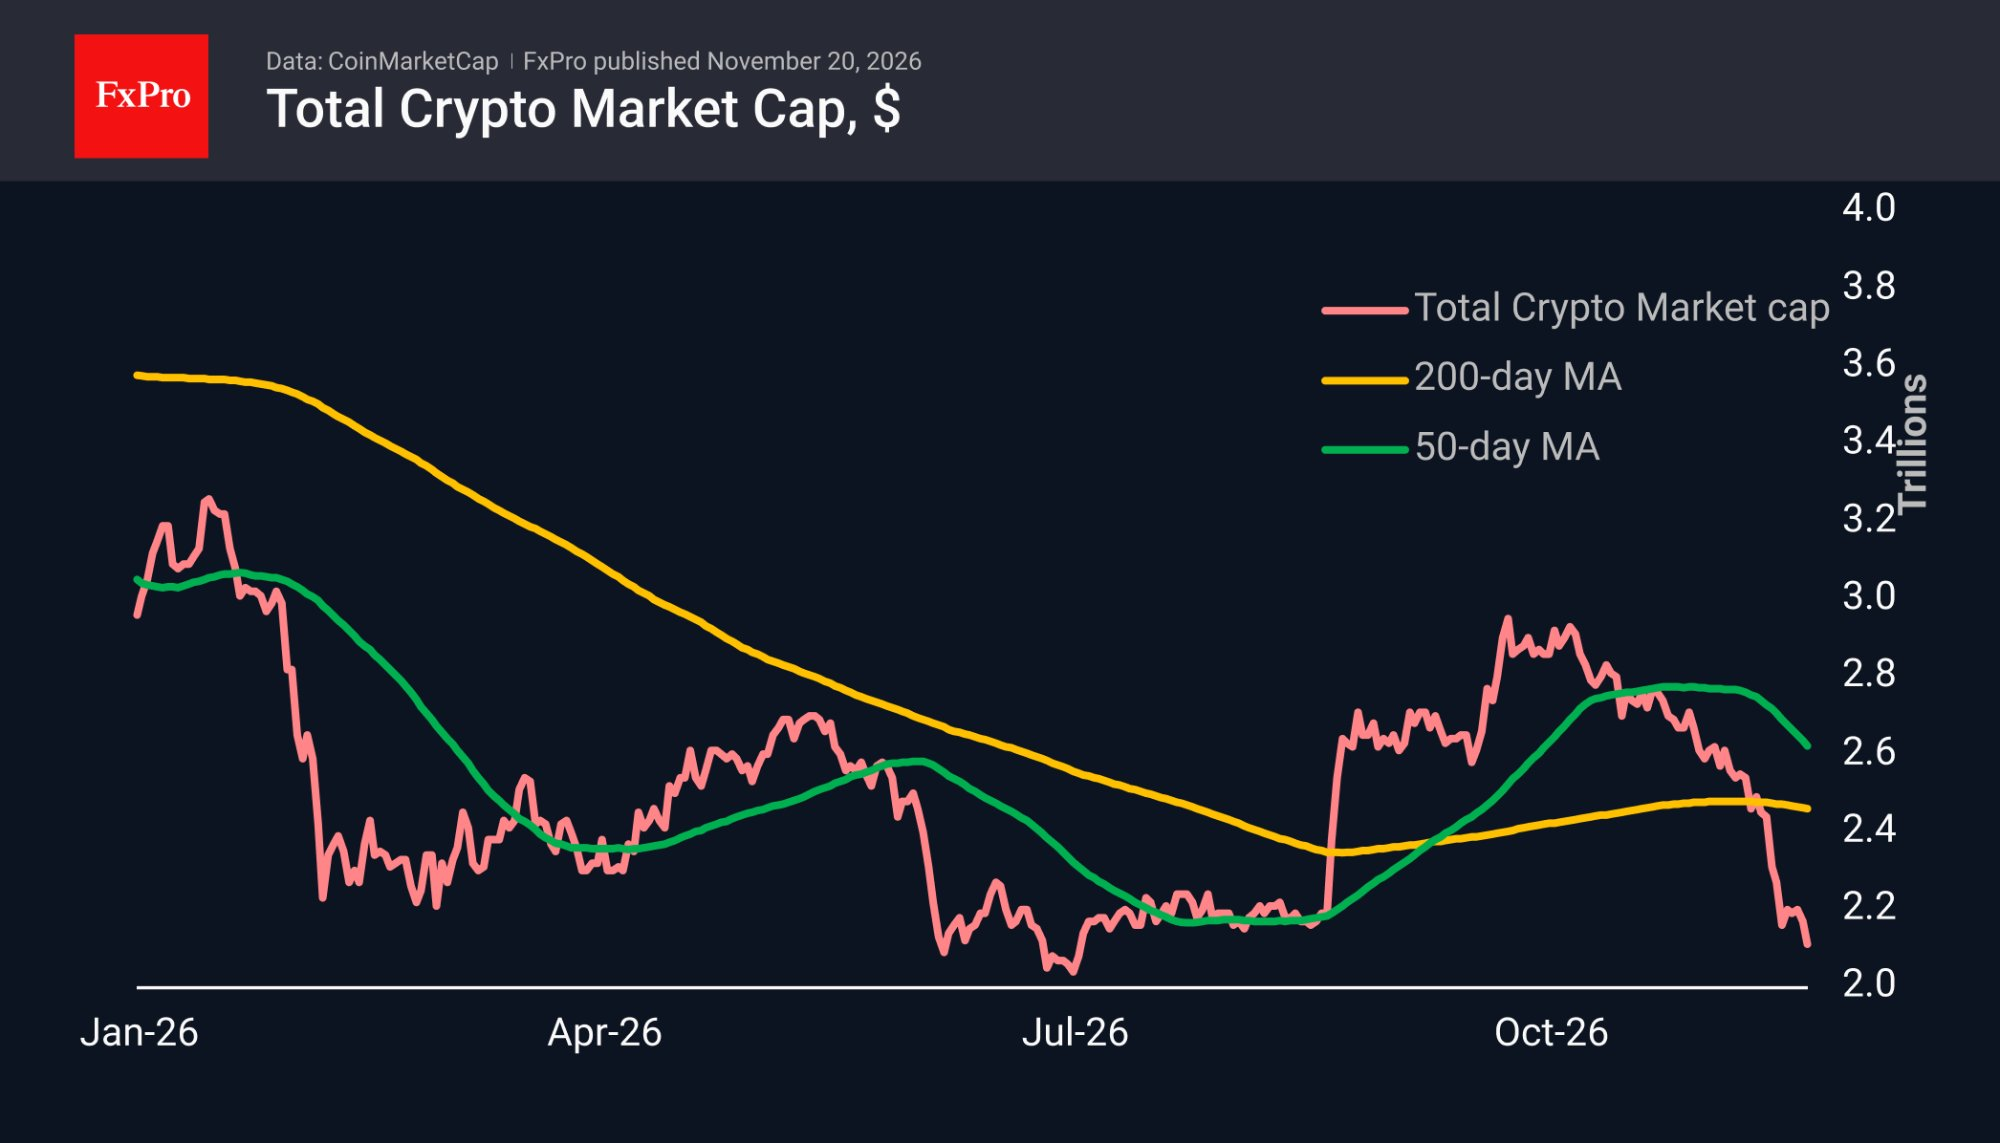
Crypto market capitalisation fell 2% over the past 24 hours to $2.11T, dipping to $2.1T at its low. This marks a return to the mid-summer lows, when the market bottomed out at $2.06T. A sudden downturn in stocks and metals shortly after the start of active trading in New York sent Nasdaq-100 futures down 5.7% from Thursday’s intraday high to a daily low at 6:30 GMT on Friday. The situation is no better for gold, which has lost nearly 15% in less than two weeks. Among the top altcoins, only Theta (+0.2%) has gained over the past 24 hours. Among other highly liquid coins, declines range from 1% (Filecoin) to 11.6% (Near Protocol).
Bitcoin Slips Below $62K and its July Support Zone
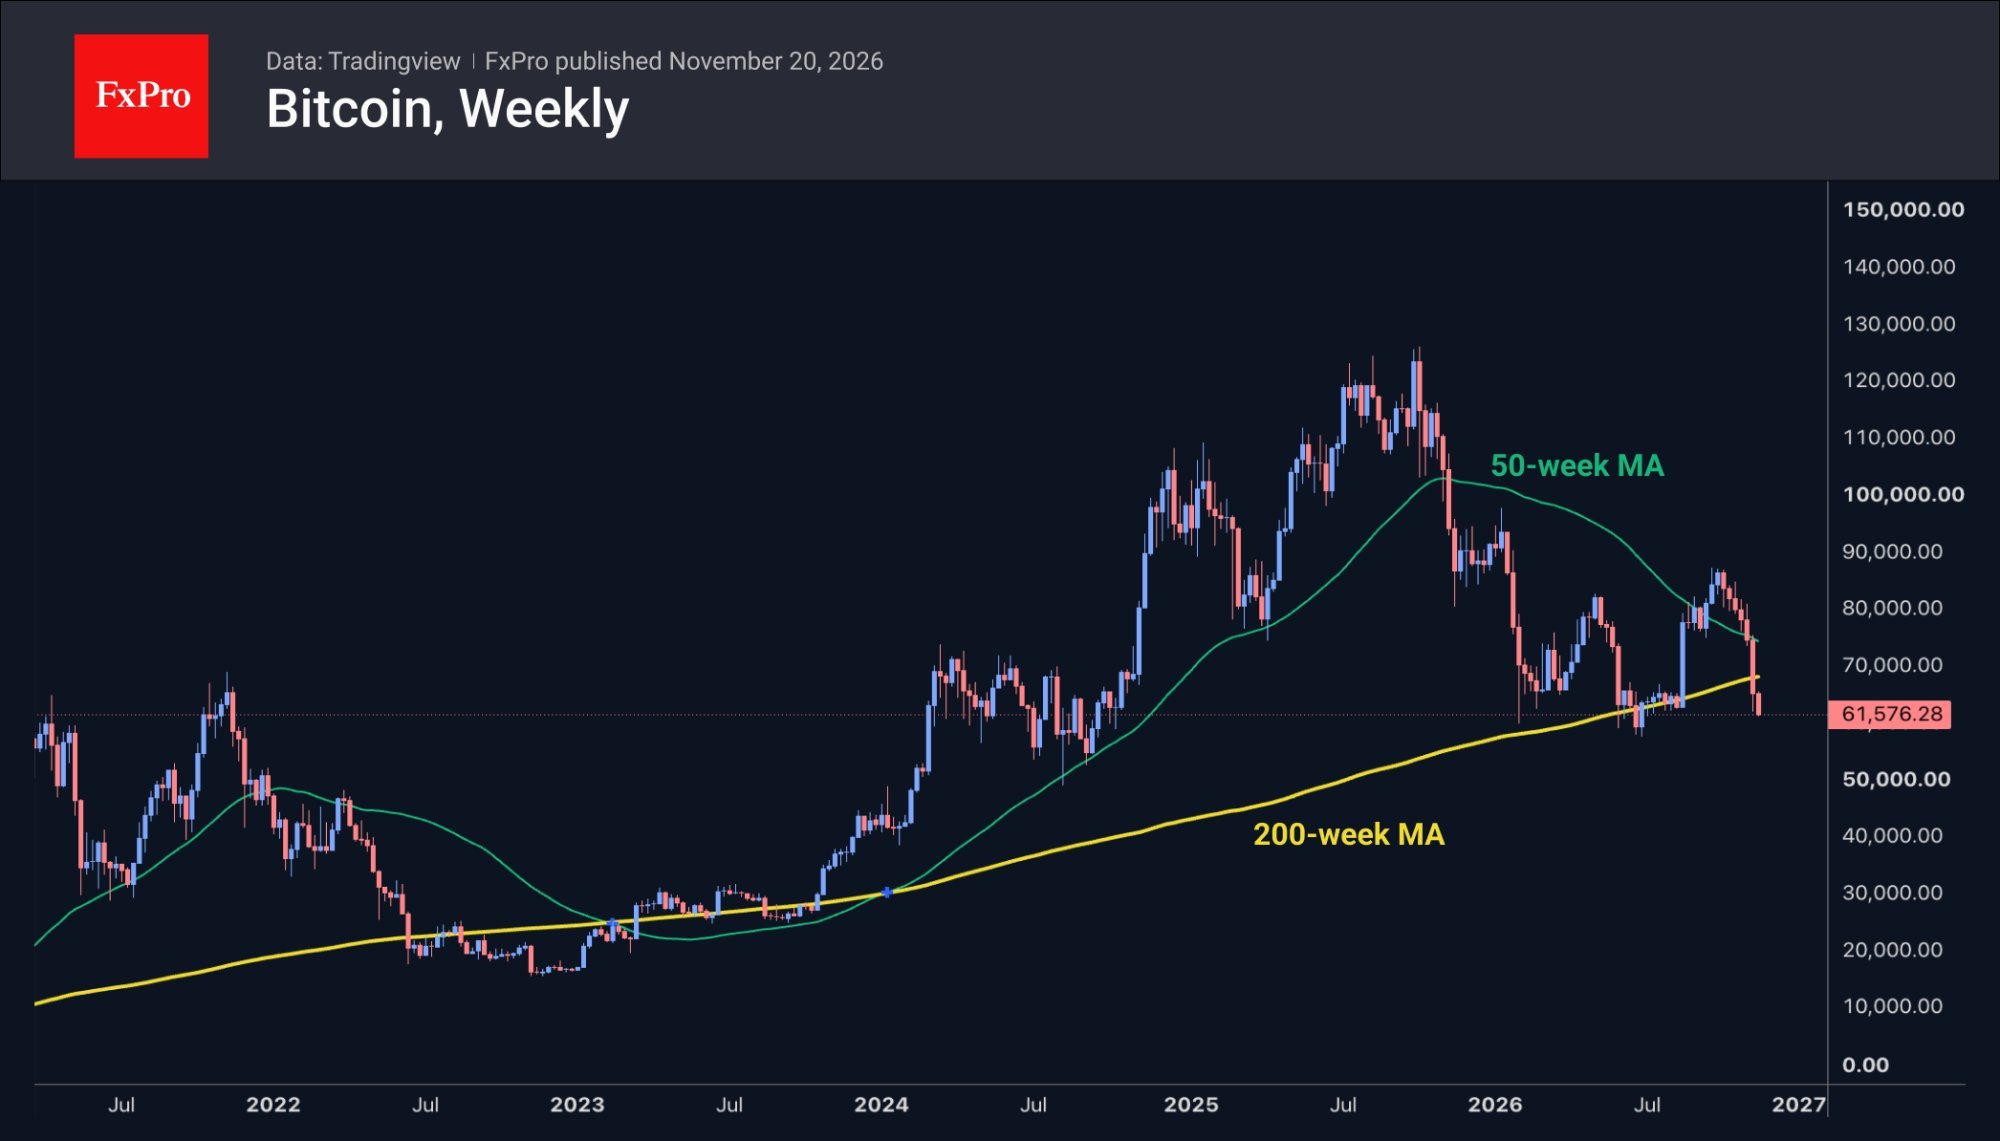
Bitcoin is trading around $61.8K, having slipped below the support zone established in the second half of July. At the start of the day, the price dropped to $61.2K. The leading cryptocurrency traded below this level for only 10 days this summer, mainly in late June. BTC has returned to the broad support zone that held in mid-2024.
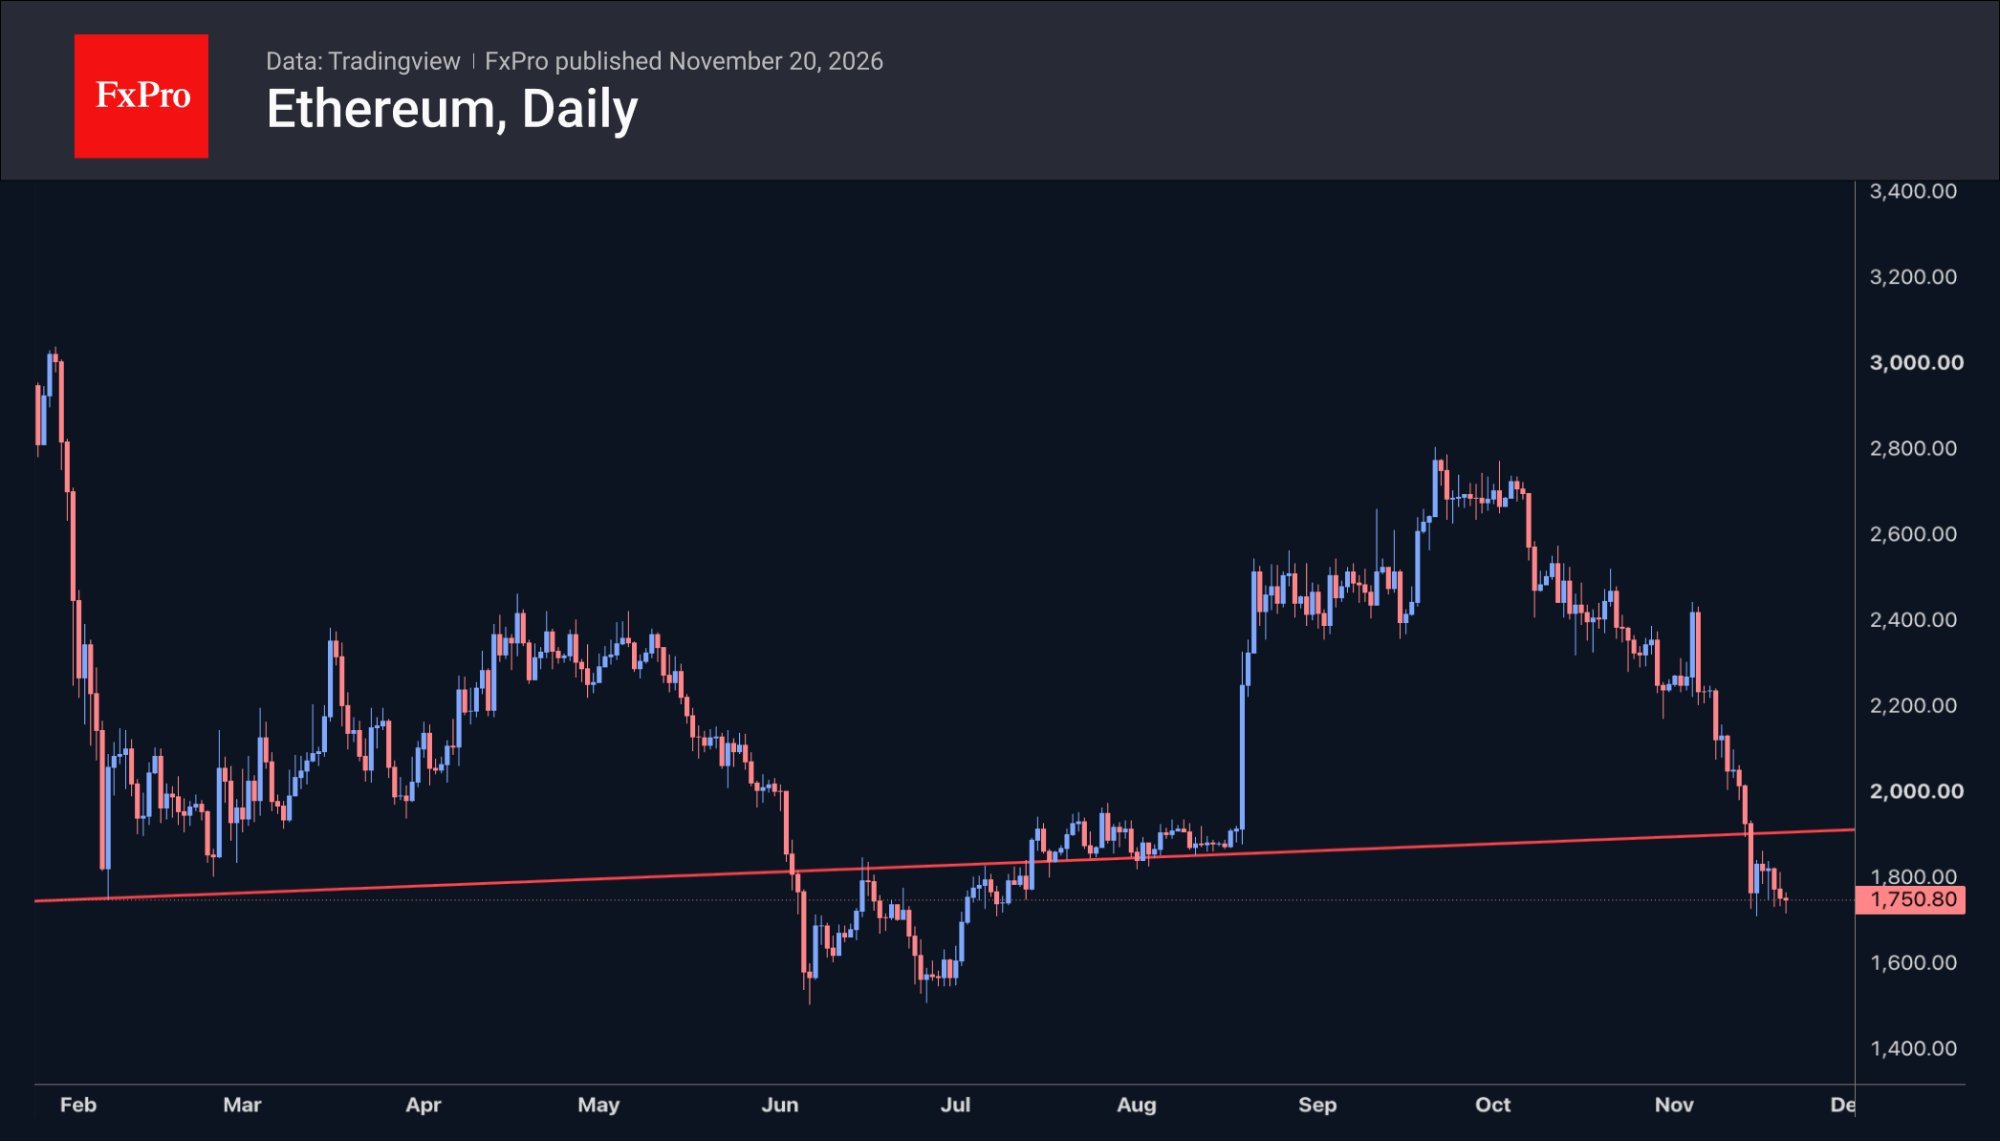
Ethereum at $1,750: No Capitulation Yet
Surprisingly, Ethereum has been less volatile than the stock market or even Bitcoin. From Tuesday to the start of Friday, the coin lost just over 4% but remains above Sunday’s lows, trading around $1,750. At these levels, the second-largest cryptocurrency is 15% above its June lows, leaving a sufficient margin of safety. This somewhat brightens the overall negative picture, showing that there has been no capitulation in cryptocurrencies so far. However, there is no shortage of negativity in global financial markets.
What to Watch
Base case for forex: in our view, the dollar is temporarily serving as a safe haven, gaining against most rivals but not against the yen, while further deleveraging is pushing USDJPY lower. Risk: a shift in expectations towards further US policy tightening and USDJPY consolidating above 160.
Base case for crypto: in our view, the crypto market remains hostage to sell-offs in stocks and metals, but the absence of capitulation in Ethereum limits the depth of the decline. Risks: a Bitcoin drop below its June lows near $58K and Ethereum below $1,500 would open the way to a new wave of selling, while a return of BTC above its 200-week moving average (around $68K) would signal a recovery.
Upcoming: PMI data on 23 November; US PCE and GDP on 25 November; the Fed decision on 9 December; and the Bank of Japan rate decision on 18 December.