


EUR/USD
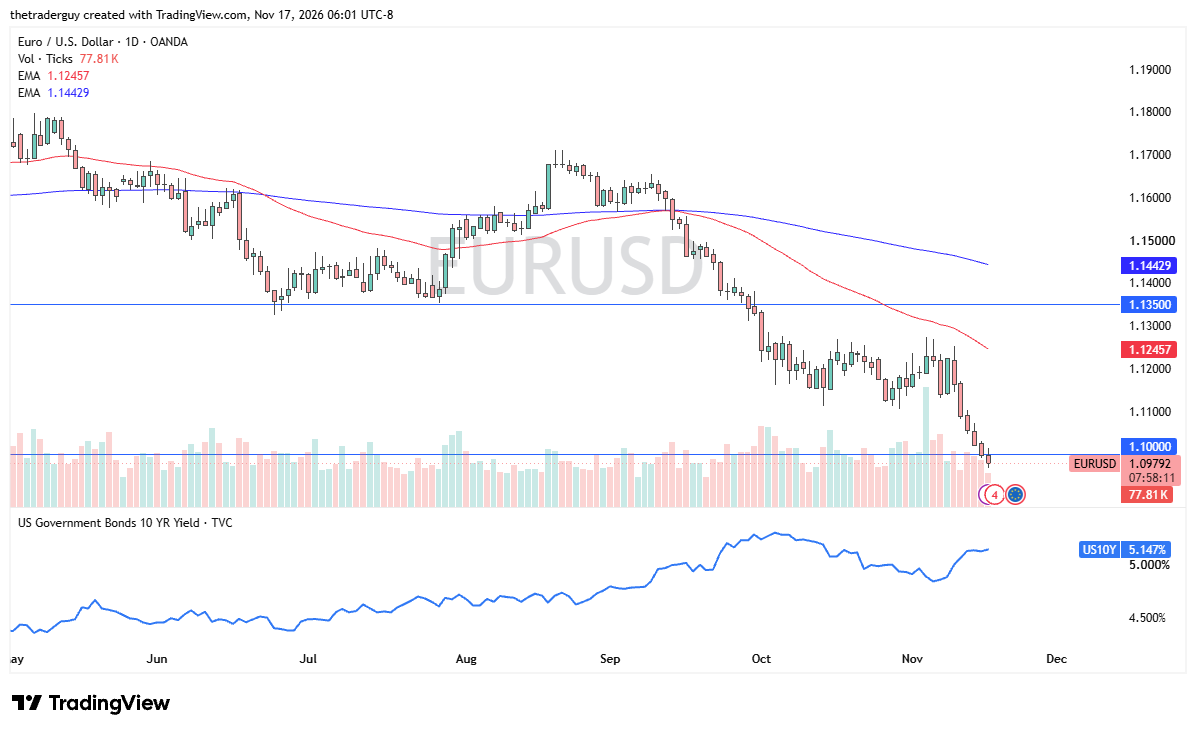
The euro continues to break down, as it is now below the 1.10 level and has cleared yet another large, round, psychologically significant figure. The ECB recently kept its deposit rate at 2.5%, while the Federal Reserve, of course, has higher rates and is expected to raise rates next month. The rate gap still favors the dollar on carry, and a sustained inflation overshoot in the United States continues to be a problem here. Rallies at this point in time continue to get sold into. From what I see, I think we are looking at a little bit of a bounce, more likely than not, from this psychologically important figure, though, so I’m looking to fade rallies.
USD/CAD
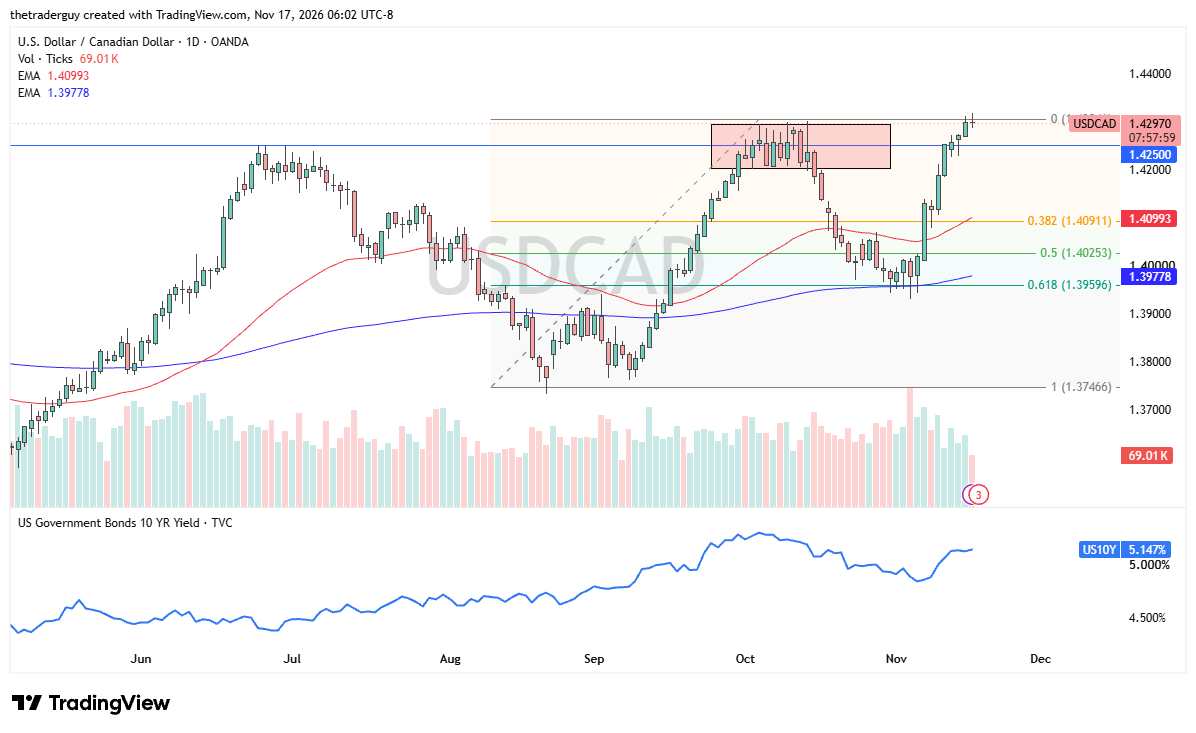
The U.S. dollar continues to threaten the 1.43 level, but the Canadian CPI for October came out yesterday at 3.1% year-over-year, matching September, and 0.2% month-over-month. That, of course, is mainly driven by energy. It’s a little bit of a mixed picture.
I think, really, at this point in time, we just have technical resistance here. If we can get a daily close above 1.43, I’d probably start looking for 1.45. Short-term pullbacks continue to get bought into from everything that I can see.
USD/JPY
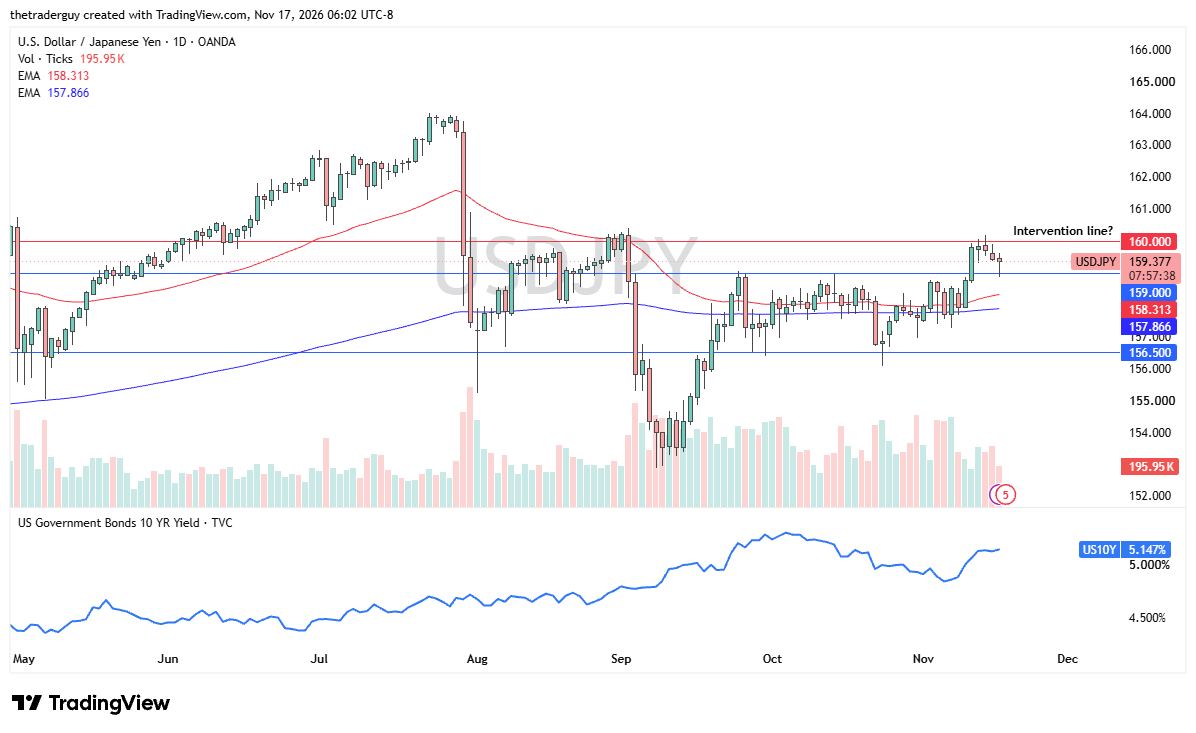
The U.S. dollar initially fell during the trading session here on Tuesday, but found the ¥159 level supportive enough to turn things around. The hammer that we are forming for the session, or at least trying to, is a sign of the underlying demand for U.S. dollars. Despite the fact that the Bank of Japan seems to be very sensitive to ¥160, the reality is the buyers are still out there taking advantage of the interest-rate differential.
GBP/USD
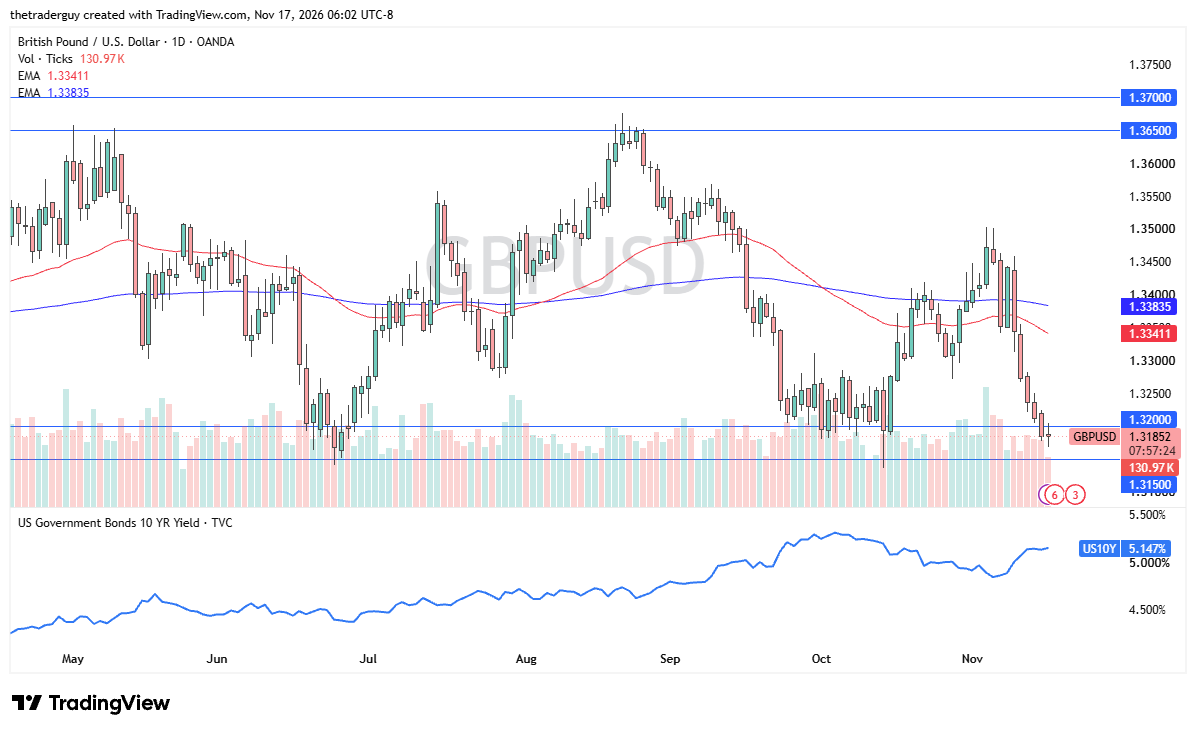
Finally, the British pound is bouncing around in a support region between 1.32 and 1.3150. Sterling had the Office for National Statistics report that regular pay growth slowed to 3.5% year-over-year in July through September from 3.7% during the previous quarter. Payroll employment fell by 34,000 between September and October, a provisional estimate, while vacancies declined by 22% in August through October to 690,000. Unemployment eased to 4.6%, though the ONS and survey rotation influenced the quarterly move.
EUR/USD Price Forecast
Every new EUR/USD analysis as it publishes, today's technical signal and key levels, live price — on one page.
See all EUR/USD forecasts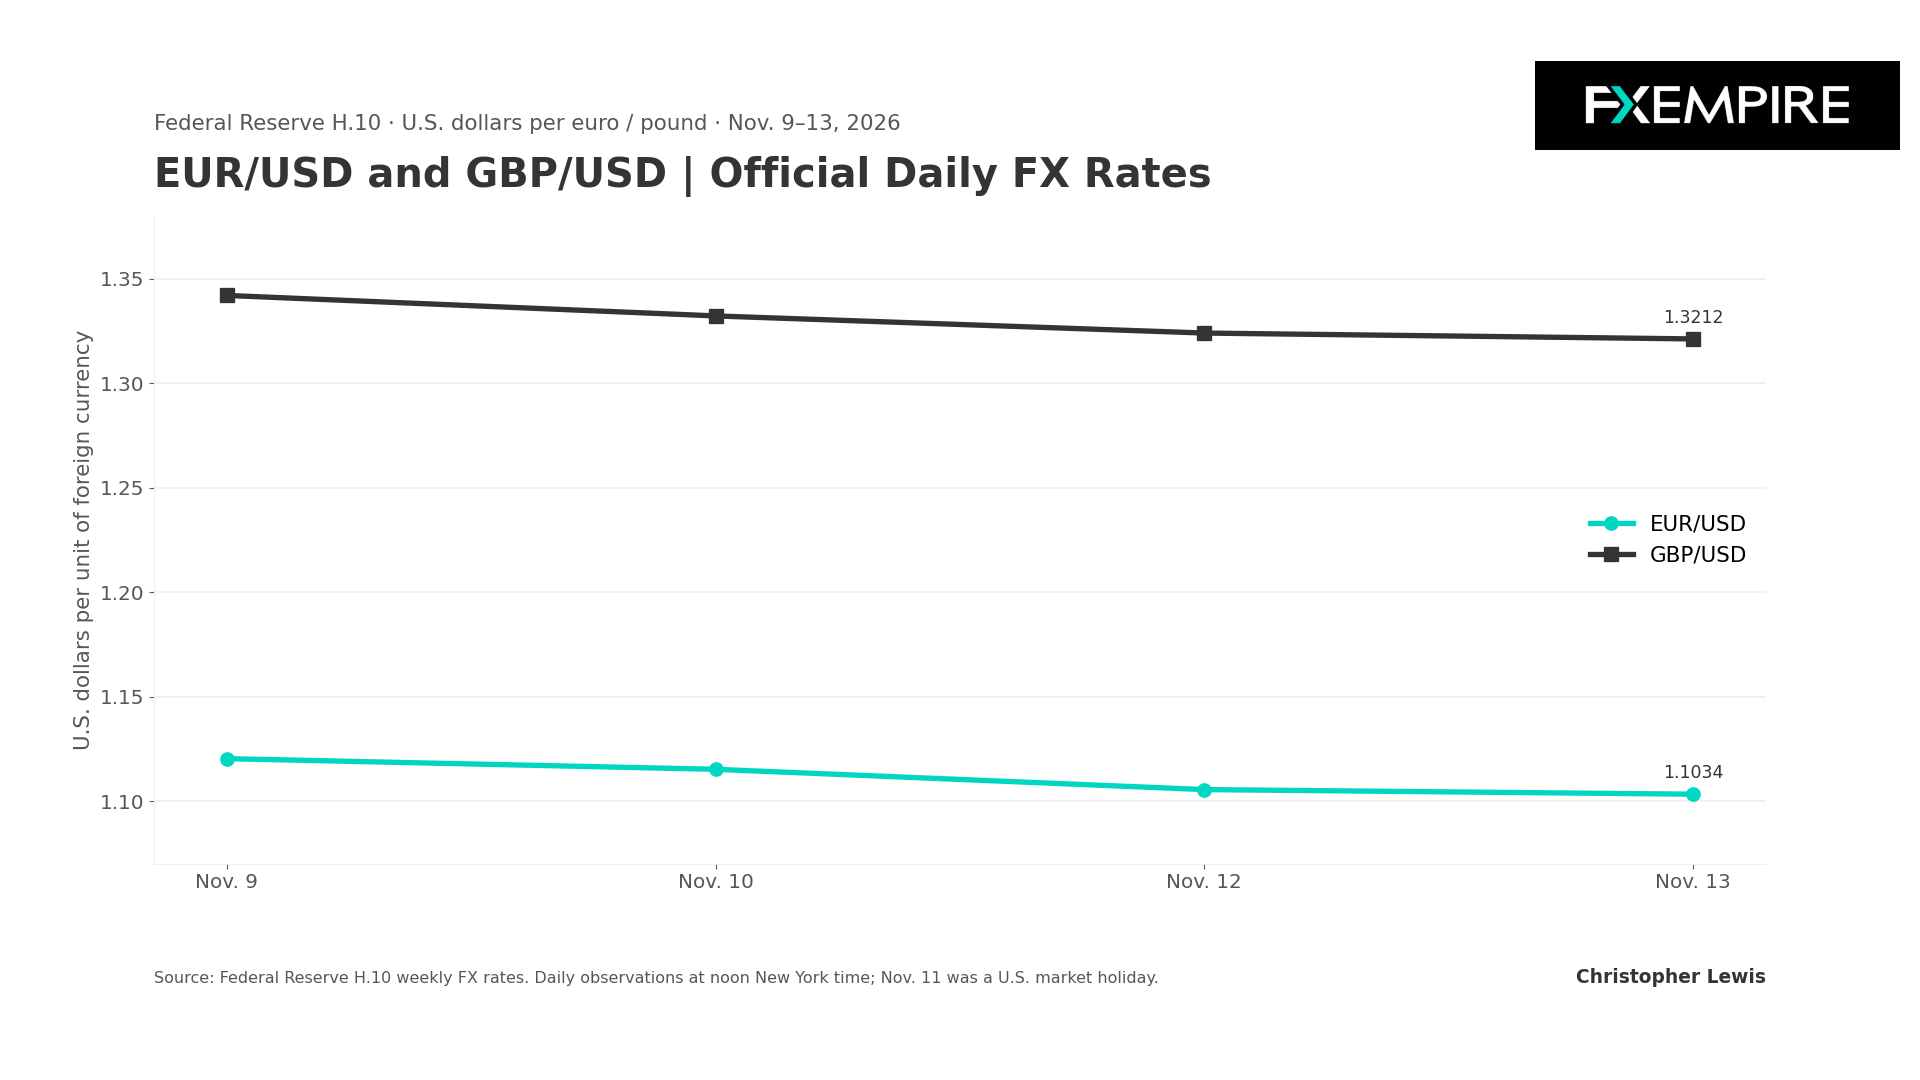
At this point, when I look at this, I see a market that could be next to fall. We are sitting on a major barrier of support, and a move below the 1.3150 level could get the downside moving. This will more likely than not be about the dollar, though.