
Advertisement
Advertisement
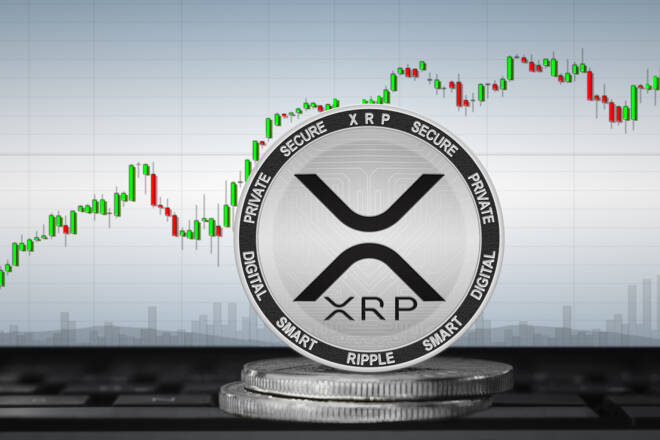
XRP Bulls to Target $0.53 on Ripple-Fueled SEC v Ripple Optimism
By:
XRP enjoyed a bullish Friday, with SEC v Ripple chatter delivering support. However, Fed Fear returned following the March US Jobs Report.
Key Insights:
- On Friday, XRP bucked the broader crypto market trend, rising by 1.98% to end the day at $0.51308.
- SEC v Ripple case chatter delivered a bullish session, with investors brushing aside rising bets of a US-Jobs Report-fueled Fed interest rate hike.
- The technical indicators are bullish, signaling a return to $0.55.
On Friday, XRP rose by 1.98%. Reversing a 0.66% loss from Thursday, XRP ended the day at $0.51308. XRP avoided sub-$0.49 for the third consecutive session.
A bearish start to the day saw XRP fall to an early low of $0.49702. Steering clear of the First Major Support Level (S1) at $0.4933, XRP rallied to a mid-morning high of $0.51479. XRP broke through the First Major Resistance Level (R1) at $0.5114 before falling back to sub-$0.51. However, finding late support, XRP briefly broke through R1 for a second time before easing back to end the day at $0.51308.
SEC v Ripple Chatter Offset Fears of a Fed Interest Rate Hike
It was a quiet Friday, with no SEC v Ripple case updates to provide direction. However, the Head of Ripple Policy, Susan Friedman, drew investor interest by discussing the nuances of cryptos.
Susan Friedman referenced Gary Gensler’s most recent comments relating to cryptos and securities, saying,
“Unlike securities, crypto usually doesn’t involve a financial claim on the offerer and can be settled in real-time without intermediaries. These differences warrant tailored rules – not canned assurances that a one-size fits all approach will work for everyone. It doesn’t.”
On Thursday, SEC Gary Gensler continued to push the SEC ambition to oversee the digital asset space, saying,
“There’s nothing incompatible in the crypto mkts w/ the securities laws. A goal of our work at the SEC is to bring this field into compliance. That way, investors get the same time-tested protections they get elsewhere in the markets.”
Gensler’s comments drew condemnation from the crypto community.
Favorable references to the classification of cryptos offset the impact of the US Jobs Report on sentiment toward Fed monetary policy. A solid increase in nonfarm payrolls and a fall in the US unemployment rate fueled bets of a 25-basis point Fed interest rate hike in May.
The Day Ahead
Investors should continue to monitor the crypto news wires and Twitter chatter. SEC v Ripple case chatter will provide direction. However, a lack of SEC v Ripple-related news will leave regulatory activity in the spotlight. Binance and Coinbase (COIN) commentary will also move the dial.
XRP Price Action
At the time of writing, XRP was down 1.24% to $0.50671. A bearish start to the day saw XRP fall from an opening price of $0.51285 to an early low of $0.50671.
Technical Indicators
XRP needs to move through the $0.5083 pivot to target the First Major Resistance Level (R1) at $0.5196. A move through the Friday high of $0.51479 would signal a bullish session. However, SEC v Ripple chatter would need to support a breakout.
In the case of another extended rally, XRP would likely test the Second Major Resistance Level (R2) at $0.5261 and resistance at $0.53. The Third Major Resistance Level (R3) sits at $0.5438.
Failure to move through the pivot would leave the First Major Support Level (S1) at $0.5018 in play. However, barring an extended sell-off, XRP should avoid sub-$0.4950 and the Second Major Support Level (S2) at $0.4905. The Third Major Support Level (S3) sits at $0.4728.
The EMAs and the 4-hourly candlestick chart (below) sent bullish signals.
At the time of writing, XRP sat above the 50-day EMA, currently at $0.50521. The 50-day EMA pulled away from the 100-day EMA, with the 100-day EMA widening from the 200-day EMA. The EMAs delivered bullish signals.
A hold above the 50-day EMA ($0.50521) would support a breakout from R1 ($0.5196) to target R2 ($0.5261) and $0.53. However, a fall through the 50-day EMA ($0.50521) and S1 ($0.5018) would bring S2 ($0.4905) into view. A fall through the 50-day EMA would send a bearish signal.
About the Author
Bob Masonauthor
With over 28 years of experience in the financial industry, Bob has worked with various global rating agencies and multinational banks. Currently he is covering currencies, commodities, alternative asset classes and global equities, focusing mostly on European and Asian markets.


Advertisement