Advertisement
Advertisement
Using Dynamic Fibonacci Retracements
By:
Intro
Most of us are familiar with Fibonacci retracements. If you are not, you can find information all over the internet about the mathematician who lived in
Most of us are familiar with Fibonacci retracements. If you are not, you can find information all over the internet about the mathematician who lived in Italy between 1170 and 1250, who formulized mathematical term using what he observed in nature. His discoveries have been used by technical analysts for decades, but these targets are only helpful if they can be used to define a trade.
Technicians have focused on the Fibonacci a sequence which forms the basis of the Fibonacci retracement. The most famous retracements are the 38.2%, 50%, and 61.8%. A relatively standard use of the Fibonacci retracement is the gauge how much an asset will retrace after ascending or declining.
For example, if the price of asset XYZ drops from $100 to $40, then the Fibonacci retracement levels would be $60 the difference * 38.2%, 50% and 61.8%, and then added back to $40 to find the levels the market should retrace to which would be $62.9, $70 and $77.
The real question is what will likely happen if the market starts following this self-fulfilling prophesy and retracing toward these levels? Will they stop at the 38.2% retracement, or will the asset continue to climb? Now if you knew that, you would have an excellent advantage. As opposed to picking indiscriminate levels to buy or sell and asset, you would have a target point to place a trade, as the market moved toward pre-determined points.
The key is to add another layer on top of the Fibonacci retracements to determine if the target levels Once the market arrives, you can use other indicators to determine if momentum is strong and prices are likely to push through to the next retracement level, or if the market is overbought or oversold and it will pause, and turn in the other direction.
The Fibonacci levels, give us a place to measure the market, and since many people are evaluating price action at those point, we use that to pin point the markets temperature. Gauging the temperature of the market at these levels is the key to success.
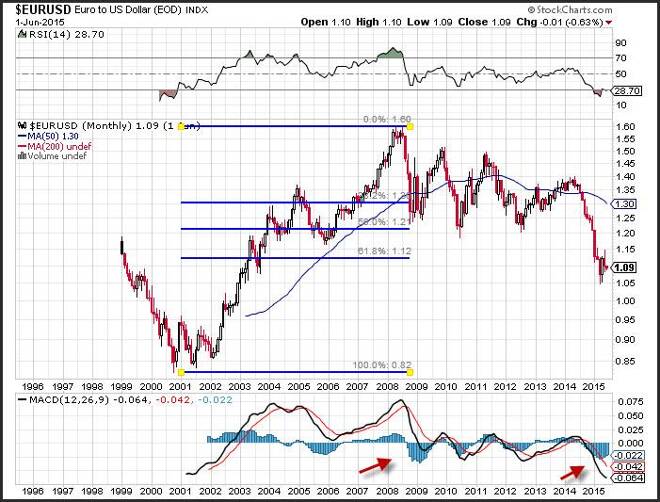
For example, the Euro soared from its low in 2001 up to a high of 1.60 before beginning to move lower after the US financial crisis. As it moved lower it retraced back to a number of key Fibonacci levels. The first being the 38.2% retracement level.
Here the EUR/USD approached a retracement level just as negative momentum accelerated to a higher gear, foreshadowing a continued downward slide. The MACD (moving average convergence divergence) index generated a sell signal as the spread (the 12-day moving average minus the 26-day moving average) crossed below the 9-day moving average of the spread. The index moved from positive to negative territory confirming the sell signal.
Weekly price action eventually stopped at the 50% retracement. In June of 2015, the Euro held support levels near the 61.8% retracement. Will it bounce or continue? While the RSI (relative strength index), a momentum oscillator is flashing an oversold signal, which foreshadows a correction. The reading of 28.7, is below the oversold trigger level of 30. The MACD has not yet turned, and is still reflecting accelerating negative momentum. A third confirmation on this trade would be a MACD buy signal.
By using a combination of different indicators a trader can use the Fibonacci retracement levels as targets that will tested, and will be defined by support or an area where the market paused only to refresh.
About the Author
David Beckerauthor
David Becker focuses his attention on various consulting and portfolio management activities at Fortuity LLC, where he currently provides oversight for a multimillion-dollar portfolio consisting of commodities, debt, equities, real estate, and more.
Advertisement
