Advertisement
Advertisement
Dow Jones 30 and NASDAQ 100 Price Forecast October 19, 2017, Technical Analysis
Updated: Oct 19, 2017, 04:54 GMT+00:00
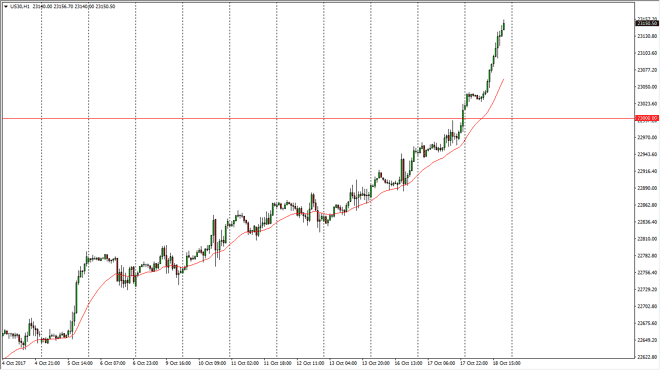
Dow Jones 30 The Dow Jones 30 continues to rally significantly during the day on Wednesday, reaching to fresh, new highs. The 23,000 level should now
Dow Jones 30
The Dow Jones 30 continues to rally significantly during the day on Wednesday, reaching to fresh, new highs. The 23,000 level should now offer a significant floor in the market, and I believe that now that we have clear that level significantly, there is a significant amount of buying pressure just waiting to happen. I think that pullbacks are coming, but those should be value propositions that we can take advantage of as we are without a doubt overbought at this point. Nonetheless, selling is all but an impossibility, and looking for pullbacks that show signs of support will probably be the best way to trade this market going forward as there seems to be nothing that can stop the longer-term move. However, if we break down below the 23,000 level, the market should then find the 22,800-level underneath as support.
Dow Jones 30 and NASDAQ Index Video 19.10.17
NASDAQ 100
The NASDAQ 100 is a little bit different, in the sense that it is a bit more subdued than the Dow Jones 30 is. We pulled back during the day, reaching towards the 6100-level underneath to find support. We have bounce from there, and it looks like we will continue to grind our way to the upside. The 6050-level underneath is the “floor” in the market, and the market continues to buy on dips. The 24-hour exponential moving average is turning out, and it seems to be a nice measuring stick for traders to get involved. The NASDAQ 100 has been a leader longer-term, but it seems like more money is flowing into industrials now than technology, perhaps trying to play catch-up. Ultimately, I think we go looking towards the 6200 level above, based upon the breakout of the ascending triangle below the 6000 handle.
About the Author
Christopher Lewisauthor
Chris is a proprietary trader with more than 20 years of experience across various markets, including currencies, indices and commodities. As a senior analyst at FXEmpire since the website’s early days, he offers readers advanced market perspectives to navigate today’s financial landscape with confidence.
Advertisement
