
Advertisement
Advertisement
GBP/USD Price Forecast: Sub-$1.215 Brings $1.1950 into Play
By:
Appetite for riskier assets delivered Pound support this morning. BoE MPC member chatter later in the day could reverse gains from this morning, however.
It is a quiet day ahead on the UK economic calendar, with no stats to influence the Pound.
The lack of stats will leave the Pound in the hands of market risk sentiment throughout the day.
Later today, Bank of England Monetary Policy Committee (MPC) members Jonathan Haskel and Catherine L Mann are due to speak. The markets will be looking for any chatter on the economic outlook and monetary policy.
Haskel will deliver opening remarks at the TechUK Policy Leadership Conference ‘Restarting the future: how to fix the intangible economy.’ (9 am BST).
Mann is a panelist at MNI Market News ‘UK economic & policy developments.’ (2 pm BST).
GBP/USD Price Action
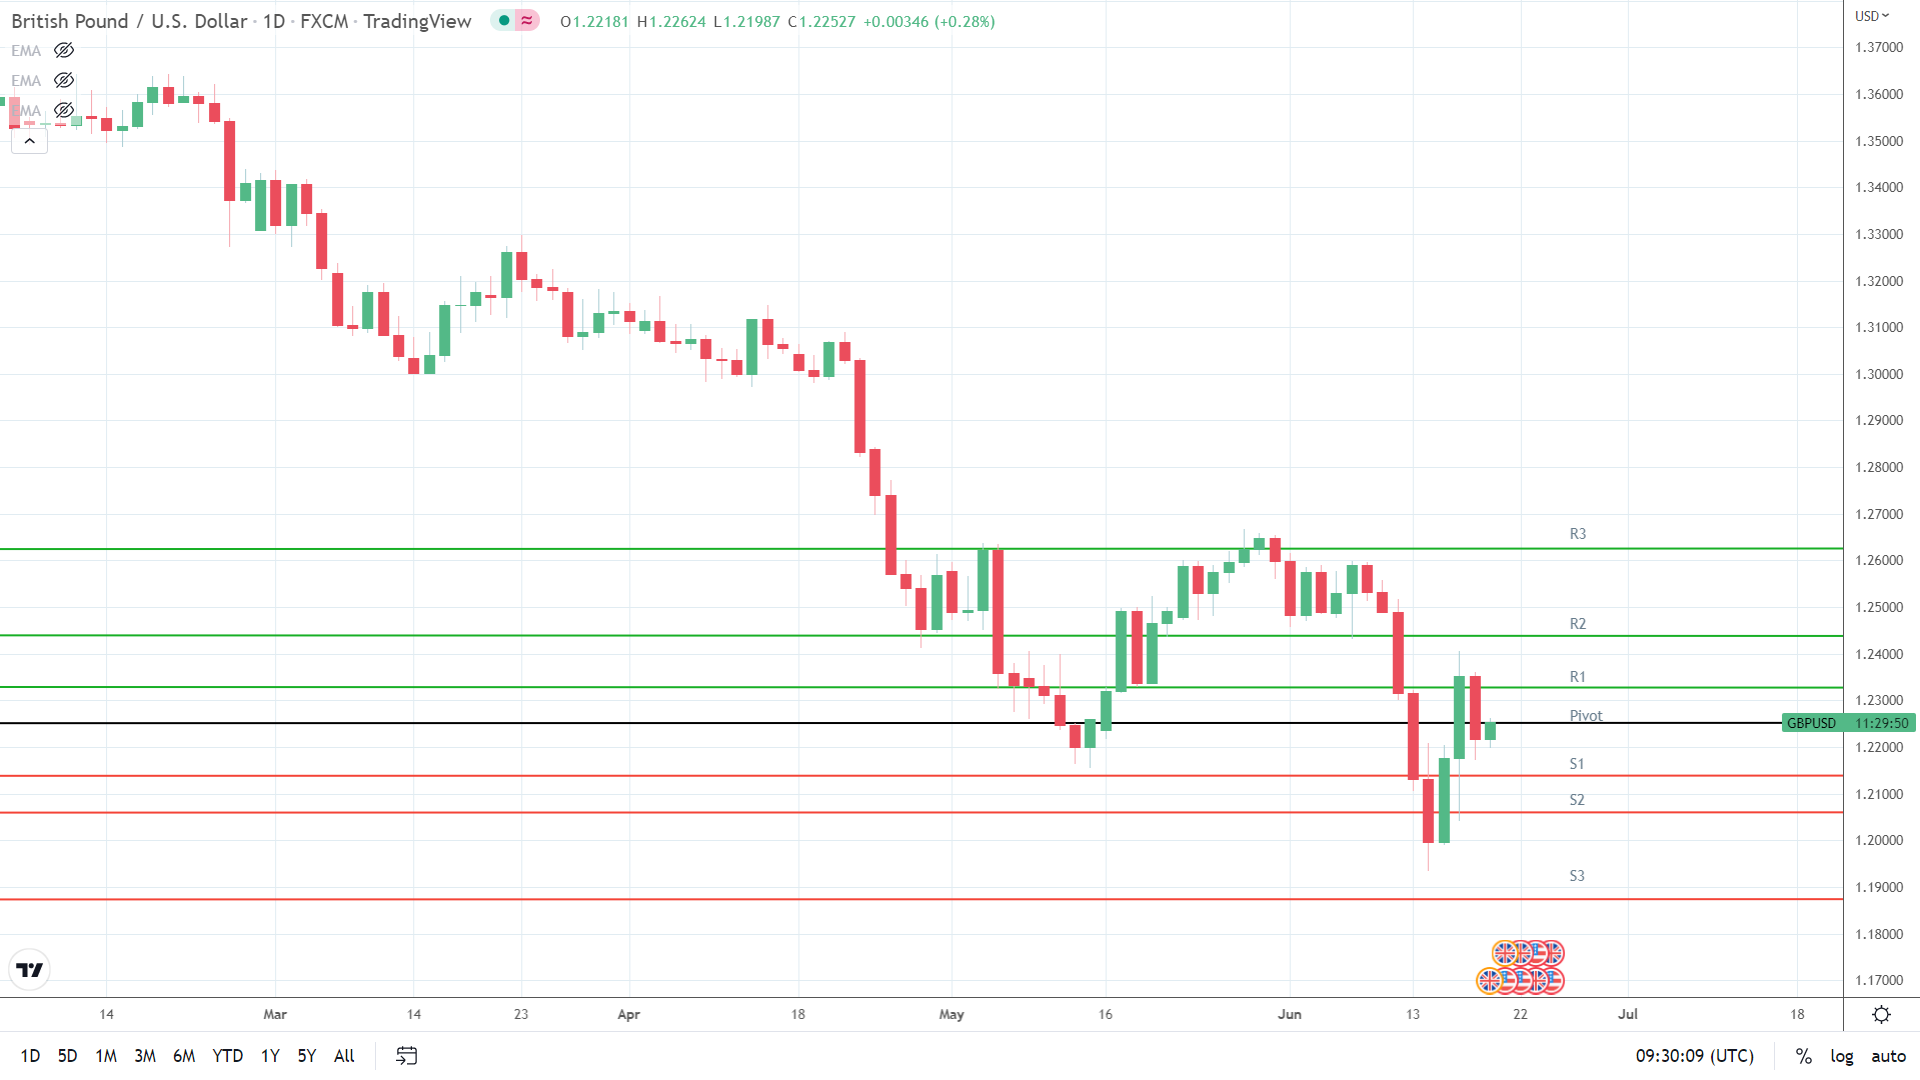
At the time of writing, the Pound was up by 0.28% to $1.22527.
A mixed start to the day saw the Pound fall to a low of $1.21987 before striking a high of $1.22624.
The Pound left the Major Support and Resistance Levels untested early on.
Technical Indicators
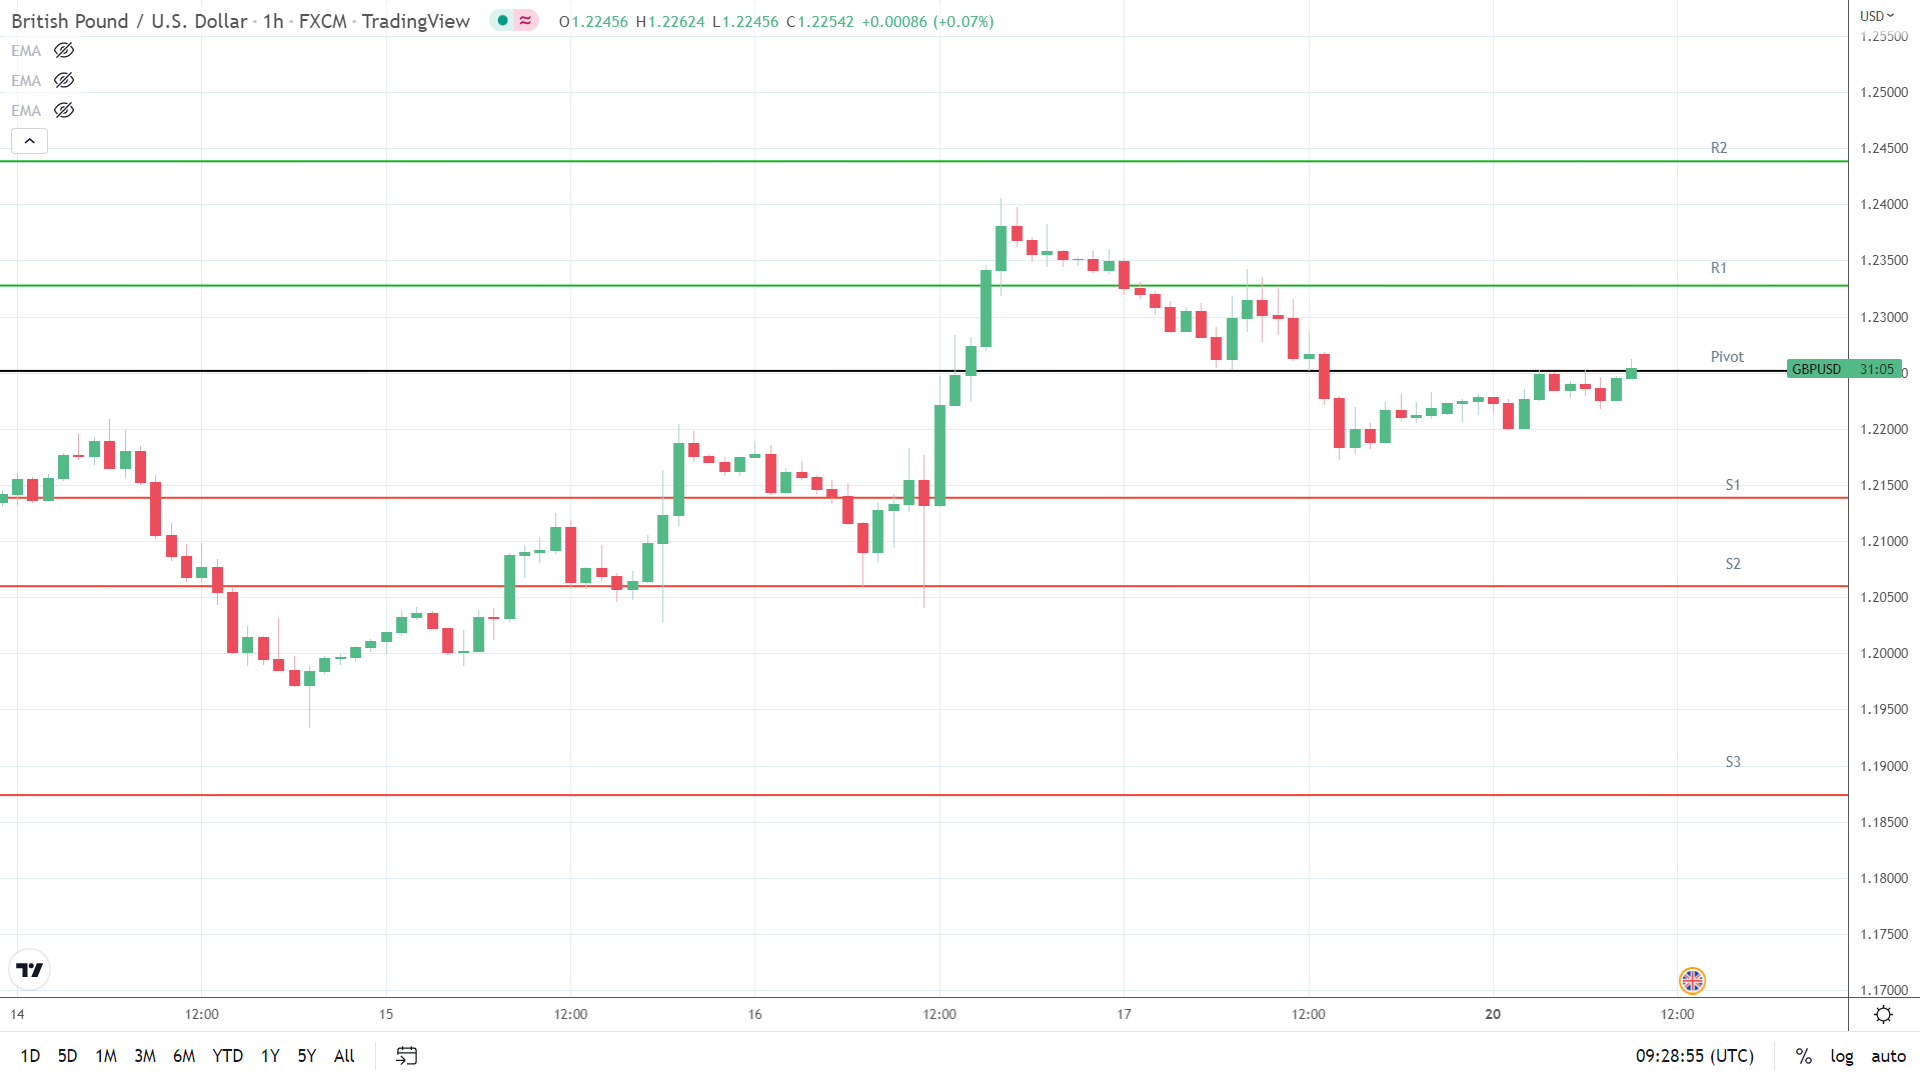
The Pound will need to avoid the $1.2250 pivot to target the First Major Resistance Level at $1.2328 and Friday’s high of $1.23602.
A pickup in market risk appetite would support a return to $1.23.
An extended rally would test the Second Major Resistance Level at $1.2438 and resistance at $1.2450. The Third Major Resistance Level sits at $1.2626.
A fall through the pivot would bring the First Major Support Level at $1.2140 into play.
Barring an extended sell-off throughout the day, the Pound should avoid the Second Major Support Level at $1.2063. Support at $1.21 should limit the downside.
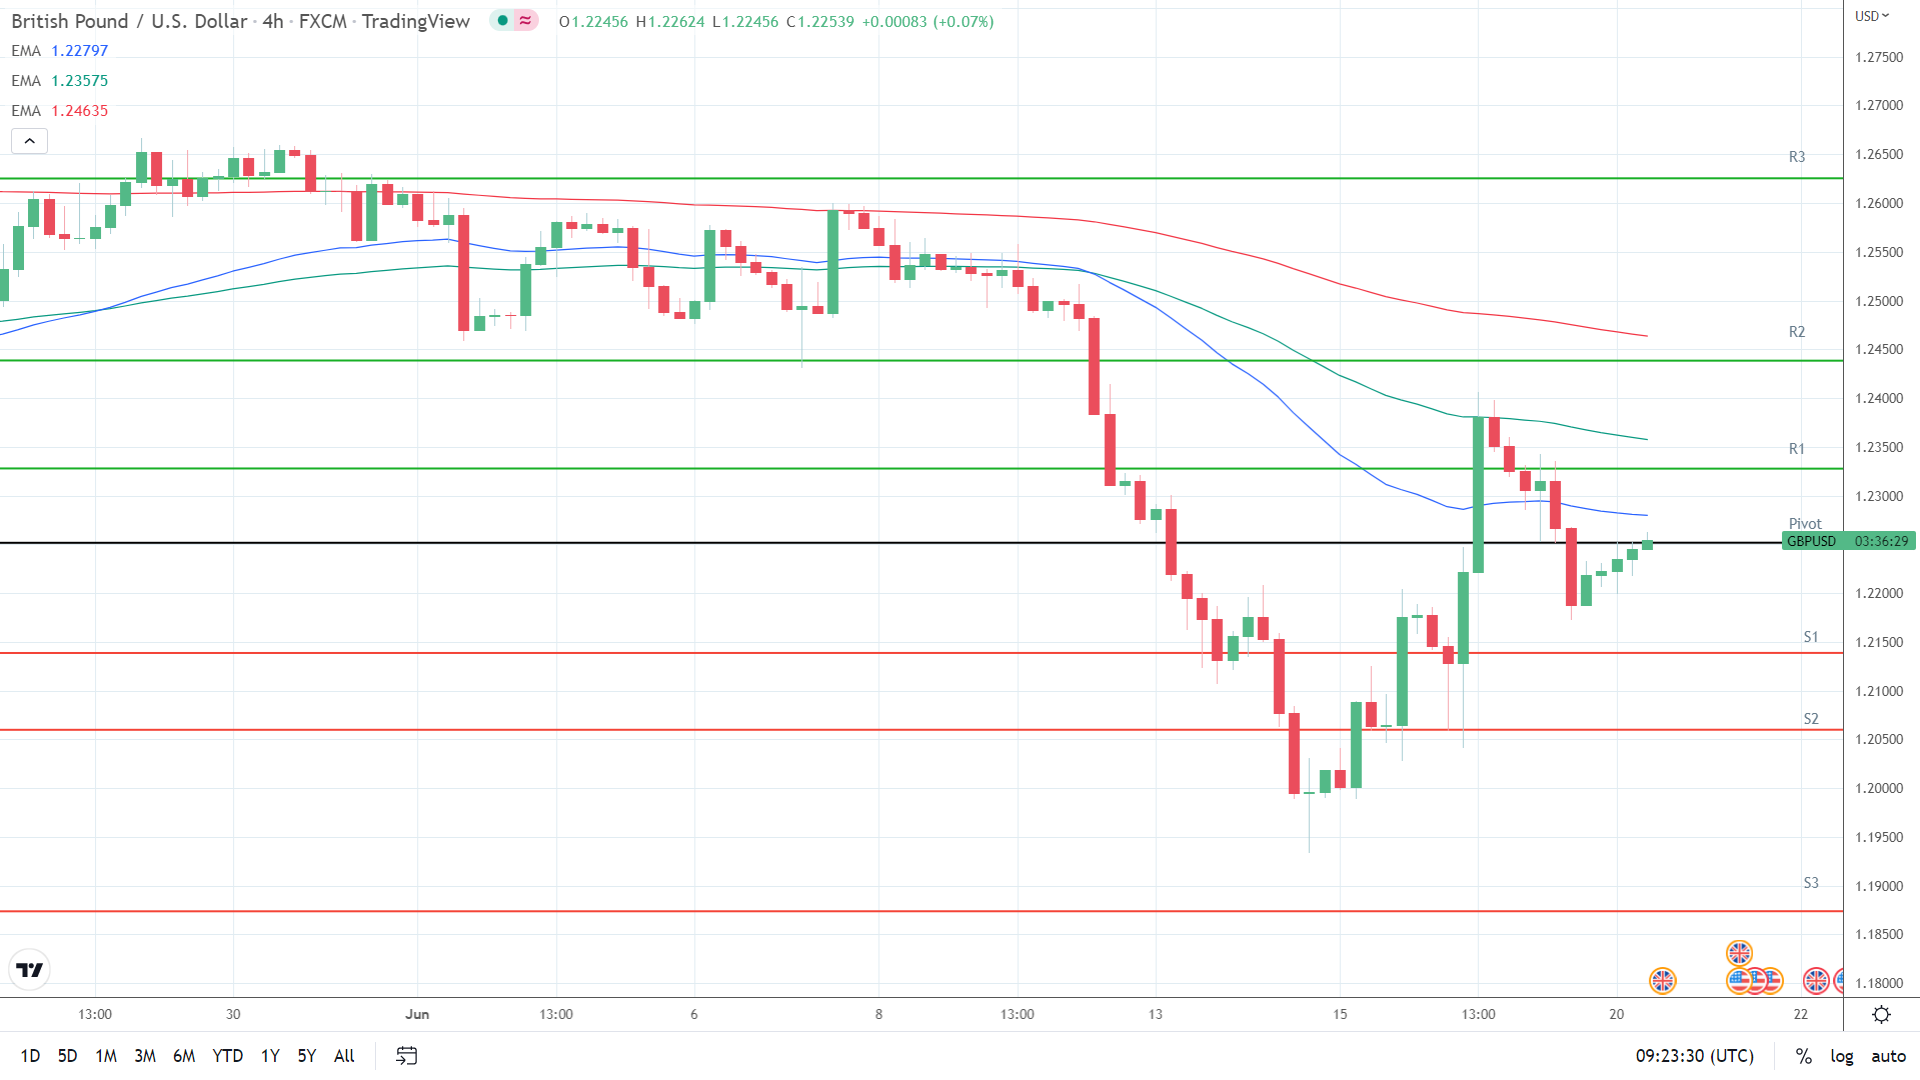
Looking at the EMAs and the 4-hourly candlestick chart (below), it is a bearish signal.
At the time of writing, the Pound sat below the 50-day EMA, currently at $1.22797. The 50-day EMA fell back from the 100-day EMA. The 100-day EMA eased back from the 200-day EMA: Pound negative.
A move back through the 50-day EMA would support a breakout from the 100-day EMA, currently at $1.23575, to bring the Second Major Resistance Level into play.
About the Author
Bob Masonauthor
With over 20 years of experience in the finance industry, Bob has been managing regional teams across Europe and Asia and focusing on analytics across both corporate and financial institutions. Currently he is covering developments relating to the financial markets, including currencies, commodities, alternative asset classes, and global equities.
Latest news and analysis


Advertisement