
Advertisement
Advertisement
Gold Price Futures (GC) Technical Analysis – Gains Capped by Steep Fed Rate Hike Expectations
By:
Wholesale prices rose at a brisk pace in May as inflation pressures mounted on the U.S. economy, the Bureau of Labor Statistics reported Tuesday.

Gold futures are steady but lower on Tuesday as the rally in the dollar took a breather, and Treasury yields dipped. Nonetheless, gains are being limited by expectations of aggressive rate hikes from the U.S. Federal Reserve.
At 12:55 GMT, August Comex gold is trading $1822.40, down $9.40 or -0.51%. On Monday, the SPDR Gold Shares ETF (GLD) settled at $169.99, down $4.55 or -2.61%.
Trader’s Pricing 75-Basis Point Rate Hike from Fed
After Friday’s surprisingly strong U.S. consumer inflation report, traders are now looking for the Fed to raise interest rates 75-basis points at the conclusion of the two-day meeting on Wednesday. According to the CME’s Fedwatch Tool, traders are expecting 75-basis point rate hikes in June and July, and a 50-basis-point rise in September.
Producer Prices Jump 10.8% in May
Wholesale prices rose at a brisk pace in May as inflation pressures mounted on the U.S. economy, the Bureau of Labor Statistics reported Tuesday.
The producer price index (PPI) a measure of the prices paid to producers of goods and services, rose 0.8% for the month and 10.8% over the past year. The monthly rise was in line with Dow Jones estimates and a doubling of the 0.4% pace in April. The Core PPI rose 0.5% on the month, slightly below the 0.6% estimate.
Daily Swing Chart Technical Analysis
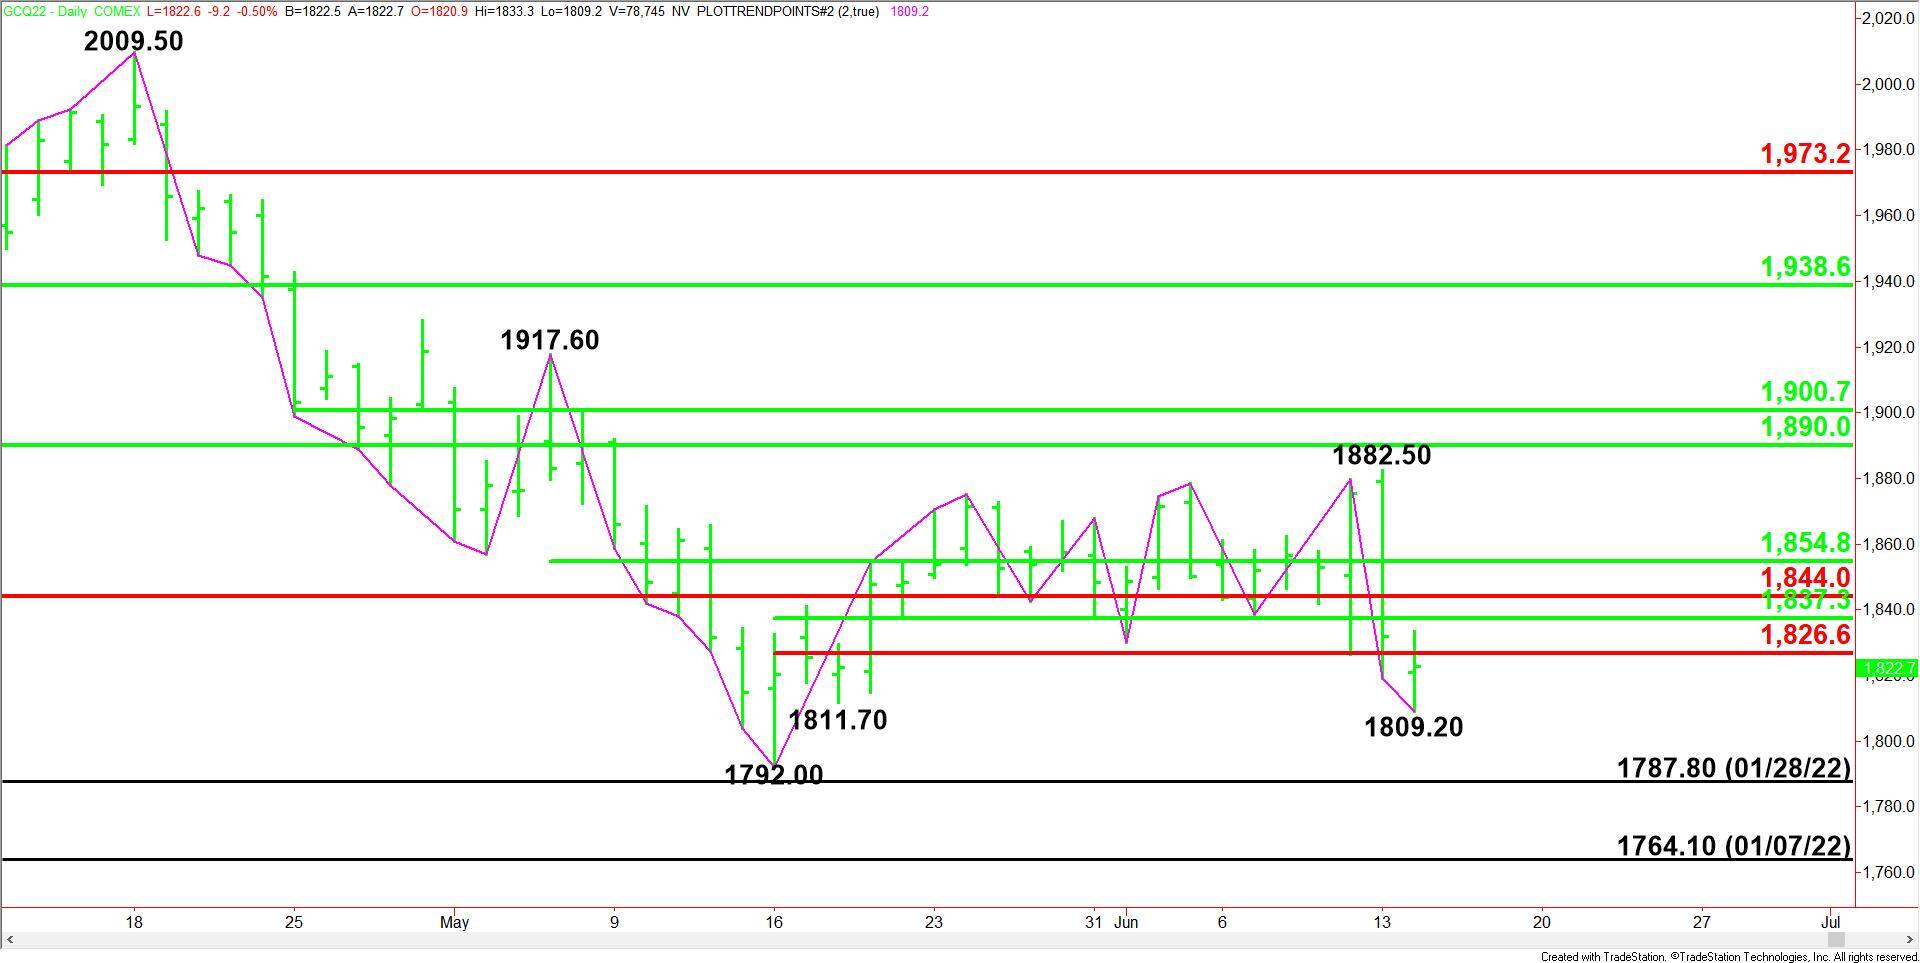
The main trend is down according to the daily swing chart. A trade through $1809.20 will signal a resumption of the downtrend. A move through $1882.50 will change the main trend to up.
Resistance is a series of retracement levels at $1826.60, $1837.30, $1844.00 and $1854.80. The most important price is the long-term Fibonacci level at $1844.00.
Daily Swing Chart Technical Forecast
Trader reaction to $1831.80 is likely to determine the direction of the August Comex gold futures contract on Tuesday.
Bearish Scenario
A sustained move under $1831.80 will indicate the presence of sellers. Taking out $1826.60 will indicate the selling pressure is getting stronger. This could lead to a retest of the intraday low at $1809.20.
Taking out $1809.20 could trigger an acceleration into the main bottom at $1792.00, followed by the January 28 main bottom at $1787.80.
Bullish Scenario
A sustained move over $1831.80 will signal the presence of buyers. This could lead to a labored rally because of potential resistance at $1837.30, $1844.00 and $1854.80.
Although overtaking $1844.00 will be a sign of strength, the minor 50% level at $1854.80 is the actual trigger point for an acceleration into $1882.50.
For a look at all of today’s economic events, check out our economic calendar.
About the Author
James Hyerczykauthor
James Hyerczyk is a U.S. based seasoned technical analyst and educator with over 40 years of experience in market analysis and trading, specializing in chart patterns and price movement. He is the author of two books on technical analysis and has a background in both futures and stock markets.
Did you find this article useful?
Latest news and analysis


Advertisement