Advertisement
Advertisement
Basic Ichimoku Trading System
Updated: Mar 5, 2019, 14:40 GMT+00:00
Intro
The basic Ichimoku Kinko trading system is a trend following chart trading strategy that can be used on nearly every asset using multiple timeframes. The
The basic Ichimoku Kinko trading system is a trend following chart trading strategy that can be used on nearly every asset using multiple timeframes. The strength of the system is that it provides a trader with multiple data points in an effort to give an investor a robust view of price action. The Ichimoku is a visual system which provides traders with specific filters assisting in the process of determining high and low probability trade setups.
The basic Ichimoku trading system combines 5-individual components in evaluating a trading decision. The components are not to be used individually, but instead in conjunction to assist in forming a complete picture of the current market environment. A basic Ichimoku chart may provide a trader with a clear understanding of market sentiment, relative strength and momentum. In conjunction a trader may be able to analyse the strength of a given market trend.
The price of a security is consistently moving in and out of balance. When price action moves out of balance, the movements are usually sharp and quick until the balance is found and a new range is created. Fear and greed play a constant role in market price action and the Ichimoku system may help depict a reflection of a market balance and imbalance.
The Indicators
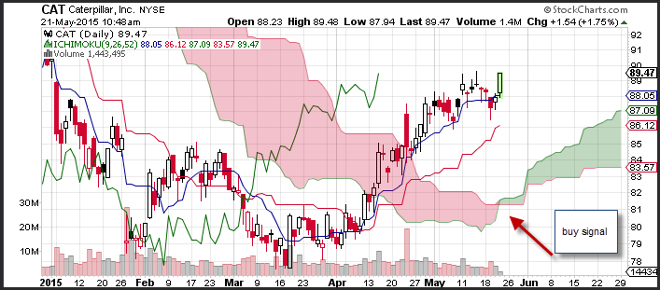
There are five components that make up the Ichimoku Cloud chart. They include the conversion line which is the 9-period mean that is calculated as the 9-period high + the 9-period low divided by 2. The default for the base line is the mean for the 26-period mean which is calculated in the same way as the conversion line. The first leading span is the mean of the conversion line and the base line. The first leading span reflects the two Ichimoku boundaries. The default calculation for the second leading span is the mean of the 52-period high and the 52-period low. This value is plotted 26-periods in the future and creates the basis for the slower cloud boundary.
Basic Trading Strategy
The Ichimoku cloud is used to evaluate the market trend and to form a bias of a future trend. Once a trading bias is generated the investor may wait for the market to correct and for the price to cross below the base line. A buy signal is triggered when prices cross the conversion line signaling the end of a correction.
The system has a very similar order for a sell signal. Again a trend bias has to be established that the trend is downward. This means the price of a security is either below the cloud or has yet to break above cloud resistance. Following the trend bias, prices need to move above the base line to establish a correction in the trend. Once this occurs a sell signal is triggered when prices reverse and move below the conversion line.
Risk warning: Forward Rate Agreements, Options and CFDs (OTC Trading) are leveraged products that carry a substantial risk of loss up to your invested capital and may not be suitable for everyone. Please ensure that you understand fully the risks involved and do not invest money you cannot afford to lose. Our group of companies through its subsidiaries is licensed by the Cyprus Securities & Exchange Commission (Easy Forex Trading Ltd- CySEC, License Number 079/07), which has been passported in the European Union through the MiFID Directive and in Australia by ASIC (Easy Markets Pty Ltd -AFS license No. 246566).
This article is a guest blog written by easy-forex
About the Author
Advertisement
