Advertisement
Advertisement
Bollinger Bands
Updated: May 24, 2020, 07:14 GMT+00:00
Intro
Markets may be placed into two categories, ranges and trends. A range is a defined period, which may be measured using a specific high and a low point that is defined, while a trend describes a period when the price of a security continues to move in the same direction and continues to perpetuate over time.
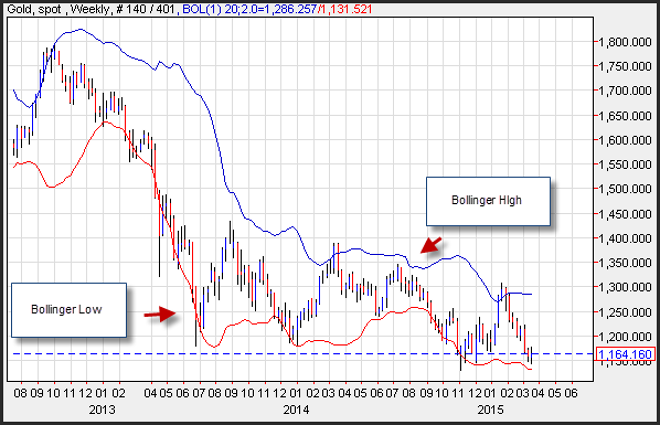
A technical analysis tool that is often used to find support and resistance levels, helps to define ranges and can evaluate a trend are Bollinger Bands. Invented by John Bollinger, the Bollinger band is a technical analysis tool that uses a statistical calculation to provide the user with a 20-day moving average, along with support and resistance levels that represent the 2-standard deviation point above and below the 20-day moving average.
The two standard deviation bands incorporate 95% of all the data, and change in a way similar to the moving average, in which the furthest period is replaced by the current period. When price action touches the lower Bollinger Band, it is likely to return to the moving average. When price action touches the upper Bollinger Band, it is also likely to return to the moving average. This is an example of defining a range. The Bollinger band low acts as support while the Bollinger band high acts as resistance.
Trading Using Bollinger Bands
When prices reach the upper Bollinger band they are considered relatively high and when prices reach the lower Bollinger band are considered relatively low. However, prices sometimes spike or drop which means that the levels created by the Bollinger bands are only guides. Bollinger bands incorporate 95% of all price action which means there is 5% which is unaccounted for by the study.
To avoid selling when the market is continuing to move higher or buying when the market is continuing to move lower, a trader should seek confirmation from other technical tools to find a prudent entry point.
For example, a trader might use trend lines as an additional confirmation of resistance and support. A Bollinger band that coincides with an upside trend line break out is likely a weak source of resistance. This is because the “normal” resistance of the upper Bollinger band is being overwhelmed by the thrust of the breakout.
Bandwidth
Bollinger bands reflect the compression of energy stored within a market, and describe the psychology related to this energy. As Bollinger bands narrow, energy becomes more compressed, which, when released can generate significant market volatility.
Bandwidth is defined as the mathematical difference between the upper and lower Bollinger bands. When Bandwidth is low, this indicates that volatility is usually also low. This is a typical condition for slow grinding up trends and this situation can continue for long periods of time. However, volatility contractions can take place at any “slow” market period. When Bandwidth is high, it signals a period of volatility expansion. This happens during big moves that usually accompany rapid drops or other strong directional moves. Market volatility is like an accordion. Volatility compression leads to volatility expansion and vice versa. In general, volatility compressions can last much longer than people expect.
Market volatility is like an accordion. Volatility compression leads to volatility expansion and vice versa. In general, volatility compressions can last much longer than people expect.
Risk warning: Forward Rate Agreements, Options and CFDs (OTC Trading) are leveraged products that carry a substantial risk of loss up to your invested capital and may not be suitable for everyone. Please ensure that you understand fully the risks involved and do not invest money you cannot afford to lose. The information provided can under no circumstances be considered as a recommendation to engage in any trade. Our group of companies through its subsidiaries is licensed by the Cyprus Securities & Exchange Commission (Easy Forex Trading Ltd- CySEC, License Number 079/07), which has been passported in the European Union through the MiFID Directive and in Australia by ASIC (Easy Forex Pty Ltd -AFS license No. 246566).
About the Author
Advertisement
Table of Contents
Advertisement
Advertisement
Advertisement
Advertisement
