Advertisement
Advertisement
Price Action Momentum Using the MACD
Updated: Mar 5, 2019, 14:40 GMT+00:00
Intro
Momentum of a financial market captures the rate of change of a specific market. So it’s not the actual change of a security, but it’s the measurement of
Momentum of a financial market captures the rate of change of a specific market. So it’s not the actual change of a security, but it’s the measurement of whether the change is increasing or decreasing. As markets accelerate in one direction, traders who are interested in capturing quick movements may use a number of indicators which reflect market momentum. Think about it as a ball rolling down a hill. The more it accelerates the more likely it will continue to move in the same direction. Sure it can stop, but it would likely need a specific impetus to stop it.
The MACD (moving average convergence divergence index), created by Gerald Appel is a momentum indicator that may be used to capture momentum as well as divergence. Momentum reflects acceleration, while divergence, which includes overbought and oversold levels, reflect a potential counter move.
MACD – Moving Average Convergence Divergence Index
This indicator creates an index level by calculating the change in 2-moving averages (the spread) relative to the 9-day moving average of the spread. The 2-moving averages that are used as defaults are the 12-day moving average and the 26-day moving average. If the spread is less than the 9-day moving average of the spread, the index is negative and therefore momentum is negative. If the spread is above the 9-day moving average of the spread, the index is positive and therefore momentum is positive.
Although these levels are considered the defaults, a trader may use shorter term moving averages to catch trends that are likely on a shorter term basis. For example, many traders use the 5 and 13 day moving average, and compare this spread to the 6-day moving average of the spread.
Trading with the MACD
There are two general ways to use the MACD to trade the financial market. The first is to look for periods when the index moves from negative to positive or positive to negative. This occurs when the spread crosses above or below the 9-day moving average of the spread.
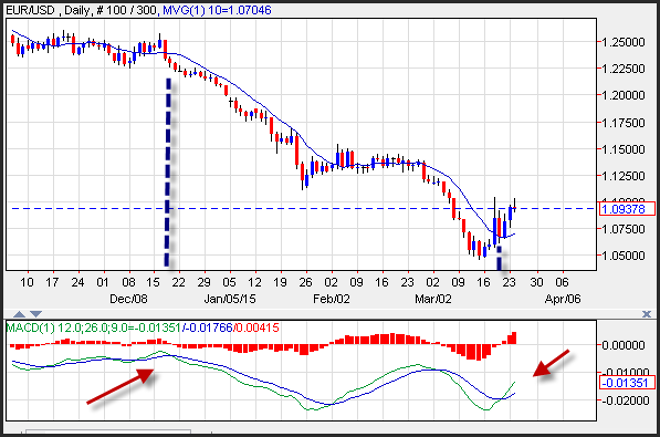
When this occurs, as can be seen in at the point reflected by the red arrow, momentum is accelerating to the upside or downside. In December of 2014 the MACD generated a sell signal and foreshadowed a trend that continued until the middle of March 2015. The MACD at that time generated a buy signal.
A second way that some traders use the MACD is to look for periods when the MACD is diverging from price action. They may do this because when prices are moving higher, but the MACD contracts, the MACD is said to be diverging. This might signal a potential reversal in price action.
A mental picture of divergence can be described by a car driving on up an incline. Initially when the driver lets up on the gas, the car will continue to move at a quick pace, but eventually momentum decelerates, and the car will slow to a stop and would even roll backwards if the brake is not applied!
Risk warning: Forward Rate Agreements, Options and CFDs (OTC Trading) are leveraged products that carry a substantial risk of loss up to your invested capital and may not be suitable for everyone. Please ensure that you understand fully the risks involved and do not invest money you cannot afford to lose. Our group of companies through its subsidiaries is licensed by the Cyprus Securities & Exchange Commission (Easy Forex Trading Ltd- CySEC, License Number 079/07), which has been passported in the European Union through the MiFID Directive and in Australia by ASIC (Easy Markets Pty Ltd -AFS license No. 246566).
This article is a guest blog written by easy-forex
About the Author
Advertisement
